Detection of a large fraction of atomic gas not associated with star-forming material in M17 SW
Abstract
Context. The [C II] 158 m line is one of the dominant coolants of the ISM, and an important probe with which to study the star formation process. Recent Herschel/HIFI and SOFIA/GREAT observations showed that assuming the total velocity-integrated intensity of this line is directly associated with the star-forming material is inadequate.
Aims. We probe the column densities and masses traced by the ionized and neutral atomic carbon with spectrally resolved maps, and compare them to the diffuse and dense molecular gas traced by [C I] and low- CO lines toward the star-forming region M17 SW.
Methods. We mapped a 4.1 pc 4.7 pc region in the [C I] 609 m line using the APEX telescope, as well as the CO isotopologues with the IRAM 30m telescope. Because of the velocity-resolved spectra, we analyze the data based on velocity channel maps that are 1 wide. We correlate their spatial distribution with that of the [C II] map obtained with SOFIA/GREAT. Optically thin approximations were used to estimate the column densities of [C I] and [C II] in each velocity channel.
Results. The distribution of the emission from the isotopologues 13CO, C17O, and C18O resembles more closely that of the [C I] emission than that of the 12CO emission. The spatial distribution of the [C I] and all CO isotopologues emission was found to be associated with that of [C II] in about 20%–80% of the mapped region, with the high correlation found in the central (15–23 ) velocity channels.
Conclusions. The excitation temperature of [C I] ranges between 40 K and 100 K in the inner molecular region of M17 SW. Excitation temperatures up to 200 K are found along the ridge. Column densities in 1 channels between 10 and 10 were found for [C I]. Just 20 % of the velocity range (40 ) that the [C II] line spans is associated with the star-forming material traced by [C I] and CO. The total (integrated over the 0–40 velocity range) gas mass estimated from the [C II] emission gives a lower limit of 4.4103 . A very large fraction of at least 64% of this mass is not associated with the star-forming material in M17 SW. We also found that about 36%, 17%, and 47% of the [C II] emission is associated with the H II, H I, and H2 regimes, respectively. Comparisons with the H41 line shows an ionization region mixed with the neutral and part of the molecular gas, in agreement with the clumped structure and dynamical processes at play in M17 SW. These results are also relevant to extra-galactic studies in which [C II] is often used as a tracer of star-forming material.
Key Words.:
galactic: ISM — galactic: individual: M17 SW — radio lines: galactic — molecules: CO — atoms: [C I], [C II]1 Introduction
In order to advance our understanding of the ambient conditions of star formation, observations of large areas of known massive Galactic star-forming regions have been done over a wide range of wavelengths. Observations of low- and mid- transitions of 12CO towards several massive star-forming regions have shown that warm and dense gas is usually confined to narrow ( pc) zones close to the ionization front (e.g., Harris et al. 1987; Graf et al. 1993; Yamamoto et al. 2001; Kramer et al. 2004, 2008; Pérez-Beaupuits et al. 2010). Although slow shocks and cloud-cloud collisions can be an important source of heating in high velocity wing objects like Orion, W51, and W49 (Jaffe et al. 1987), narrow mid- 12CO lines, as well as the parameters needed to explain the CO observations, favor photoelectric heating of the warm gas located beyond the H II region driven by the UV radiation field emerging from an ionizing source, the so-called photon-dominated region (PDR).
A vast amount of data also shows that molecular clouds are clumpy over a wide range of scales, from giant molecular clouds containing smaller subclouds, to small dense cores within the subclouds. The clumpiness of molecular clouds is relevant for the understanding of fragmentation processes that can lead to compact condensations that may collapse to form stars (e.g., Carr 1987; Banerjee et al. 2004; Klessen et al. 2005; Hocuk & Spaans 2010; Clark et al. 2011; Federrath & Klessen 2012, and references therein). Several efforts have been made over the past years to identify clumps, their size, line width, and mass, among other parameters. The complex line profiles observed in optically thin lines (e.g., [C I], CS, C18O, 13CO) and their velocity-channel maps, are indicative of the clumpy structure of molecular clouds and allow a robust estimation of their clump mass spectra (e.g., Carr 1987; Loren 1989; Stutzki & Güsten 1990; Hobson 1992; Kramer et al. 1998, 2004; Pérez-Beaupuits et al. 2010).
Inhomogeneous and clumpy clouds, as well as a partial face-on illumination, in star-forming regions like M17 SW, NGC3603, S140, the Orion Molecular Cloud, and the NGC 7023 Nebula, are thought to produce extended emission of the atomic lines [C I] and [C II], and suppress the stratification in [C II], [C I], and CO expected from standard 1-D steady-state PDR models, which is not observed in several sources (e.g., Keene et al. 1985; Genzel et al. 1988; Stutzki et al. 1988; Spaans & van Dishoeck 1997; Gerin & Phillips 1998; Yamamoto et al. 2001; Schneider et al. 2002; Röllig et al. 2011; Mookerjea et al. 2003; Pérez-Beaupuits et al. 2010).
Massive star-forming regions like the Omega Nebula M17, with an edge-on view (particularly in its southwest region), are ideal sources to study the clumpy structure of molecular clouds, as well as the chemical and thermodynamic effects of the nearby ionizing sources. The southwest region of M17 (M17 SW) concentrates molecular material in a clumpy structure. Models based on far-IR and submillimeter observations (Stutzki et al. 1988; Meixner et al. 1992) suggest that the distribution and intensity of the emissions observed in the M17 SW complex, can be explained with high density () clumps embedded in an interclump medium () and surrounded by a diffuse halo ().
The central cluster of more than 100 stars that illuminates M17 SW is NGC 6618 (e.g., Lada et al. 1991; Hanson et al. 1997). The two components of the massive binary CEN1 (Kleinmann 1973; Chini et al. 1980) are part of the central cluster NGC 6618 and are separated by . This source, originally classified as a double O or early B system by Kleinmann (1973), is actually composed of two O4 visual binary stars, named CEN 1a (NE component) and CEN 1b (SW component), and it appears to be the dominant source of photo-ionization in the whole M17 region (Hoffmeister et al. 2008).
Recent SOFIA/GREAT observations of the velocity-resolved [C II] spectra showed that a large fraction (60%) of the [C II] emission, observed at the lower (10 ) and higher (24 ) velocity channels, is not associated with the star-forming material (denser and colder gas) traced by species like CO and [C I], which has an average line width of 5 to 10 centered at (Pérez-Beaupuits et al. 2012, 2013). Only the central narrow (1 ) channel maps of the velocity-resolved [C II] spectra show a spatial association with other gas tracers (e.g., [C I] and 12CO). The broader velocity range covered by the [C II] line with respect to the [C I] and 12CO has to be associated with additional material, either lower density clumps or more diffuse, possibly ablated material, resulting in additional layers of ionized carbon gas within the telescope beam. The [C II] emission have been found to extend at least in the sky (Russell et al. 1981), and 15 pc into the M17 SW molecular region (Stutzki et al. 1988). The spatial distribution of the [C II] emission (and abundance) in the southern region of M17 SW does not follow theoretical predictions of stratified or clumpy PDR models (Pérez-Beaupuits et al. 2012).
In earlier works, high resolution maps of high- and mid- CO lines, the fine-structure transition of [C I], and the [C II] 158 m emission, have been reported (Pérez-Beaupuits et al. 2010, 2012). In this study we present a new high resolution map of the fine-structure transition of [C I], as well as maps of the and transitions of 12CO and its isotopologues. In contrast to [C II] 158 m (and [O I] 63 m, not included in the present data set), PDR models predict that the intensity of the [C I] fine structure lines do not have a strong dependence on UV energy density (e.g., Hollenbach & Tielens 1999). Therefore, in a clumpy cloud irradiated by UV photons, the intensity of the [C I] emission is expected to be proportional to the number of photodissociation surfaces of clumps along the line of sight (e.g., Spaans 1996; Howe et al. 2000; Kramer et al. 2004). Since several velocity components along the line of sight can be found in a clumpy medium, we present our analysis and discussions of the new results based on velocity channel maps, showing the temperatures of the lines integrated over a narrow 1 channel width. From them we estimate the excitation temperature and column density of [C I], as well as the column density of [C II] and the gas mass not associated with the star-forming material traced by [C I] and the CO isotopologues.
The organization of this article is as follows. In Sect. 2 we describe the observations. The maps of the observed lines are presented in Sect. 3. The excitation temperature and column densities, as well as mass estimates, are presented in Sect. 4. In Sect. 5 we estimate the [C II] emission not associated with other gas tracers. The conclusions and final remarks are presented in Sect. 6.
2 Observations
2.1 The APEX data
We used the higher frequency band of the dual channel receiver FLASH (Heyminck et al. 2006, hereafter FLASH-460) on the Atacama Pathfinder EXperiment (APEX111This publication is based on data acquired with the Atacama Pathfinder Experiment (APEX). APEX is a collaboration between the Max-Planck-Institut für Radioastronomie, the European Southern Observatory, and the Onsala Space Observatory; Güsten et al. 2006) during October 2009 to map the 609 m (hereafter ) fine-structure transition of [C I] at 492.161 GHz. The observed region covers about (4.1 pc 4.7 pc) compared to the (3.4 pc 3.0 pc) area previously mapped for [C I] 370 m (hereafter ) with CHAMP+ (Pérez-Beaupuits et al. 2010). The [C I] was observed in on-the-fly (OTF) slews in RA ( arcsec long). Because the beam size of APEX at 492 GHz is about , the subsequent scans in Declination and RA were spaced apart.
The total power mode was used for the observations, nodding the antenna prior to each OTF and raster slew to an off-source position (,), east of the star SAO 161357. This is used as the reference position (, ) in the maps and throughout the paper, with RA(J2000)=18:20:27.64 and Dec(J2000)=-16:12:00.90. The OFF position at was determined to be clean, even in the [C I] and mid- 12CO lines. The reference for continuum pointing was Sgr B2(N) and the pointing accuracy was better than for all the maps. The data were processed during the observations with the APEX real-time calibration software (Muders et al. 2006), assuming equal gains for the signal and image sidebands.
A fast Fourier transform spectrometer (FFTS), providing 1.5 GHz bandwidth and 2048 channels (Klein et al. 2012), was used for the [C I] map. The on-source integration time per dump was 1 second for the OTF map of [C I] , and the average DSB system noise temperature of the FLASH-460 was about 810 K.
Observations toward Jupiter were performed during October 2009 to estimate the beam coupling efficiency () of the FLASH-460, assuming a brightness temperature of 158 K for this planet at 492 GHz, as interpolated from data reported in Griffin et al. (1986).
2.2 The IRAM 30m data
We used four frequency setups of the broadband EMIR receivers (Carter et al. 2012) at IRAM 30m to map a similar area to the one mapped in [C I] with the APEX telescope. The 32 GHz signal bandwidth provided by the IF channels were used for the receiver bands E090 (3mm) and E230 (1.3mm), covering each sideband with 8 GHz bandwidth in single polarization. These setups allowed us to fully map all the CO isotopologues (in addition to many other molecules) in their and transitions. The beamwidths (FWHM) for the transitions of 12CO, 13CO, C18O, and C17O are , , , and , respectively. We also detected, by serendipity, the hydrogen recombination lines H39, H40, and H41 (283) in the 3mm band.
The total region mapped of about 360300′′ was covered with two long OTF maps of 360160′′ (with an overlap of 20′′ between them) and slews in RA ( arcsec long) with steps of 4′′ in Dec. The off-source reference position was observed for 10 seconds every two OTF subscans (rows). The on-source integration time per dump was 0.5 second.
In order to ensure atmospheric stability, we used the same nearby off-source reference position (345′′,-230′′) as for the [C II] map (Pérez-Beaupuits et al. 2012) obtained with the German REceiver for Astronomy at Terahertz frequencies (GREAT222GREAT is a development by the MPI für Radioastronomie and the KOSMA/ Universität zu Köln, in cooperation with the MPI für Sonnensystemforschung and the DLR Institut für Planetenforschung., Heyminck et al. 2012) on board the Stratospheric Observatory For Infrared Astronomy (SOFIA). From previous APEX observations (not reported here) of the 12CO and , we know that the reference position (345′′,-230′′) is not free of CO emission. Hence, for all the EMIR frequency setups, we first did a deep observation at the position (345′′,-230′′) against the reference that is even farther away at (3600′′, -1800′′) which, in turn, was verified to be CO emission-free against the offset position at (4600′′,-2800′′). Then we added the flux from the reference position (with about two orders of magnitude lower rms than the OTF spectra) back into the spectra from the OTF maps.
Beam coupling efficiencies for each individual line were obtained from interpolation of the values given in the online table of the IRAM 30m efficiencies333http://www.iram.es/IRAMES/mainWiki/Iram30mEfficiencies. With these beam coupling efficiencies, and a forward efficiency (0.95 for EMIR090, 0.94 for EMIR230, and 0.93 for EMIR150), we converted all data to the main beam brightness temperature scale, . The reduction of these calibrated data, as well as the maps shown throughout the paper, were done using the GILDAS444http://www.iram.fr/IRAMFR/GILDAS package CLASS90.
2.3 SOFIA [C II] observations
The [C II] 158 m map was already reported in Pérez-Beaupuits et al. (2012), where a detailed explanation of the calibration and the OTF maps was given. Here we use the same data as in the previous paper, convolved with a larger beam, and re-sampled the spectra to a 1 channel width, as explained in Sect. 5.
The SOFIA data is publicly available in the section “Data Archive & Retrieval” of the SOFIA Data Cycle System555https://dcs.sofia.usra.edu/. All the data presented in this work will be available as FITS files in the Strasbourg astronomical Data Center (CDS666http://cdsweb.u-strasbg.fr/).
3 Results
3.1 The [C I] integrated intensity maps
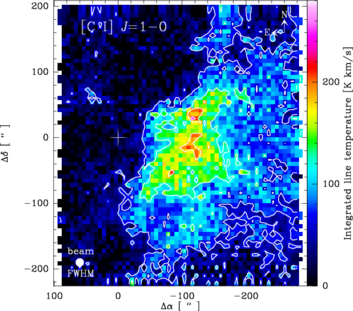
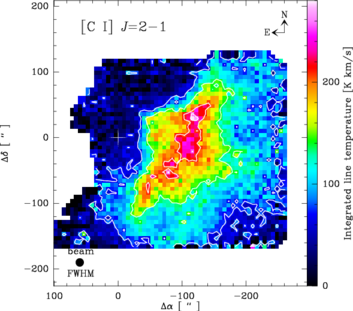
Figure 1 shows the maps of the intensity, integrated between 0 and 40 , of [C I] (top) and (bottom). Because the [C I] map was convolved to the larger beam size () of the transition, its peak integrated intensity is lower than the peak value previously reported in Pérez-Beaupuits et al. (2010). The peak integrated intensities of the maps shown here are 240 and 280 for the [C I] and lines, respectively.
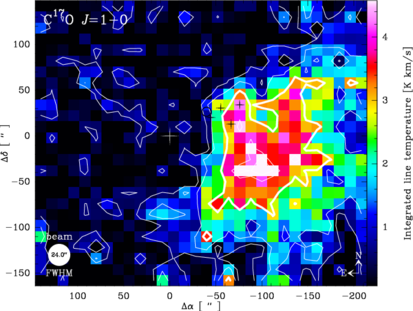
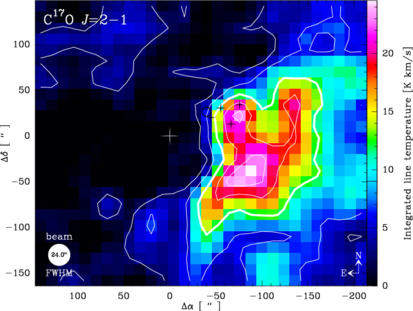
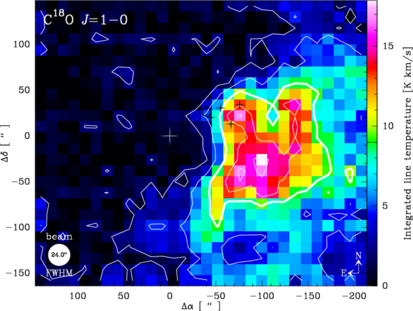
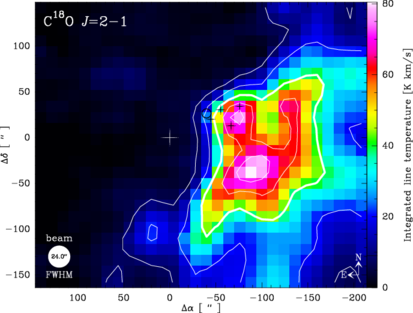
These lines follow a similar spatial distribution and their respective peaks are located at about the offset position , approximately 0.88 pc ( at P.A. ) from the ridge. They both present extended emission, unlike a theoretically expected stratified PDR. A spatial association between 13CO and [C I] was found by Keene et al. (1985), on a scale size of ( pc). We confirm these results with higher spatial resolution. We also add that, when looking at the overall distribution, the C17O and C18O emissions are more similar to the 13CO than to the 12CO emission and, hence, they also show a spatial association with the [C I] integrated emission. This spatial association is discussed further in the next section.
3.2 The CO integrated intensity maps
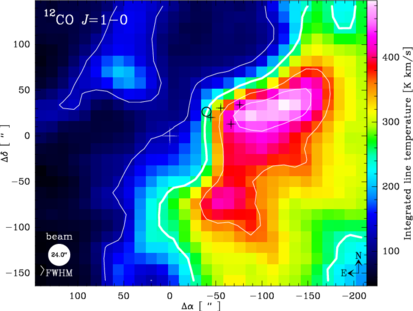
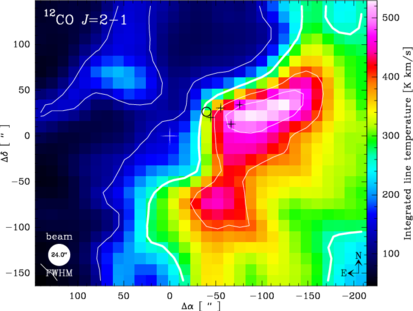
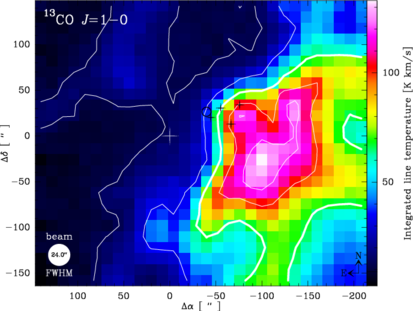
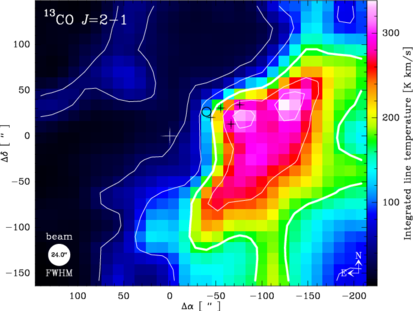
In order to compare them with the transitions, and to increase the S/N of the lines, all the maps (including the [C I] lines from Fig. 1) were convolved to the larger beam size (24′′) of the C18O line for the analysis presented in the next sections. Maps of the velocity integrated intensity of the 12CO emission, and its isotopologues 13CO, C17O, and C18O lines, are shown in Figs. 2 and 3.
The 12CO integrated emission is more extended, and its bulk emission does not resemble that of its isotope lines. In order to verify this, we use the scatter plots (Fig. 4) of the velocity-integrated intensity of these tracers, and the corresponding correlation coefficient described in Appendix C. The scatter plots deviate from the theoretical straight line expected for well-correlated maps. The 13CO/12CO plots show a well-separated optically thin (low intensities) and an optically thick (high intensities) branch. It is interesting to note that the optically thick branch still has a relatively good correlation. This shows the integrated intensity growth via line broadening at lower densities, fully in line with Larson’s law; i.e., the cloud size is inversely proportional to its density, and the velocity dispersion (or line broadening) is directly proportional to the cloud size, hence, the lower the density, the larger the cloud and the broader the lines.
We note, however, that even though the intensities of the 12CO and 13CO maps are very scattered (at the higher values) and show two branches with different slopes, the correlation coefficient is still relatively high, . These correlation coefficients are similar to those found between the and lines of 12CO and [C I], which are much better correlated, as shown in Fig. 28. A similar case is found when comparing the [C I] 370 m line with the transitions of the 13CO and C18O lines (bottom panel in Fig. 4). These scatter plots show values that are less scattered (supporting the similarity between the [C I] and the CO isotopologue lines mentioned above), while the correlation coefficient is similar to (or lower than) those found for maps with less similar spatial distribution (e.g., 12CO and 13CO ). This means the correlation coefficient is not robust enough to discriminate between “well” correlated and “not so well” correlated maps and, hence, it must be used with caution. Another way of using this statistical measure is to define a threshold to consider only regions of the map with high intensities, to compute the correlation coefficient as described in Sect. 5.1.
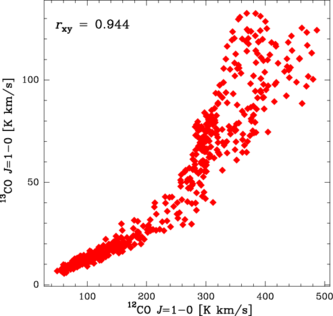
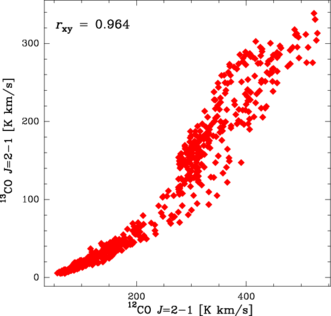
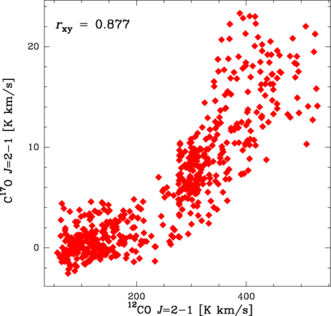
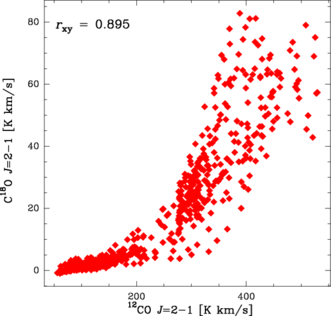
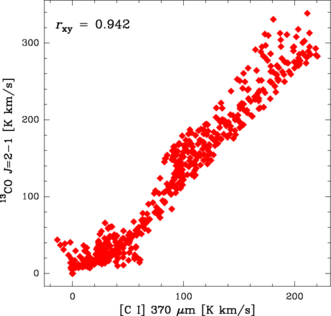
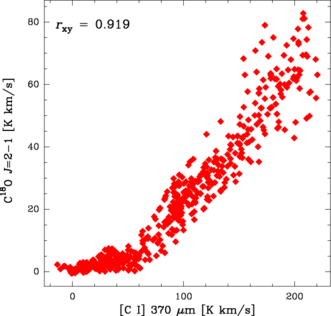
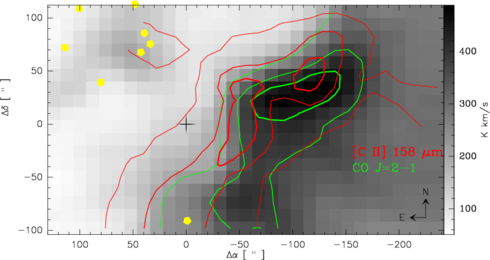
Figure 5 shows the overlay between the two and lowest energy transitions of 12CO and the [C II] 158 m line, both in the total velocity-integrated intensity and the 1 channel maps. We note that the velocity-integrated intensity of [C II] does not follow the spatial distribution of the 12CO emission. However, some spatial association between these lines can be seen in the channel maps, but only at the central 16–24 velocity channels, where the bulk of the 12CO emission is found.
New results in M17 SW have shown that a large fraction of the [C II] emission is not associated with other species (e.g., 12CO and [C I]) tracing the star-forming material when analyzed at narrow velocity channels (Pérez-Beaupuits et al. 2012, 2013). Hence, line integrated intensity maps have to be interpreted with great care, as a smaller or larger part of the line integrated emission, as in the case of [C II] here, may result in strong velocity components in one line, which are barely traceable in another line, like C18O or 13CO here, due to different physical origin and/or very different excitation conditions. This obviously also strongly affects the interpretation of line-integrated intensity ratios between different tracers. In fact, we do not find strong spatial associations when comparing the velocity integrated [C II] 158 m map from Pérez-Beaupuits et al. (2012, their Fig. 1) with the new CO and [C I] maps from Figs. 2 and 3. Therefore, in the following sections we present our new analysis and discussions based on velocity channel maps, showing the intensities of the lines integrated over a narrow (1 ) channel width.
4 Excitation and column density of [C I]
The critical density ( for collisions with o-/p-H2 at 100 K; from the LAMDA777http://www.strw.leidenuniv.nl/moldata/ database, Schöier et al. 2005) and upper-level energy ( K for , and K for ) of [C I] enable us to trace the diffuse () ISM and estimate its temperature. We note, however, that this does not imply that [C I] traces only diffuse gas, but also denser gas given the overall spatial association of the velocity-integrated intensities observed between [C I] and the CO isotopologues, as described in section 3.1.
We first estimate the excitation temperature of [C I] from the ratio between the two transitions, assuming optically thin emission. From this excitation temperature, the column density of [C I] can be estimated as well, assuming optically thin emission and LTE conditions. Then we compare the results with a non-LTE estimate at representative offset positions. This is done in section 4.2.
4.1 Excitation temperature of [C I]
We computed the ratio ([C I] 369m)/([C I] 609m) between the intensities of the [C I] lines integrated in narrow (1 ) velocity channels, for each channel map in the velocity range between 0 and 40 . We find observed values of 1R2, at the central velocity channels (16–24 ). Ratios lower than unity (which means subthermal excitation) are also observed in our maps, but mostly at velocity channels 16 and 24 , where the intensity of both lines is below 30% of their respective peak channel intensities, which is about the noise level of the fainter [C I] 609m line.
The observed ratios match the values expected in a PDR environment with low density () and relatively low radiation fields (, with in units of the ambient interstellar radiation field, , Habing 1968), as shown by Meijerink et al. (2007, their Fig. 3). These densities are also in agreement with previous estimates by Meixner et al. (1992), who concluded that the [C II], [C I], and low- CO lines emerge from an inter-clump medium, while the extended [C II] and [C I] emission emerges from a halo gas surrounding the clump and inter-clump material. However, the observed ratios are not exclusive of these ambient conditions, since they can also be found by extrapolating the values given by Meijerink et al. (2007, their Fig. 3) at higher densities () and even lower radiation fields (), which are naturally attenuated by the larger column densities of denser clumps.
As mentioned in Sect. 3.1, the total integrated intensity of the [C I] emission resembles that of the optically thin isotope CO lines, rather than that of the 12CO lines. The isotope lines have critical densities of (at 100–200 K) and trace the compact emission from the denser molecular clouds. Because of the self-pumping due to large optical depths resulting from the high abundance, the 12CO lines trace not only the denser molecular clouds, but also the more diffuse and extended emission beyond (i.e., east from) the ionization front. Hence, contrary to the general picture proposed by Meixner et al. (1992), we favor a scenario where part of the [C I] emission emerges from an inter-clump medium rather than from a more diffuse halo gas, and the other part is associated to the denser clumps traced by the isotope CO lines.
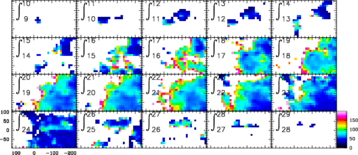
Following the formalism by Schneider et al. (2003, their Appendix A), which is valid in the optically thin limit and when both lines have similar optical depths, we can estimate the excitation temperature of [C I] from the ratio as K. Figure 6 shows the estimated of [C I] at the same region mapped in [C II] for the velocity channels from 9 to 29 where the emission of both [C I] lines is larger than the level detection. The [C I] maps were first convolved to the larger beam (24′′) of the C18O map in order to increase the S/N.
The excitation temperature ranges between 40 K and 100 K in the inner molecular region (i.e., southwest from the ionization front). This result is in agreement with a previous LTE estimate of the excitation temperature from mid- 12CO (Pérez-Beaupuits et al. 2010), earlier estimates from [C I] observations (e.g., Genzel et al. 1988) that indicated the [C I] emission arises from gas with kinetic temperature of about 50 K, and from a multi-line NH3 study (Güsten & Fiebig 1988) which showed different coexisting gas phases with kinetic temperatures between 30 K and few 100 K, and up to about 275 K in the region traced by the VLA continuum arc (the northern ionization front). Even higher excitation temperatures are found at sparse locations northeast of the ionization front, and along the eastern edge of M17 SW at the channel bins (20–24 ) close to the ionization front. Pointing offsets between the CHAMP+ and FLASH observations (done at different observing periods), as well as differential couplings of the two respective beams just at the edge of the ridge, can mimic such temperature gradients. These effects could account for up to 30% in the line ratios, and they cannot be discarded. Hence, we limit the color scale of Fig. 6 to 200 K, which is a more reliable upper limit of the excitation temperature in the region mapped. Ratios 2, found at few positions between the ionization front and the ionizing stars, lead to negative excitation temperatures in the optically thin and LTE approximation.
4.2 Optical depths and column density of [C I]
From the excitation temperature and the peak intensity of the [C I] and lines, the optically thin approximation also allows us to estimate the optical depths of both lines. Knowing the excitation temperature and the optical depth of the line, the column density [C I] can be computed as well. For detailed formulae see Frerking et al. (1989) and Schneider et al. (2003, their Appendix A). We also assume that the sources fully cover our beam in the emitting regions (i.e., we use a beam filling factor of unity). Therefore, the quantities reported here correspond to beam (24′′) averaged values.
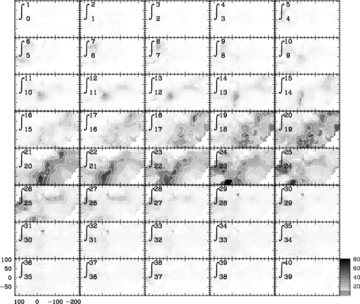
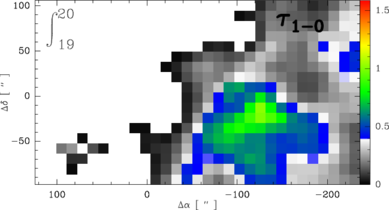
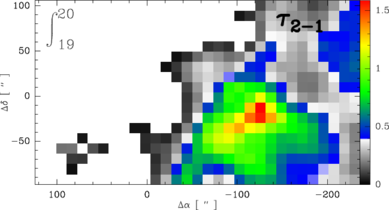
Figures 23 and 24 show the channel maps of the optical depths estimated for the [C I] and lines, respectively. Optical depths are observed in most of the regions mapped at all the velocity channels. Except in a small region around the offset position (-130′′, -10′′) of the line, at the central velocity channels (19–20 and 20–21 ), where the bulk of the [C I] emission is found.
A non-LTE excitation analysis using the Radex code (van der Tak et al. 2007), was used to test the optically thin assumption in two representative positions in the 19–20 channel map. First at offset position (-130′′, -10′′) where (cf. Fig. 26), and then at the offset position (-130′′, -70′′) (cf. Fig. 27) where , as seen in Fig. 7. The [C I] line ratios and intensities observed at these positions can be reproduced with densities larger than (the critical density of [C I] at between 100 K and 200 K) for kinetic temperatures below 500 K, and column densities per line width , similar to the column densities obtained with the LTE method. Considering a line width of 10 , the column densities we obtained are consistent with the peak column density and a moderate optical depth of about 2.50.7 derived by Genzel et al. (1988) from the total velocity-integrated intensity of [C I] , and assuming a non-linear relation between the intensity of [C I] and the intensity of C18O.
Our observed [C I] intensities can also be reproduced with densities above 310 (the critical density of [C I] at 100–200 K) and temperatures below 300 K. The [C I] line is close to thermalized () at both positions, for K and densities , while is not much smaller than unity in both positions, just as in the LTE results. Although the optical depths of both [C I] lines are just marginally thin, they are very similar. Hence, we can still apply the optically thin approximation in all the regions of interest, at least for , which is the opacity used to estimate the column density of [C I] following Schneider et al. (2003, their Eq. A.8). Since the optical depth is not much smaller than unity, we used the correction factor to compute the column density of [C I].
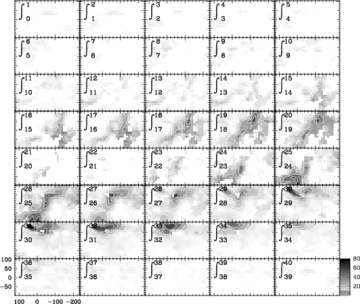
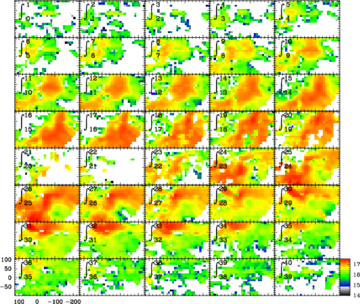
The velocity channel maps of the column density [C I] () are shown in Fig. 25. The values of [C I] range between 10 and 10 throughout the whole region mapped and among all the velocity channels. However, the bulk of the [C I] emission corresponds to column densities above in all the velocity channels. Column densities up to are reached only in the central velocity channels, between 17 and 22 , which correspond to the regions where the integrated intensity maps (Fig. 1) show a strong [C I] emission (% of the peak).
5 Emission of [C II] not associated with other gas tracers
In Pérez-Beaupuits et al. (2013) we showed overlays of our previous 12CO map and the optical depth of HI from Brogan & Troland (2001), over the [C II] emission, also in channel maps of 1 width. We showed that only at intermediate (10–24 ) velocities the [C II] emission presented strong spatial association with other molecular gas tracers. A strong spatial association is identified when the spatial distribution of a particular [C II] channel map is very similar, or adjacent, to that of another gas tracer (e.g., 12CO or [C I]). On the other hand, at lower (10 ) and higher (24 ) velocity channels, the [C II] emission is mostly not associated with the other tracers of diffuse and dense gas. We note that “not associated” in this sense does not mean that we deal with physically completely independent material. The overlay between the 12CO and [C II] velocity channel maps in Fig. 5 shows that in the outer velocity range the [C II] emission often shows halos and diffuse extensions around the denser clumps and filaments identifiable in the 12CO channel maps, suggesting that the [C II] emission traces gas that has been ablating off the clump or filament surfaces; this [C II] emitting gas, however, is not visible in 12CO, despite this association.
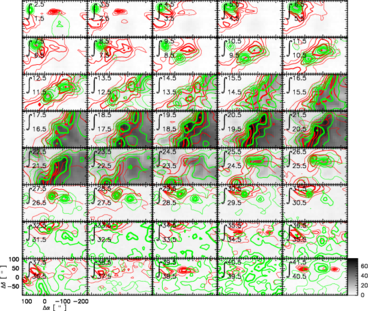
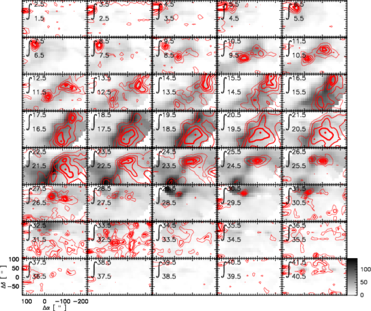
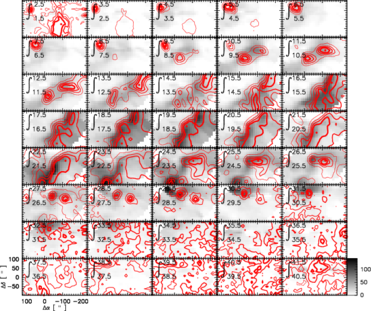
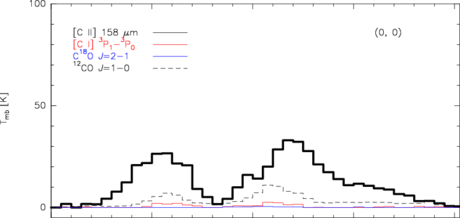
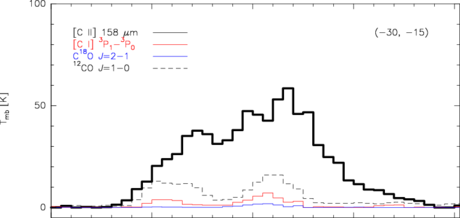
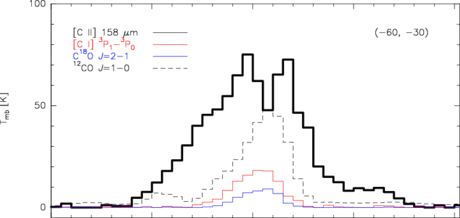
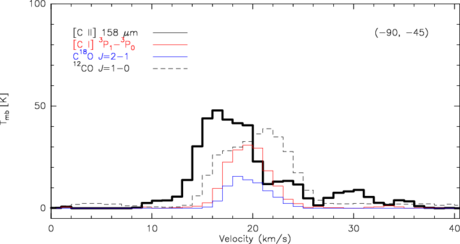
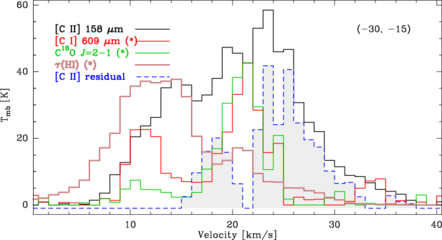
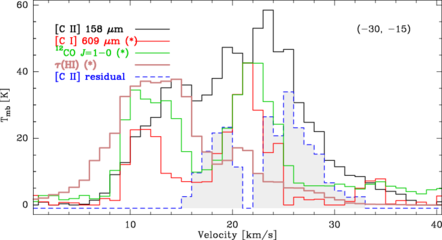
This can also be seen in the line shapes of the [C II], [C I] 609 m, C18O and 12CO spectra shown in Fig. 11 for different offset positions along a strip line at position angle (P.A.)=63o. The pointings of the spectra from the different tracer coincide within 2′′, i.e., sufficiently close considering the smeared 24′′ beam resolution. We note that most of the lower and higher velocity channels of the [C II] line are not associated with any of the other lines, while the C18O and [C I] lines are highly associated. The velocity channel maps of [C II] with overlays of the new maps of the [C I] 609 m and 12CO lines, are shown in Figs. 8 and 9, respectively.
The spatial distribution of each velocity channel in the [C I] 609 m emission follows a similar pattern to the maps presented in Pérez-Beaupuits et al. (2013), although with a narrower (14–24 ) velocity range where strong association with the [C II] emission is observed.
If the [C II] emission was associated in all velocity channels with the more diffuse molecular gas (between 30 and , independent of temperature) traced by the 12CO line, the spatial association between [C II] and 12CO would be expected to be stronger than that between [C II] and 12CO . However, like the 12CO and [C I] lines, the 12CO line shows a strong association with [C II] only in the central 10-24 components (cf. Fig. 9). This is another confirmation that the lower (10 ) and higher (24 ) velocity channels of the [C II] emission are not strongly associated with the bulk of the molecular gas.
5.1 Spatial correlation between the star-forming material and the [C II] emission
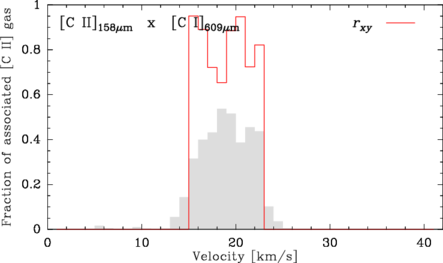
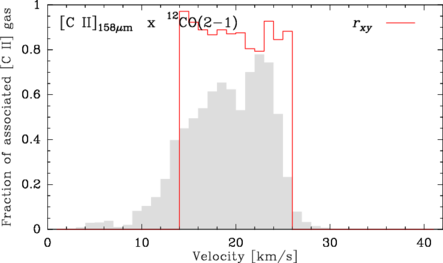
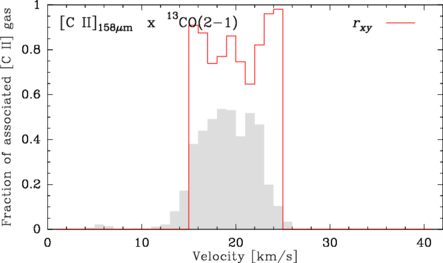
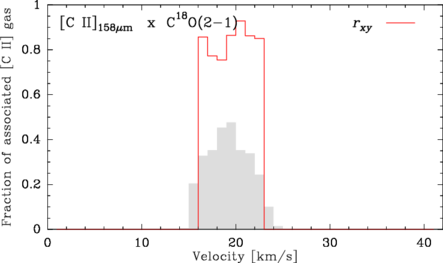
We quantify the spatial association observed at each velocity channel between the [C II] emission and other gas tracers (e.g., 12CO , [C I] 609 m) according to the procedure described in Appendix D. We use 10% of the global (i.e., among all the channels) peak emission of each tracer as a threshold to identify the pixels with significant emission to be used. This method allows us to estimate where in the region and by what fraction of the region the [C II] emission is associated, in the spatial distribution of each velocity channel map, with other gas tracers (cf. first paragraph in Sect. 5).
The correlation coefficient described in Appendix C, and histograms showing the velocity distribution of the spatial association between the [C II] emission and that of [C I] 609 m, 12CO, 13CO, and C18O are shown in Fig. 10. In this case the correlation coefficient was computed using only the pixels with emission larger than 1/3 of the global peak emission, in order to consider only the optically thick branch of the CO scatter plots shown in Fig. 4, and to exclude the [C I] scatter at low intensities. Figure 10 then shows that the [C II] emission is associated with, and highly correlated with () other gas tracers, mostly at the central velocity channels between 15 and 23 . The fraction of the mapped region where the [C II] emission is associated with the [C I] 609 m line is 30%–55% in the velocity range mentioned above, while it reaches 40%–80% with 12CO, 35%–50% with 13CO, and only 20%–45% with C18O .
 |
 |
 |
 |
The large range of velocity channels of [C II] emission not associated with other gas tracers is strong evidence of the inability of the total velocity-integrated [C II] line intensity (i.e., its total flux) to estimate its beam averaged abundance (i.e., column density ratio in comparison to other tracers), and the cooling it provides to the molecular and star-forming gas traced by species like [C I] and CO. The assumption of the [C II] emission arising from the same spatial region as other tracers of diffuse and dense gas in the whole velocity range covered by the [C II] spectra, was the basis for many previous studies, according to the technology available at that time. In particular, the spectrometers on board of NASA’s Kuiper Airborne Observatory (KAO) had a spectral resolution of 80–175 for the [C II] 158 m line (e.g., Meixner et al. 1992), while the [C II] spans only 40 in our velocity-resolved spectra. Now we know that only 20% of that resolved velocity range is associated with the star-forming material traced by [C I] and CO. Hence, using the total velocity-integrated [C II] intensity can be misleading, since it may include (as in the case of M17 SW) emission from gas that is not really associated with the [C I] or the CO emitting gas. Therefore, the actual abundance of C+, and the cooling of the molecular gas due to [C II] emission associated with molecular gas in several Galactic and extra-galactic environments, may be overestimated.
At the central velocity channels (e.g., 21–22 ) the [C II] line shows dips at positions where optically thin lines (e.g., C18O ) show their peaks, like the spectra in Fig. 11 at offset position (-60′′, -30′′). This spectral feature is present at several positions around the previous one, indicating the presence of a colder foreground layer, with significant optical depth to absorb the emission from a warmer background component present at an adjacent velocity. Taking the main beam temperature at the channel 22.5 (where the C18O lines drops sharply) as the continuum level ( K), and the temperature at the channel 21.5 as the maximum absorption depth of the [C II] line ( K), we can estimate the optical depth of the absorbing layer as . Assuming that the absorbing layer completely covers the background component and that all the foreground [C II] atoms are in the ground state, we can estimate the absorbing column density following Eq. (3) in Neufeld et al. (2010) as
| (1) |
where s-1 is the spontaneous radiative decay rate, and are the degeneracies of the upper and lower states, and m (used in cm in Eq. 1) is the transition wavelength of the [C II] ground state. From this we estimate a foreground absorbing column density of . This is about a factor of two smaller than the column densities that we estimate for the background emitting [C II] gas (see Sect. 5.2). Since the absorbing layer affects only one or two of the central 1 wide velocity channels, given the sharp profile of the C18O line, it does not affect any of our conclusions.
In the following section we estimate in more detail the [C II] column density and atomic hydrogen mass not associated with the star-forming material traced by the [C I] and C18O lines by using an LTE approximation.
5.2 Column density of [C II] and mass of dissociated material
Because the spectra of [C II] and the other gas tracers have slightly different velocity resolutions, we have re-sampled all the spectra to 1 resolution.
We use the [C I] 609 m line as a tracer of the diffuse ( at 100–200 K) molecular gas, and the optically thin C18O line as a tracer of the denser ( at 100–200 K) molecular gas in the star-forming material.
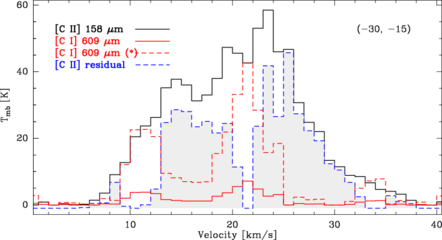
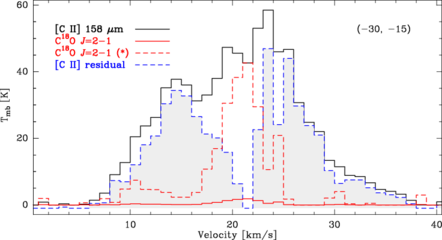
For each [C I] and C18O spectra of the map we find the channel with the maximum intensity, and divide the corresponding [C II] channel by that maximum value to obtain the factors by which to multiply separately the [C I] and C18O spectra. This produced scaled up [C I] and C18O spectra that match the original [C II] spectra at their respective maximum channel intensities. Then we subtract the scaled up [C I] line from the original [C II] spectra. The same is done independently with the C18O line to produce two residual [C II] spectra. Since we do not observe any absorption line profile in our spectra, we consider all the channels with negative values as noise, and we set them to zero in order to avoid unwanted boosting of the [C II] emission. If the maximum intensity of [C I] or C18O is higher than the intensity of the corresponding channel in the [C II] spectrum, then no scaling up is done.
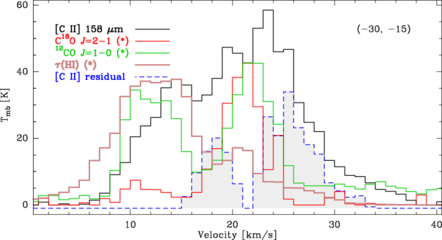
An example of this procedure, and the results for the spectra at the approximated offset position (-30′′,-15′′), is shown in Fig. 12. The shaded histogram corresponds to the residual spectra after the subtraction of the [C I] and C18O lines. For each channel we took the minimum intensity between the two residual [C II] spectra to produce a synthetic spectrum that represents the [C II] emission not associated with the star-forming material traced by [C I] and C18O. All these assumptions, in particular the scaling of the intensities, will lead to conservative numbers (lower limits).
 |
 |
We can estimate the column density of the non-associated [C II] gas from the synthetic residual [C II] spectra, following the high-temperature LTE limit, which is valid for temperatures well above 91 K and high densities,
| (2) |
obtained from a two-level system model as described in Schneider et al. (2003, their Eq. (A.5),) where is the beam filling factor assumed to be unity since the [C II] emission in M17 SW is very extended, and is the [C II] emission in units of erg cm-2 s-1 sr-1. We note that with the two-level system expression, the estimated column density of [C II] increases if lower densities and/or lower temperatures are used. If we assume a gas temperature of 250 K and a density of , as estimated for the region east of the ionization front in M17 SW (i.e., the H I and H II regions) from mid- 12CO line observations (Pérez-Beaupuits et al. 2010), the exact expression for the two-level system presented by Schneider et al. (2003, their Eq. (A.4),) gives a 25% larger column density than the LTE approximation of Eq. (2). Since the procedure described above subtracts the [C II] emission associated with most of the dense and diffuse molecular gas, the residual emission should be dominated by collisional excitation from atomic hydrogen and free electrons.
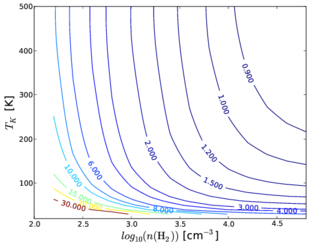
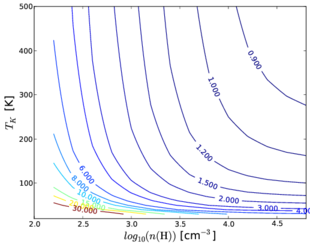
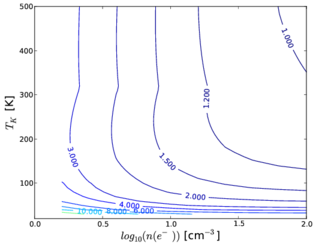
In order to analyze how sensitive the [C II] column density is to an assumed temperature and density of the gas, we estimate for a range of temperatures and densities using Eq. (A.4) from Schneider et al. (2003), considering a filling factor of unity. We consider the critical densities for free electrons (), atomic hydrogen (H I), and molecular hydrogen (H2), which were computed for each temperature, according to the corresponding collisional deexcitation rate coefficients reported by Barinovs et al. (2005). Since the actual column density of [C II] also depends on the [C II] intensity (which is arbitrary for this analysis), in Fig. 13 we show only the ratio with respect to the obtained using the temperature (250 K) and density () assumed above, to demonstrate the relative effect of using different ambient conditions. Although the critical density depends on the temperature, changes by a small percent between 200 K and 500 K. Therefore, we adopt 250 K as a high-temperature limit, since the temperature dependence of the exponential term in the two-level system approximation of is stronger.
When using a higher temperature and density, the estimated column density decreases by less than 20% when considering H I or H2 as the collision partner. The column density of [C II] would increase by larger factors if lower densities and temperatures were used. When using electrons as the collision partners, saturates at densities above , and temperatures above 400 K. These results emphasize our point that the values of obtained with the LTE approximation (or with the temperature and density assumed above) should be regarded as lower limits, whether the LTE conditions are met or not in all the regions mapped.
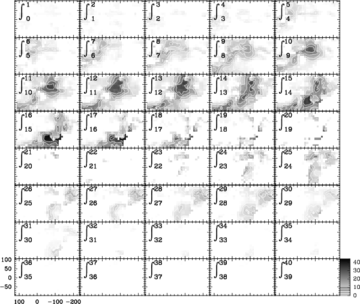
The channel maps of the residual [C II] column density (not associated with the dense and halo molecular gas traced by C18O and [C I]), estimated with Eq. (2), is shown in Fig. 14. The channel maps between 19 and 22 are the most affected by the subtraction of the [C I] and C18O emission, thus confirming the strong spatial association found in the central velocity range, as shown in Sect. 5.1. The small self-absorption that we see will affect the neighboring channels, but not the general picture. This is in line with the channel maps from 18–20 that still follow the structure of M17SW. The column density of the [C II] gas not associated with the star-forming material (traced by [C I] and C18O) ranges between 10 and 410 in the whole region mapped, and among all the channels in the 0–40 velocity range.
From the residual (and total) [C II] column density channel maps we can also compute the corresponding mass of the gas contained in the 24′′ beam area of the channel maps by assuming a gas phase carbon abundance of (Wakelam & Herbst 2008, their Table 1) and complete ionization of the carbon, according to
| (3) |
where is the area (in cm2) covered by the 24′′ beam, is the atomic hydrogen mass (in g), and the factor 1.4 accounts for helium and a minor fraction of other heavier elements.
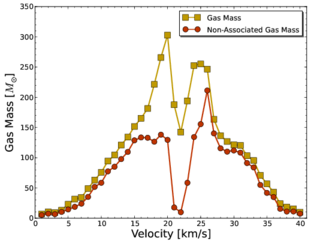
The velocity distribution of the mass (obtained by adding up all the pixels from each velocity channel map created from Eq. 3) is shown in Fig. 15. The gas mass per velocity channel (squares) was estimated from the original [C II] spectra. The largest fraction of non-associated gas mass (circles) is found at the higher (25–33 ) velocity channels.
When integrating the mass in the 0–40 velocity range, we find a gas mass of 4.4103 in the entire region mapped. This mass is a factor 3 lower than the 1.45104 found by (Stutzki & Güsten 1990) from C18O observations, which trace the non-dissociated cloud core mass. We note that the mass obtained from the LTE estimated column density of [C I] (cf. Fig. 25) using the same Eq. 3 is about three orders of magnitude lower than the mass traced by [C II]. This is due to the lower intensity and less spatial extension of the [C I] emission throughout the mapped region and among all the velocity bins, compared to that of [C II]. This is in line with the fact that only a small fraction of carbon is expected to be in atomic gas traced by the [C I] line.
Considering the mass estimated from the residual [C II] spectra, the gas mass from the non-associated [C II] emission is 2.8103 . Thus, the estimated gas mass not associated with the star-forming material traced by [C I] and C18O corresponds to 64% of the total gas mass traced by the original [C II] emission. This still amounts to at least 19% of the C18O mass reported by Stutzki & Güsten (1990).
A source of uncertainty to consider in our analysis is that we are assuming that the volumes of gas corresponding to each velocity channel are associated. In other words, a spatial association of the [C II] emission with [C I] and C18O emitting regions in the plane of the sky, does not ensure that they are really associated along the line of sight. However, the probability that the spatial association that we see in the central components of the 1 channel maps is just a projection effect is minimal since we are using a relatively narrow velocity width. Hence, the fraction of non-associated mass quoted above should be considered a lower limit.
 |
Since there is no evidence of fast shocks in M17 SW, other mechanisms that can produce [C II] emission with larger velocity dispersion than the denser molecular gas must be considered. For instance, the interaction with winds and outflows from the ionizing stars can lead to substantial excitation of the [C II] emitting gas. Hence, ablation (e.g., Castor et al. 1975; Weaver et al. 1977; Tenorio-Tagle 1979; Henley et al. 2012, and references therein) and, probably slow shock- interaction due to radiative pressure (e.g., Goodwin 1997; Krumholz et al. 2010; Dale & Bonnell 2011, and references therein), have to be considered to model and interpret the [C II] emission not associated with the star-forming material in M17 SW. However, [C II] may also be present in extended low density gas around H II regions produced by far ultraviolet (FUV) photons (E11.26 eV for the first ionizing potential of atomic carbon) from the ionizing stars. With such high energy photons, low H2 densities also mean higher abundance (i.e., densities) of H I and free electrons , which would then become equally important collision partners of [C II], with critical densities of about 310 and 10 , respectively, at 250 K (the higher the temperature, the higher the critical densities). Thus, compensating the lower densities of H2 and, most likely, keeping the LTE assumption for [C II] valid. Therefore, warm C+ could be present at lower densities (and higher gas temperatures) than assumed. If so, then extreme ultraviolet (EUV) photons should also produce [N II] emission if their energy is larger than 14.5 eV (the first ionizing potential of nitrogen) and lower than 24.38 eV (the second ionizing potential of carbon). In such a zone of EUV photons, the [C II] and [N II] emission should co-exist, and show a high degree of spatial association. This can be checked observationally, using the GREAT instrument on board SOFIA. Zones with photon energies larger than 24.59 eV (the first ionizing potential of helium) accounts for at least 10% of the gas in M17 SW (depending on the spatial resolution of the observations) as estimated from observations of the He+/H ratio (e.g., Peimbert et al. 1988; Tsivilev & Krasnov 1999). Between the two extremes of molecular and ionized hydrogen, the [C II] emission can also co-exist with neutral atomic hydrogen H I, as shown by (Brogan & Troland 2001) in M17 SW. We discuss these gas phases in more detail in the following section.
5.3 [C II] in the three gas phases
 |
 |
 |
 |
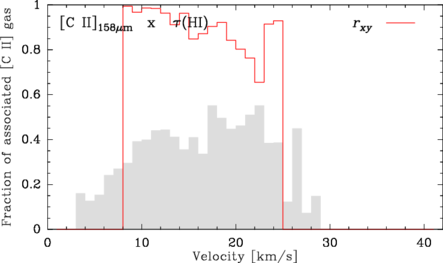
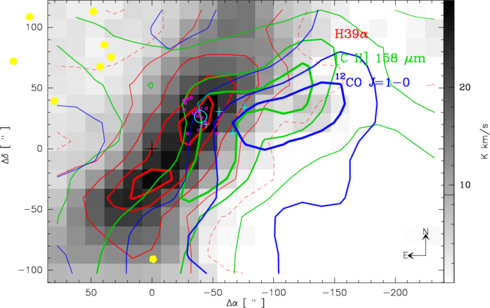
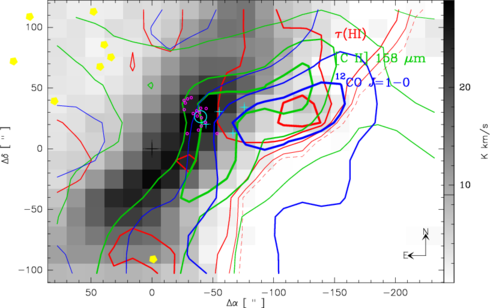
As discussed above, there are basically three different regimes that contribute to the [C II] emission; the highly ionized gas where electrons dominate (H II), the atomic hydrogen layer (H I), and the molecular hydrogen gas (H2) suffused with sufficient UV to keep CO dissociated and to ionize neutral carbon efficiently888There is also the CO-dark molecular gas (Wolfire et al. 2010) that we trace in part through our [C I] line. However our [C I] sensitivity is not good enough to also measure the more diffuse molecular, CO-dark gas.. Following the method described above, we include the high resolution VLA map of the velocity-resolved optical depth, (H I), from Brogan & Troland (2001), convolved with a 24′′ beam and re-sampled to 1 channel width. The channel-by-channel spatial correlation between [C II] emission and (H I) shown in Fig. 17 indicates that most of the [C II] emission associated with the H I gas is found at the lower ( ) velocity channels.
In the previous section we estimated the [C II] column density and hydrogen mass of the gas not associated with the relatively compact and dense star-forming material traced by C18O , and [C I] 609 m. The [C II] emission associated with the entire molecular gas phase, however, also comprises the diffuse and more extended H2 gas. Therefore, we now use the 12CO line, as the canonical tracer of H2. As 12CO is optically thick throughout large parts of the map, this will provide a lower limit for the [C II] emission from the diffuse molecular material.
 |
 |
 |
In order to analyze the impact of these line tracers in the residual [C II] emission (and hence, the [C II] column and associated gas mass), we tested three different combinations of gas tracers: (1) (H I) + [C I] 609 m + C18O(2–1); (2) (H I) + [C I] 609 m + 12CO(1–0); and (3) (H I) + 12CO(1–0) + C18O(2–1). Model (3) is included for comparison, since C18O can complement 12CO in regions where 12CO is optically thick. The residual [C II] spectrum at offset position (-30′′,-15′′), obtained after subtracting the scaled-up spectra of the three combinations mentioned above, are shown in Fig. 17 (from top to bottom). When subtracting (channel by channel) the maximum of the three synthetic lines from the original [C II] spectra, we obtain the residual [C II] emission that is mostly associated with the H II regime. It can be seen in the three cases that most of the residual [C II] emission is contained in the higher velocity channels. Using only the molecular gas tracers (i.e., excluding (H I)), we can obtain a second residual [C II] spectra that would contain the [C II] emission associated mostly with the H II and H I gas. From these two residual spectra we can then estimate the residual [C II] emissions, and their respective column densities using Eq. (2), associated with the three gas phases, according to the procedure described in Appendix E.
In Table 1 we summarize the fraction of the average over the region mapped [C II] emission associated with the three gas phases as obtained from the three combinations of line tracers. Using [C I] 609 m and 12CO , combined with (H I), yields practically the same result given the uncertainties as when using C18O instead of [C I] 609 m. This results from the high correlation observed between [C I] and C18O, although it is not a 1:1 match (probably sensitivity limit driven) as shown in Fig. 4. Thus, the slightly higher (1%) fraction of [C II] emission associated with H2 gas found with model (2), compared with that of model (3), may indicate that [C I] traces at least part of the CO-dark molecular gas (Wolfire et al. 2010). Therefore, we chose model (2) as the most complete one, tracing all the gas regimes where [C II] emission can be found.
| Model No. | H II fraction | H I fraction | H2 fraction |
|---|---|---|---|
| Model 1a𝑎aa𝑎aCombination: | 42.7% | 20.9% | 36.4% |
| Model 2b𝑏bb𝑏bCombination: | 36.2% | 16.8% | 47.0% |
| Model 3c𝑐cc𝑐cCombination: | 36.8% | 17.4% | 45.8% |
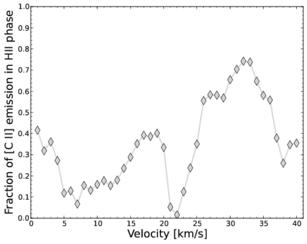
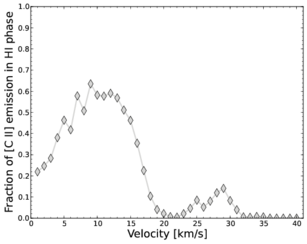
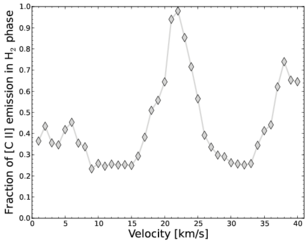
The velocity distribution of the fraction of averaged [C II] emission associated with the three gas phases obtained with model (2) is shown in Fig. 18. The [C II] emission associated with H I gas is mostly contained in the lower velocity (20 ) channels, while the [C II] emission associated with the ionized H II gas is contained mainly at the higher velocity bins (25 ), although part of it is also found in the 20 velocity range. The central velocity channels (15–30 ) contain most of the [C II] emission associated with the molecular H2 gas. The corresponding velocity-channel maps of the [C II] emission associated with H II, H I, and H2, are shown in Fig. 32. These channel maps show that the [C II] emission, and therefore column density, associated with the ionized gas, peaks at the northeast corner of the mapped region, which coincides with the position of the ionizing sources (cf. Fig 5). The fraction of [C II] column density (or [C II] emission) associated with the molecular gas regime is about 11% larger than the fraction (36%) found in the dense star-forming material. This is expected since the 12CO emission has a broader line profile and is also spatially more extended than C18O and [C I] (cf. Fig. 2 and Fig. 11).
We note that this method has uncertainties, and it gives only a first order approximation of the [C II] emission associated with the three different regimes. The results presented in Table 1 should not be taken as a sharp distinction between the three gas regimes, since in reality the three gas phases can be mixed throughout the region mapped (we elaborate on this in the next sections). In particular, the [C II] emission associated with the atomic H I gas has a large uncertainty as the optical depth (H I) is saturated over a significant part of the region along the molecular ridge. The saturated values were replaced by a lower limit, according to the continuum and rms level of the VLA spectra, as described in detail by Brogan & Troland (2001, their Sect. 3.3.2). Furthermore, (H I) obtained from H I in absorption traces atomic hydrogen in the foreground relative to the free-free emission from the H II region. This might introduce a bias since (H I) traces only the cold H I gas, while part of the warmer atomic hydrogen can be mixed with the H2 and H II gas phases. However, we consider that the warm mixed H I gas can be at least partially accounted for by the [C I] and 12CO lines. Nevertheless, this is another uncertainty in our method.
The gas masses associated with the three gas phases could be estimated with Eq. (3), by using abundances (and the corresponding mass of atomic and molecular hydrogen) of ionized carbon relative to the dominant hydrogen phase, i.e., , . However, these abundances are not really known, and although they could be estimated from a clumpy PDR model, which would be the best model currently available for M17 SW because of its highly clumpy structure, the uncertainties in the values obtained for each gas phase would be very high because the relative abundances strongly depend on the number of clumps, clump sizes, and ambient conditions of each clump, which we have not yet been able to constrain for M17 SW. In addition, knowing the actual density and temperature of the dominant collision partners in each gas regime would allow us to estimate (with non-LTE radiative transfer models) the actual [C II] emission associated with the three gas phases. We expect to estimate all these parameters in a follow up work.
|
|
5.4 Comparison with radio recombination lines
Traditionally radio recombination lines (RRL) are considered probes of gas conditions within ionized gas. However, the principal quantum levels are generally not in thermal equilibrium, and there are different competing mechanisms governing the line intensities (e.g., maser amplification of background radiation and weakening due to underpopulation of the upper quantum levels relative to LTE conditions) as well as the broadening of the line widths (e.g., thermal, turbulence and Stark effects - Griem 1967). Furthermore, the line shapes are the result of emission from regions with different ambient conditions along the line of sight, since the emitting gas is usually optically thin in the centimeter and millimeter regimes. All these effects make of RRLs, in the centimeter wavelength range, more ambiguous probes of the ambient conditions in ionized gas than originally thought. At millimeter wavelengths, however, the Stark broadening is negligible (0.1 for GHz, cf. Gordon & Sorochenko 2002), leaving only thermal and turbulent broadening at play, and the RRLs tend to be optically thin and do not suffer significant departures from LTE conditions (for a review see, e.g., Gordon 1988; Gordon & Sorochenko 2002).
In our broadband (32 GHz IF bandwidth) OTF maps obtained with the IRAM 30m telescope (cf. Sect. 2), we detect a number of hydrogen RRLs in the 3mm band: H39, H40 and H41 lines at 106.74 GHz, 99.02 GHz, and 92.03 GHz, respectively (the beam size of the H41 line is 283). All of them show very similar spatial distribution and line shapes. We improved the S/N by convolving the maps with a 30′′ beam. Because of our short integration times no other recombination lines were detected, preventing further analysis of the excitation conditions of the ionized gas at our high spatial resolution. Our goal now is simply to verify if the spatial distribution of the [C II] emission can be associated with the ionized gas traced by the hydrogen recombination lines.
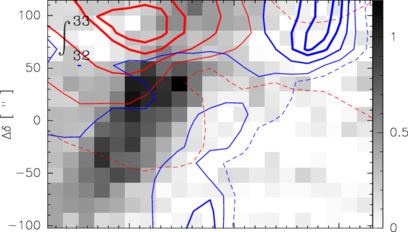
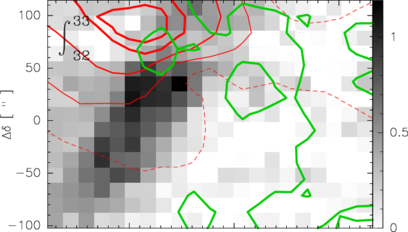
Figure 19 shows the H39, [C II], and 12CO integrated intensities, as well as the (H I) optical depth overlay (right panel) on the H41 map. The hydrogen recombination lines follow a relatively homogeneous distribution about 45∘ along the ionization front, and they peak at the M17-UC1 ultracompact region, which is also surrounded by a number of embedded X-ray sources (Broos et al. 2007). We note that there are many more X-ray sources reported by Broos et al., several of them with a stellar counterpart, but for clarity of the figures we show here only those associated with the M17-UC1 region. The H I optical depth follows the distribution of the RRLs, but their peak emissions are not correlated. In fact, the velocity integrated (H I) peaks around the same position as the 12CO line intensity. The [C II] emission, instead, covers the entire region mapped, and its intensity peaks between the ionized gas traced by H41 and the molecular gas traced by the 12CO line.
 |
 |
 |
 |
 |
 |
 |
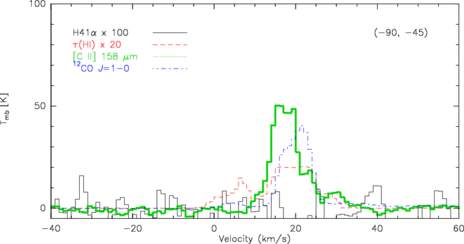 |
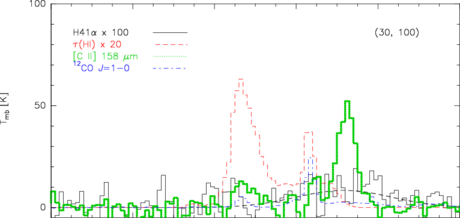
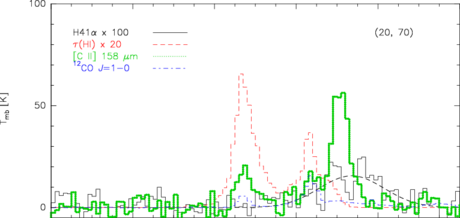
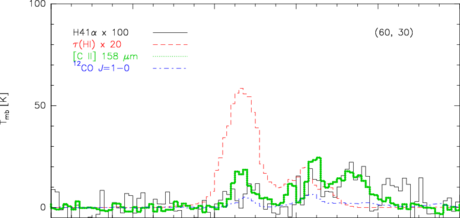
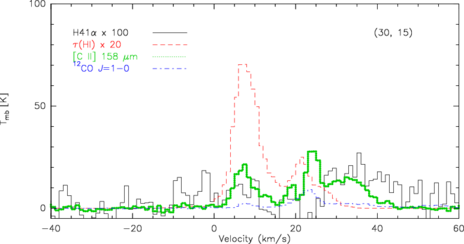
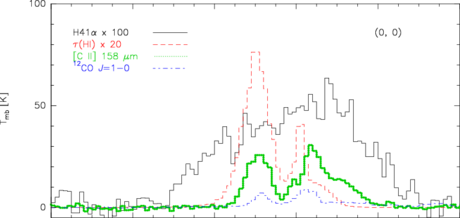
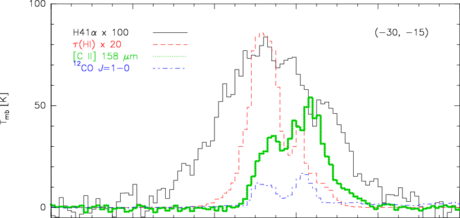
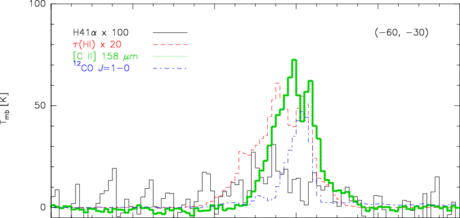
Figures 20 and 21 show the spectra of the H41, [C II], and 12CO lines at two offset positions close to the ionizing sources, (30′′,100′′) and (20′′,70′′), and along a strip line at P.A.=63∘. Although fainter at the northeast region (Fig. 20), the H41 line shows emission only at the higher velocity range (20 ) coinciding with the velocity channels of the [C II] lines found to be associated mostly with the H II gas in Sect. 5.3. At the southwest region (Fig. 21) the H41 line is stronger, but its shape is asymmetric and much broader than any of the other lines we observed in M17 SW. It is hard to associate its line shape to any of the line structures observed in the [C II] line nor in (H I). Since the H41 line is expected to be optically thin (i.e., no optical depth nor self-absorption effects), its line shape is most likely formed by several layers of ionized gas (with different ) along the line of sight, with each velocity component being affected by a combination of thermal and turbulence broadening.
 |
 |
 |
 |
 |
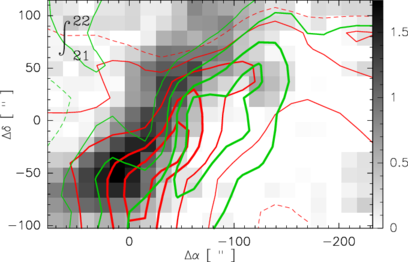 |
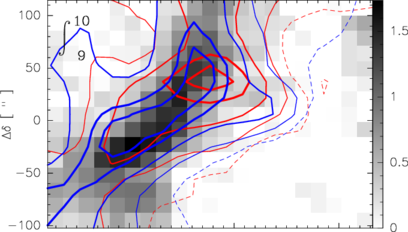
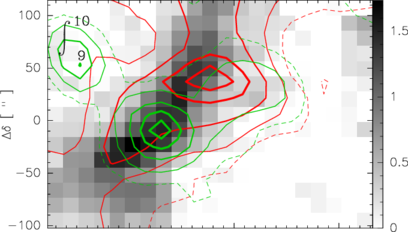
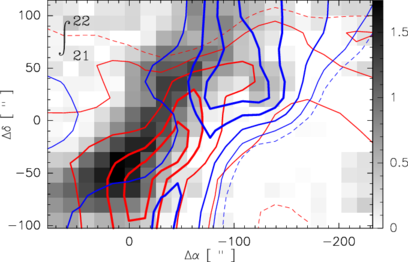
From Fig. 18, we know that the velocity ranges of the peak [C II] (residual) emission found to be associated with the H II, H I, and H2 gas, are 32–33 , 9–10 , and 21-22 , respectively. Figure 22 shows the corresponding channel maps of H41, the original [C II] emission, (H I), and the 12CO line. We note that the spatial distribution of the H41 line does not change significantly over these three different velocity ranges. At 32–33 , the [C II] emission peaks at the northeast region, around the ionizing sources, while the H41 emission still peaks at the M17-UC1 region (cf. Fig. 19). At 21-22 , the H41 peak is at the southeast region of the ionization front, while the distribution of the [C II] emission follows closely that of the 12CO . In the velocity range 9–10 , identified mostly with the H I gas regime, the emission from all the lines seems to emerge mostly from the region of the ionization front traced by the H41 line, indicating that the three gas regimes must be mixed at these velocities. The fact that the ionization and molecular dissociation front are mixed, can be explained if advection is considered (e.g., Bertoldi & Draine 1996). This dynamical process would make the ionized region larger compared to the atomic region, and extended towards the molecular region. This, in turn, will lead to a larger contribution of the ionized gas to PDR diagnostics like [C II], as shown in models by Abel et al. (2005).
As previously noted by Brogan et al. (1999), and from Figs. 20 and 21, the velocity structures of H I and [C II] are different. A narrow component of shocked H I gas (streaming towards us) in M17 was suggested by Brogan et al. (1999), in the range 11–17 , where we also find [C II] and 12CO components, but only at the edge of the ionization front (cf. Fig. 21, offset position (,)). In the 9–10 velocity range, which is associated mostly with atomic gas, the H I optical depth peaks along the H41 line since (H I) is estimated from 1̋ in absorption. Actually, this channel map is part of the prominent (H I) velocity component in the 0–11 range (cf. Fig. 20), that has corresponding associated [C II] and 12CO emission. This component in (H I) was not mentioned in the original papers by Brogan et al. (1999); Brogan & Troland (2001). This can also be shocked ionized ([C II]), atomic (H I), and molecular (CO) gas streaming towards us.
The strong [C II] velocity component found around (Fig. 20, top two panels) has no evident counterpart in the other atomic or molecular tracers. These differences, in particular with H I, may arise because the [C II] 158 m emission tends to trace warmer gas than the H I absorption, which traces cold gas. The faint H41 emission around , barely detected with S/N3 in our OTF maps at offset position (20′′,70′′), shows a line width (FWHM) of from a Gaussian fit. This line width is consistent with the thermal broadening (, with in K and in amu, cf. Gordon & Sorochenko 2002, their Eq. 2.22) expected for the LTE electron temperature K estimated towards M17 by Gordon (1989). At offset (30′′,100′′) we find a S/N3 for the H41 line. At these positions, (20′′,70′′) and (30′′,100′′), the [C II] component around have a Gaussian fit FWHM of , also consistent with the thermal broadening expected for the quoted above. This indicates that the [C II] emission around is associated with warm gas, and probably shocked by the proximity of the ionizing sources, streaming away from us and from the bulk of the molecular unshocked gas found around the 20 component. Higher S/N maps of the H41 and other RRLs are needed to confirm the detection of ionized gas at these positions. Maps of [N II] and the hydrogen recombination lines (in the 3 mm wavelength range), tracing the transitions between medium and large principal quantum numbers, and even the fainter carbon recombination lines, may help explain the nature and ambient conditions of the 32 component found in the [C II] emission.
5.5 Comparison with other sources and implications for extragalactic studies
A study of the H II region S125 showed that up to 40% of the [C II] 158 m line intensity, observed with ISO-SWL, arises from the H II region (Aannestad & Emery 2003). Comparing and modeling the [C II] and [N II] emission obtained from Herschel/PACS, Bernard-Salas et al. (2012) found that at most 18% of the [C II] emission in the Orion Bar originated in the H II region. This is a factor of 2 lower than found for S125, and a factor of 3.6 times lower than what we estimate for M17 SW. However, this is not a one-to-one comparison, since their study is focused in a relatively small scale, covering mostly the dense PDR in the Orion Bar. Hence, most of the actual H II region (where more [C II] emission than quoted by them can be present) is not seen in their data set. Therefore, large scale maps of [C II] and other ionized, neutral, and molecular tracers like the ones we present are relevant not only in order to understand the full picture of the H II-PDR boundary, which is more complex than predicted by the classical 1-D models, but also to understand and properly interpret the observations of these diagnostic lines in extragalactic sources.
As mentioned at the end of Sect. 5.2, and as shown in Sect. 5.4, the [C II] line can originate both in the PDR (molecular and neutral atomic gas) and in the H II region. When observed toward other galaxies, the [C II] emission collected in one beam (typically covering large scales), will naturally come mainly from several unresolved giant molecular clouds and H II regions, with different orientations with respect to the impinging radiation field along the line of sight. Thus, it is important to characterize in detail the [C II] contribution from these different environments. The [C II] emission is important in extragalactic studies for redshift determinations, and also to estimate the star formation rate (SFR) from the [C II] luminosity (e.g., Stacey et al. 1991; Meijerink et al. 2007; Luhman et al. 2003).
Recent results from 130 galaxies observed with Herschel/PACS by Sargsyan et al. (2014) confirm that [C II] traces the same starburst component of sources as measured with mid-infrared PAH, neon emission line diagnostics, and bolometric luminosities of reradiating dust from starbursts. By using a modified Cloudy code Abel et al. (2005) estimated that about 30% of the [C II] emission in the starburst galaxy NGC 253, observed with the KAO (Carral et al. 1994), arise from the ionized medium. Using PACS data to map the FIR emission of the [C II] line in the spiral galaxy M33, and models of photo-ionization and photon-dominated regions, Mookerjea et al. (2011) found that between 20% and 30% of this emission comes from the H II region.
Compared with our lower limit estimates, these results for extragalactic sources are at least a factor of two lower than the values we find for M17 SW when considering only the [C II] emission not associated with the dense star-forming material (cf. Sect. 5.2). They are more than 6% lower than what we estimate for the [C II] emission associated mostly with the H II region (cf. Sect. 5.3). We believe that there are three main reasons for these differences:
-
(1)
Their models of static geometries do not consider that their beams collect emission from many sources with diverse geometries (from edge-on to face-on, and many other orientations in between), systemic velocities, highly structured medium (that would allow FUV radiation to permeate the region ionizing and heating the gas on larger spatial scales), and dynamical processes like advection (as mentioned in Sect. 5.4) that would increase the contribution from the ionized medium.
-
(2)
The models assume that the gas is in pressure equilibrium, so the equation of state is dominated by gas pressure since turbulent and magnetic pressures are not included. If turbulent or magnetic pressure dominate instead, as is the case of M17 SW (Pellegrini et al. 2007), then the density law and hence the collisional excitation of the PDR diagnostic lines throughout the H II and photon-dominated regions will be different.
-
(3)
Their studies are based on the total velocity-integrated intensities of the [C II] and other line emissions, provided by the spectral resolution of the instruments used. Whereas the velocity-resolved [C II] spectra obtained with SOFIA/GREAT towards M17 SW, shows that 80% of the velocity range covered by the [C II] line is associated with a mixture of ionized medium, neutral gas, and diffuse molecular gas, and only 20% of the velocity range is associated mostly with the dense (star-forming) molecular material (cf. Sects. 5.1 to 5.4). While this result is particular for M17 SW, we have found similar results in other regions (e.g., NGC 3603, Pérez-Beaupuits et al. , in prep.), showing that this characteristic should be taken into account in PDR modeling of Galactic and extragalactic sources.
All the reasons mentioned above lead us to think that the fraction of [C II] emission coming from the H II regions have been underestimated in previous studies. Their conclusions regarding the fraction of [C II] emission emerging from ongoing star formation, and their estimates of SFRs in comparison with other SFR diagnostics, may change. In order to judge how much more valid our estimate is, models of photo-ionization and photon-dominated regions that include dynamical processes and magnetic pressure are needed. In addition, a significant number of large scale maps of [C II]and other diagnostics of ionized gas toward Galactic sources are required to increase the statistical significance of our results. Large scale maps of many sources can be achieved with the upGREAT receiver arrays, the second generation receivers for the GREAT project, that will make mapping the large scale regions more efficient. The upGREAT low frequency array (1.9–2.5 THz with 14 pixels) is currently scheduled for commissioning onboard SOFIA in May 2015. The upGREAT high frequency array (4.7 THz with 7 pixels) will follow about one year later. We expect to show the results of this long term study in follow up work.
6 Conclusions
We used the dual channel DSB receiver FLASH on the APEX telescope to map (with resolution) a region of about 4.1 pc 4.7 pc in the 609 m () fine-structure transition of [C I], towards the star-forming region M17 SW. We also used the broadband EMIR receivers on the IRAM 30m telescope to map a similar area of 360300′′ in the 3mm, 2mm, and 1mm bands.
We combine these data with the previously observed and published [C I] 370 m and [C II] 158 m data to discuss the physical properties of the dense interstellar medium in the M17 SW ridge.
Because of the complex structure of the M17 SW and the availability of velocity resolved spectra, we have performed all our analysis on 1 -wide velocity channel maps.
6.1 Excitation and column densities of [C I]
Combining our earlier observation of the [C I] 370 m () fine-structure line together with the new [C I] 609 m data, we found that the ([C I] 369m)/([C I] 609m) ratio is larger than unity in most of the regions mapped, at the central (10–24 ) velocity channels where the bulk (20%) of the [C I] emission is found. We estimate the excitation temperature and column density of [C I] using an optically thin approximation and a non-LTE method. We found that ranges between 40 K and 100 K in the inner region (i.e., southwest from the ionization front). While the [C I] column density ranges between 410 and 10 throughout the whole region mapped and among all the velocity channels. In the region where the [C I] emission is % of its peak integrated intensity, column densities up to are only reached in the central (17-22 ) velocity channels.
6.2 Comparison of [C II], [C I], and CO
We used our recent SOFIA/GREAT velocity-resolved [C II] map to analyze the spatial and velocity association of the [C II] emission with the diffuse and molecular gas in M17 SW. For that we used the [C I] lines from APEX/FLASH and the 12CO and isotope lines from IRAM30m/EMIR.
The [C II] emission was found to be associated with the other gas tracers in 20%–80% of the mapped region, but only at the central (15 and 23 ) velocity channels, which means that only 20% of the velocity range (40 ) that the [C II] line spans in our velocity-resolved spectra is associated with the star-forming material in M17 SW.
For the non-associated [C II] gas, in the 1 wide channel maps we estimated column densities ranging from 10 to 510 across the region mapped. The largest fraction of non-associated atomic mass contained in the mapped region, is found at the higher (25–33 ) velocity channels. The total non-associated gas mass (integrated over the 0–40 range) is 2.8103 . This corresponds to a very large fraction (64%) of the total mass (4.4103 ) traced by the [C II] emission. In other words, most of the gas traced by the [C II] emission in M17 SW is not associated with the star-forming material. The good match of the [C I] emission with the C18O map indicates that both tracers are seen from the same, star-forming material.
6.3 Comparison of [C II], H I, and hydrogen recombination lines
When using the optical depth of H I in combination with the [C I] 609 m and 12CO maps, we found that the [C II] emission associated with H I is contained in the lower (20 ) velocity channels, while the [C II] emission associated with the H II gas phase is found mostly at the higher velocity (25 ) channels. Most of the [C II] emission associated with the diffuse and dense molecular H2 gas, is found in the central velocity channels (15–30 ). From our preferred model (2), we found that 36.2%, 16.8%, and 47.0% of the [C II] emission is contained in the H II, H I, and H2 regimes, respectively.
Overlays between [C II], (H I), 12CO , and the H41 line at velocity ranges associated with the three gas regimes indicate that the H II region is mixed with the atomic and part of the molecular dissociation regions, in agreement with the highly clumped structure and dynamical processes at play in M17 SW.
Considering M17 SW as a proxy for active galaxies, these results are also relevant to extra-galactic studies in which [C II] is often used as a tracer of star formation rates. We have estimated a fraction of the [C II] emission not associated with the dense star-forming material, based on large maps of velocity-resolved spectra. Our estimates are up to two times larger than estimates done in extragalactic sources, based on velocity-integrated [C II] intensities. Other Galactic molecular clouds, for which velocity-resolved [C II] maps are also available, will be analyzed in a follow-up work. With the enhanced observing capabilities of SOFIA’s second generation heterodyne arrays, more sources can be observed in the future, increasing the statistics.
Acknowledgements.
We are grateful to the MPIfR team, as well as the APEX and IRAM 30m staff for their help and support during and after the observations. We are grateful to C. Brogan for providing the 21 cm map and the data cube of the velocity-resolved optical depth of HI estimated for M17 SW. We thank the referee for the careful reading of the manuscript and constructive comments that helped to improve our work. We are also grateful with the editor, Dr. Malcolm Walmsley, for his timely comments and suggestions that helped to improve even more our work. Molecular Databases that have been helpful include the NASA/JPL spectroscopy line catalog and the University of Leiden’s LAMDA databases.References
- Aannestad & Emery (2003) Aannestad, P. A. & Emery, R. J. 2003, A&A, 406, 155
- Abel et al. (2005) Abel, N. P., Ferland, G. J., Shaw, G., & van Hoof, P. A. M. 2005, ApJS, 161, 65
- Banerjee et al. (2004) Banerjee, R., Pudritz, R. E., & Holmes, L. 2004, MNRAS, 355, 248
- Barinovs et al. (2005) Barinovs, Ğ., van Hemert, M. C., Krems, R., & Dalgarno, A. 2005, ApJ, 620, 537
- Beetz et al. (1976) Beetz, M., Elsaesser, H., Weinberger, R., & Poulakos, C. 1976, A&A, 50, 41
- Bernard-Salas et al. (2012) Bernard-Salas, J., Habart, E., Arab, H., et al. 2012, A&A, 538, A37
- Bertoldi & Draine (1996) Bertoldi, F. & Draine, B. T. 1996, ApJ, 458, 222
- Brogan et al. (1999) Brogan, C., Troland, T., Roberts, D., & Crutcher, R. 1999, ApJ, 515, 304
- Brogan & Troland (2001) Brogan, C. L. & Troland, T. H. 2001, ApJ, 560, 821
- Broos et al. (2007) Broos, P. S., Feigelson, E. D., Townsley, L. K., et al. 2007, ApJS, 169, 353
- Carr (1987) Carr, J. S. 1987, ApJ, 323, 170
- Carral et al. (1994) Carral, P., Hollenbach, D. J., Lord, S. D., et al. 1994, ApJ, 423, 223
- Carter et al. (2012) Carter, M., Lazareff, B., Maier, D., et al. 2012, A&A, 538, A89
- Castor et al. (1975) Castor, J., McCray, R., & Weaver, R. 1975, ApJ, 200, L107
- Chini et al. (1980) Chini, R., Elsässer, H., & Neckel, T. 1980, A&A, 91, 186
- Clark et al. (2011) Clark, P. C., Glover, S. C. O., Klessen, R. S., & Bromm, V. 2011, ApJ, 727, 110
- Dale & Bonnell (2011) Dale, J. E. & Bonnell, I. 2011, MNRAS, 414, 321
- Federrath & Klessen (2012) Federrath, C. & Klessen, R. S. 2012, ApJ, 761, 156
- Frerking et al. (1989) Frerking, M. A., Keene, J., Blake, G. A., & Phillips, T. G. 1989, ApJ, 344, 311
- Genzel et al. (1988) Genzel, R., Harris, A. I., Stutzki, J., & Jaffe, D. T. 1988, ApJ, 332, 1049
- Gerin & Phillips (1998) Gerin, M. & Phillips, T. G. 1998, ApJ, 509, L17
- Goodwin (1997) Goodwin, S. P. 1997, MNRAS, 284, 785
- Gordon (1988) Gordon, M. A. 1988, H II regions and radio recombination lines, ed. K. I. Kellermann & G. L. Verschuur, 37–94
- Gordon (1989) Gordon, M. A. 1989, ApJ, 337, 782
- Gordon & Sorochenko (2002) Gordon, M. A. & Sorochenko, R. L., eds. 2002, Astrophysics and Space Science Library, Vol. 282, Radio Recombination Lines. Their Physics and Astronomical Applications
- Graf et al. (1993) Graf, U. U., Eckart, A., Genzel, R., et al. 1993, ApJ, 405, 249
- Griem (1967) Griem, H. R. 1967, ApJ, 148, 547
- Griffin et al. (1986) Griffin, M. J., Ade, P. A. R., Orton, G. S., et al. 1986, Icarus, 65, 244
- Güsten & Fiebig (1988) Güsten, R. & Fiebig, D. 1988, A&A, 204, 253
- Güsten et al. (2006) Güsten, R., Nyman, L. Å., Schilke, P., et al. 2006, A&A, 454, L13
- Habing (1968) Habing, H. J. 1968, Bull. Astron. Inst. Netherlands, 19, 421
- Hanson et al. (1997) Hanson, M. M., Howarth, I. D., & Conti, P. S. 1997, ApJ, 489, 698
- Harris et al. (1987) Harris, A. I., Stutzki, J., Genzel, R., et al. 1987, ApJ, 322, L49
- Henley et al. (2012) Henley, D. B., Kwak, K., & Shelton, R. L. 2012, ApJ, 753, 58
- Heyminck et al. (2012) Heyminck, S., Graf, U. U., Güsten, R., et al. 2012, A&A, 542, L1
- Heyminck et al. (2006) Heyminck, S., Kasemann, C., Güsten, R., de Lange, G., & Graf, U. U. 2006, A&A, 454, L21
- Hobson (1992) Hobson, M. P. 1992, MNRAS, 256, 457
- Hocuk & Spaans (2010) Hocuk, S. & Spaans, M. 2010, A&A, 522, A24+
- Hoffmeister et al. (2008) Hoffmeister, V. H., Chini, R., Scheyda, C. M., et al. 2008, ApJ, 686, 310
- Hollenbach et al. (1991) Hollenbach, D. J., Takahashi, T., & Tielens, A. G. G. M. 1991, ApJ, 377, 192
- Hollenbach & Tielens (1999) Hollenbach, D. J. & Tielens, A. G. G. M. 1999, Reviews of Modern Physics, 71, 173
- Howe et al. (2000) Howe, J. E., Ashby, M. L. N., Bergin, E. A., et al. 2000, ApJ, 539, L137
- Jaffe et al. (1987) Jaffe, D. T., Harris, A. I., & Genzel, R. 1987, ApJ, 316, 231
- Johnson et al. (1998) Johnson, C. O., Depree, C. G., & Goss, W. M. 1998, ApJ, 500, 302
- Keene et al. (1985) Keene, J., Blake, G. A., Phillips, T. G., Huggins, P. J., & Beichman, C. A. 1985, ApJ, 299, 967
- Klein et al. (2012) Klein, B., Hochgürtel, S., Krämer, I., et al. 2012, A&A, 542, L3
- Kleinmann (1973) Kleinmann, D. E. 1973, Astrophys. Lett., 13, 49
- Klessen et al. (2005) Klessen, R. S., Ballesteros-Paredes, J., Vázquez-Semadeni, E., & Durán-Rojas, C. 2005, ApJ, 620, 786
- Kramer et al. (2008) Kramer, C., Cubick, M., Röllig, M., et al. 2008, A&A, 477, 547
- Kramer et al. (2004) Kramer, C., Jakob, H., Mookerjea, B., et al. 2004, A&A, 424, 887
- Kramer et al. (1998) Kramer, C., Stutzki, J., Rohrig, R., & Corneliussen, U. 1998, A&A, 329, 249
- Krumholz et al. (2010) Krumholz, M. R., Cunningham, A. J., Klein, R. I., & McKee, C. F. 2010, ApJ, 713, 1120
- Lada et al. (1991) Lada, C. J., Depoy, D. L., Merrill, K. M., & Gatley, I. 1991, ApJ, 374, 533
- Loren (1989) Loren, R. B. 1989, ApJ, 338, 902
- Luhman et al. (2003) Luhman, M. L., Satyapal, S., Fischer, J., et al. 2003, ApJ, 594, 758
- Meijerink & Spaans (2005) Meijerink, R. & Spaans, M. 2005, A&A, 436, 397
- Meijerink et al. (2007) Meijerink, R., Spaans, M., & Israel, F. P. 2007, A&A, 461, 793
- Meixner et al. (1992) Meixner, M., Haas, M., Tielens, A., Erickson, E., & Werner, M. 1992, ApJ, 390, 499
- Mookerjea et al. (2003) Mookerjea, B., Ghosh, S. K., Kaneda, H., et al. 2003, A&A, 404, 569
- Mookerjea et al. (2011) Mookerjea, B., Kramer, C., Buchbender, C., et al. 2011, A&A, 532, A152
- Muders et al. (2006) Muders, D., Hafok, H., Wyrowski, F., et al. 2006, A&A, 454, L25
- Neufeld et al. (2010) Neufeld, D. A., Sonnentrucker, P., Phillips, T. G., et al. 2010, A&A, 518, L108
- Pearson (1920) Pearson, K. 1920, Biometrica, 13, 25
- Peimbert et al. (1988) Peimbert, M., Ukita, N., Hasegawa, T., & Jugaku, J. 1988, PASJ, 40, 581
- Pellegrini et al. (2007) Pellegrini, E. W., Baldwin, J. A., Brogan, C. L., et al. 2007, ApJ, 658, 1119
- Pérez-Beaupuits et al. (2007) Pérez-Beaupuits, J. P., Aalto, S., & Gerebro, H. 2007, A&A, 476, 177
- Pérez-Beaupuits et al. (2010) Pérez-Beaupuits, J. P., Spaans, M., Hogerheijde, M. R., et al. 2010, A&A, 510, A87+
- Pérez-Beaupuits et al. (2009) Pérez-Beaupuits, J. P., Spaans, M., van der Tak, F. F. S., et al. 2009, A&A, 503, 459
- Pérez-Beaupuits et al. (2013) Pérez-Beaupuits, J. P., Stutzki, J., Güsten, R., Ossenkopf, V., & Wiesemeyer, H. 2013, in IAU Symposium, Vol. 292, IAU Symposium, ed. T. Wong & J. Ott, 55–55
- Pérez-Beaupuits et al. (2012) Pérez-Beaupuits, J. P., Wiesemeyer, H., Ossenkopf, V., et al. 2012, A&A, 542, L13
- Pérez-Beaupuits et al. (, in prep.) Pérez-Beaupuits, J. P., Zinnecker, H., Güsten, R., et al. , in prep.
- Poelman & Spaans (2005) Poelman, D. R. & Spaans, M. 2005, A&A, 440, 559
- Rodgers & Nicewander (1988) Rodgers, J. L. & Nicewander, W. A. 1988, The American Statistician, 42, 59
- Röllig et al. (2011) Röllig, M., Kramer, C., Rajbahak, C., et al. 2011, A&A, 525, A8
- Russell et al. (1981) Russell, R. W., Melnick, G., Smyers, S. D., et al. 1981, ApJ, 250, L35
- Sargsyan et al. (2014) Sargsyan, L., Samsonyan, A., Lebouteiller, V., et al. 2014, ApJ, 790, 15
- Schneider et al. (2003) Schneider, N., Simon, R., Kramer, C., et al. 2003, A&A, 406, 915
- Schneider et al. (2002) Schneider, N., Simon, R., Kramer, C., Stutzki, J., & Bontemps, S. 2002, A&A, 384, 225
- Schöier et al. (2005) Schöier, F. L., van der Tak, F. F. S., van Dishoeck, E. F., & Black, J. H. 2005, A&A, 432, 369
- Spaans (1996) Spaans, M. 1996, A&A, 307, 271
- Spaans & van Dishoeck (1997) Spaans, M. & van Dishoeck, E. F. 1997, A&A, 323, 953
- Stacey et al. (1991) Stacey, G. J., Geis, N., Genzel, R., et al. 1991, ApJ, 373, 423
- Stutzki & Güsten (1990) Stutzki, J. & Güsten, R. 1990, ApJ, 356, 513
- Stutzki et al. (1988) Stutzki, J., Stacey, G. J., Genzel, R., et al. 1988, ApJ, 332, 379
- Tenorio-Tagle (1979) Tenorio-Tagle, G. 1979, A&A, 71, 59
- Tsivilev & Krasnov (1999) Tsivilev, A. P. & Krasnov, V. V. 1999, Astronomy Reports, 43, 511
- van der Tak et al. (2007) van der Tak, F. F. S., Black, J. H., Schöier, F. L., Jansen, D. J., & van Dishoeck, E. F. 2007, A&A, 468, 627
- Wakelam & Herbst (2008) Wakelam, V. & Herbst, E. 2008, ApJ, 680, 371
- Weaver et al. (1977) Weaver, R., McCray, R., Castor, J., Shapiro, P., & Moore, R. 1977, ApJ, 218, 377
- Wolfire et al. (2010) Wolfire, M. G., Hollenbach, D., & McKee, C. F. 2010, ApJ, 716, 1191
- Yamamoto et al. (2001) Yamamoto, S., Maezawa, H., Ikeda, M., et al. 2001, ApJ, 547, L165
Appendix A LTE Analysis of [C I]
Following Frerking et al. (1989) and Schneider et al. (2003, their Appendix A), the optical depths of the [C I] and lines can be estimated from the excitation temperature and the peak intensity of both lines, assuming a beam filling factor of unity. Knowing the excitation temperature and the optical depth of the line, the column density [C I] can be computed as well. Figures 23 and 24 shows the channel maps corresponding to the optical depths of both [C I] lines, while Fig. 25 shows the channel maps of the [C I] column density, as estimated assuming LTE conditions.
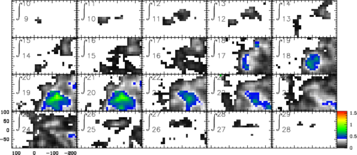
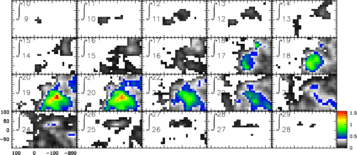
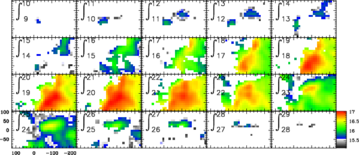
Appendix B Non-LTE Excitation Analysis of [C I]
Following the procedure described in (Pérez-Beaupuits et al. 2007, 2009), we use the radiative transfer code RADEX (van der Tak et al. 2007) to create a data cube containing the intensities, as well as the excitation temperatures and optical depths of the two [C I] transitions, in function of a range of kinetic temperatures , number densities (i.e., excitation conditions), and column densities per line width . The collision rates used were taken from the LAMDA database (Schöier et al. 2005).
We only used collisions with H2 since this is the most abundant molecule. Other collision partners can be H and He. Although their collision cross sections are comparable, H2 is about 5 times more abundant than He, and H is at least one order of magnitude less abundant than H2 in the dense cores of molecular clouds (e.g., Meijerink & Spaans 2005). Hence, including H and He as additional collision partners would not produce a significant change in our results. We also assumed a homogeneous spherical symmetry in the clumps for the escape-probability formalism.
The original RADEX code was modified to include dust background emission as a diluted blackbody radiation field, as in Poelman & Spaans (2005) and Pérez-Beaupuits et al. (2009). The total background radiation is modeled as a composite between the cosmic background radiation (CMB), assumed to be a blackbody function at 2.73 K, and the diluted dust radiation estimated as , where is the Planck function and the dust continuum optical depth is defined by Hollenbach et al. (1991) as . We adopted an average dust background temperature K and the high FIR opacity found by Meixner et al. (1992) in M17SW.
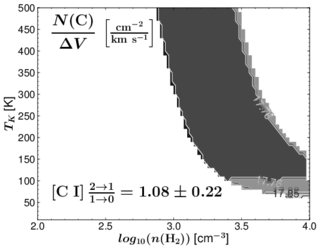
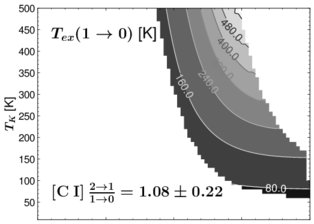 |
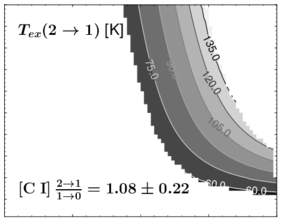 |
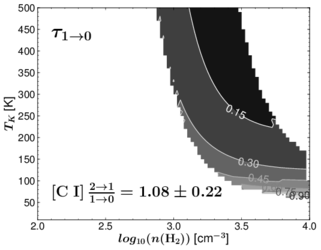 |
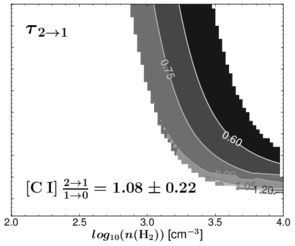 |
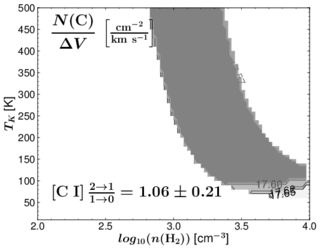
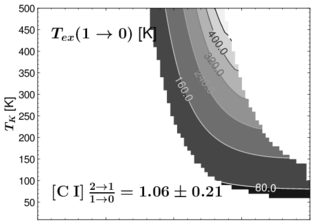 |
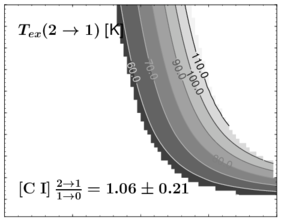 |
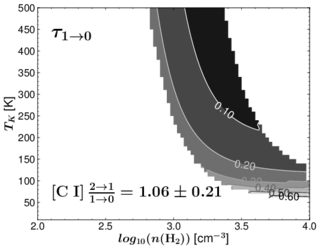 |
 |
We assume that the emission collected by the beam has a homogeneous elliptical Gaussian distribution and that the coupling factor of our beam to the source distribution is unity, so we can compare directly with the output of RADEX, which is the Rayleigh-Jeans equivalent radiation temperature emitted by the source.
We explored all the possible excitation conditions within the given range that can lead to the observed radiation temperatures and the line ratios between the two [C I] lines. The line ratios and the peak temperature of the lower- line involved in each ratio were used to constrain the excitation conditions. Including the rms of the observed spectra and uncertainties in all the assumptions mentioned above, a 20% error of the ratios and peak temperatures are used to define a range of values for , , and within which the RADEX output is selected as a valid solution.
The volume density explored ranges between and , the kinetic temperature varies from 10 K to 500 K, and the column density per line width lies between and . Since the optical depth, and the line intensities, are proportional to the column density per line width , we generated the RADEX data cube assuming the of the velocity channels in the re-sampled spectra. In order to constrain the solutions, we fit the line ratio between the peak temperatures of the transitions and the radiation temperature of the lower transition (), which are and K at offset position (,), and and K at offset position (,).
Figures 26 to 27 show gray scale and contour maps of the excitation conditions found to reproduce the observed [C I] line ratios and peak temperatures at the offset positions (,) and (,), respectively. The values shown correspond to the average of all the possible , , and found for each pair of excitation conditions ( and ). The curvature in the solutions depict the dichotomy between the kinetic temperature and the density of the collision partner. In other words, solutions for the observed values can be found for higher temperatures and lower densities, but also for lower and higher . The column density per line width does not change significantly along the solution curve, but it does change slightly across the curves, and especially at lower ( K) kinetic temperatures. This means that for a given kinetic temperature, will show a small variation in function of density.
Appendix C Correlation between line tracers
In order to verify the apparent spatial correlation between two species, we use the correlation between a specific pixel value of a map, and the same pixel in the map of another tracer. This can be done only in the maps with the same dimensions and spatial resolutions. Therefore, we first convolved all the maps to the larger beam size (24′′) of the C18O line, and we used the SOFIA/GREAT map of the [C II] 158 m line (which covers the smaller region) as a template to create all the [C I] and CO maps. The sample correlation coefficient commonly used to estimate between the images and is the Pearson’s product-moment correlation coefficient defined by (Pearson 1920; Rodgers & Nicewander 1988),
| (4) |
where and are the pixel values of two given maps or images (e.g., [C II] and 12CO ), and and are the average pixel value of the respective maps. We note that the uncertainty of the correlation coefficient can be approximated as , and since we have maps with pixels, the uncertainty will always be between 10-2 and 10-3. This correlation is applied to the velocity integrated intensity maps, and to the 1 width channel maps. We note that because of the positive correlation between the intensities of different tracers, ranges between 0 and 1. As proof of concept, the scatter plot and the associated correlation coefficient between the velocity-integrated intensity of several line tracers is shown in Fig. 28. The application of the scatter plot to the channel maps is shown in Fig. 29 for two test cases. We note that the correlation between the velocity-integrated intensity, as well as the channel maps, of the and transitions of 12CO is very good, even at the faintest emission of the lower velocity () channels, but the good correlation is lost at the higher velocity () channels. In the case of the [C I] 370 m (X-axis) versus 13CO (Y-axis), the pixel values are more scattered at the lower ( ) and higher ( ) velocity channels because the line intensities are fainter and, hence, those channel maps are more affected by noise.

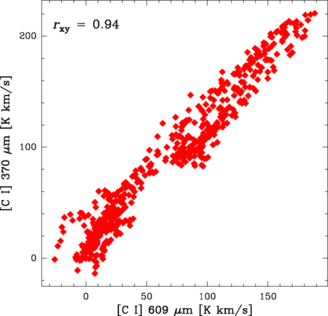
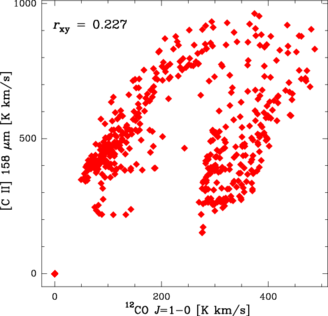

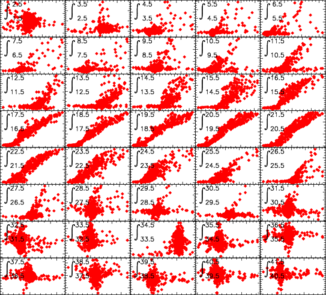

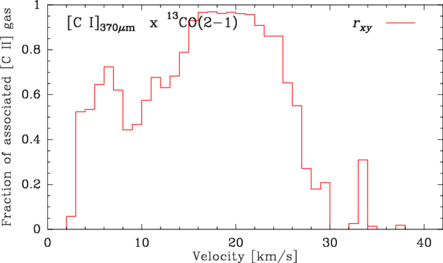
Appendix D Spatial association in channel maps
We use a simple method to estimate the fraction of the region mapped where two emission lines are associated in narrow (1 ) width channel maps. All maps are first convolved to the lowest spatial resolution (24′′ FWHM beam) of the C18O map in order to increase the S/N, and the size of the [C I], 12CO and isotope maps is limited to the region mapped in [C II] by using the [C II] data cube as a template in GILDAS/CLASS. In this way, we produce spectral cubes with the same dimensions and number of pixels.
Then we determine which region of the maps have significant emission. This can be done naturally by using the rms (noise) level of the spectra corresponding to each pixel in the map (i.e., a 3- level detection), or by defining a threshold for the intensities. Since our maps (especially that of the [C II] line) are not homogeneously sampled, the rms level varies among the different pixels. Hence, we prefer to use a fraction of the global peak (maximum) integrated intensity found among all the channel maps as a threshold. This provides a unique value that is used to determine whether the emission of some region (pixel) in a particular channel map is significant or not.
We create binary images for each channel map by assigning a zero to all the pixels with intensity values lower than the threshold, and a value of unity to all the pixels that have intensity values larger than or equal to the threshold. We use a conservative value of 10% of the global peak emission for the threshold, which is about ten times higher than the noise level in most of the channel maps of all the lines we consider. This conservative value is used in order to avoid the association of emission levels in one image that would be considered noise in another image.
Then we multiply each binary channel map image of the two line tracers we want to compare, to see if there are regions where the two emissions are associated in that particular velocity channel. The product image would contain pixels with 1’s in regions where both line tracers have significant emission, and 0’s otherwise. Thus, adding up all the pixels from the product image, and dividing by the total number of pixels, we obtain the fraction of the region mapped where the emission from both lines is associated. An example of this procedure, applied to the [C II] 158 m and [C I] 609 m lines, is shown in Fig. 30.
With this method we can estimate the fraction, and where in the region mapped, two line tracers are associated at each velocity channel. The fraction of the region mapped can be compared with the correlation coefficient described in Appendix C. Test cases of this are shown in Fig. 31.
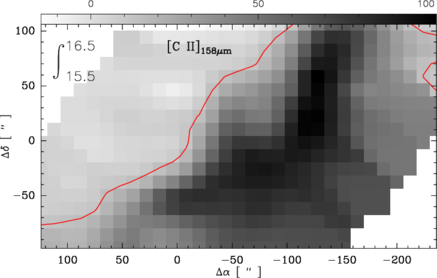
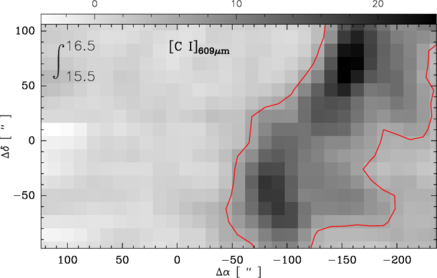
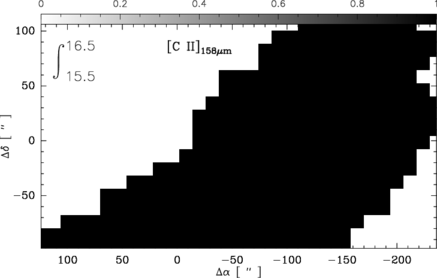
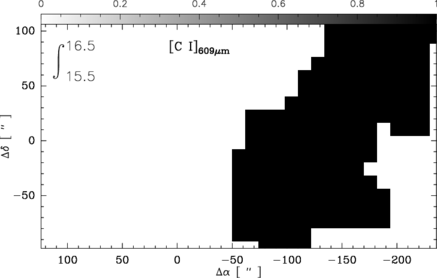
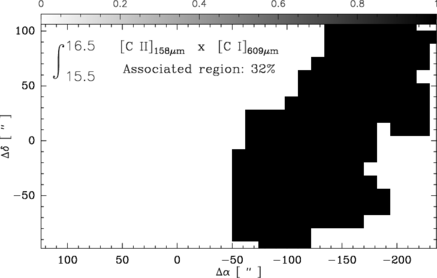
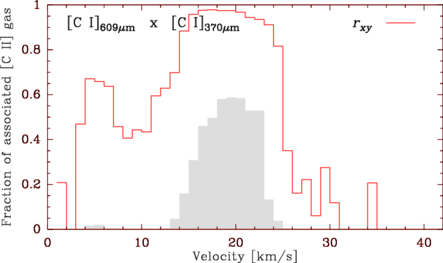
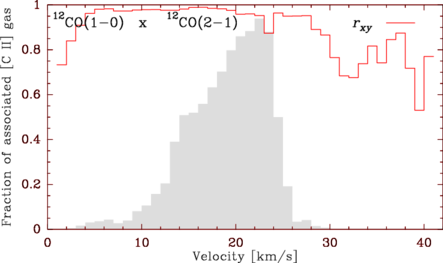
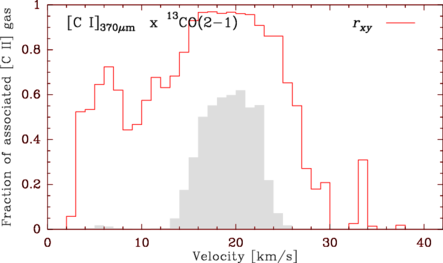
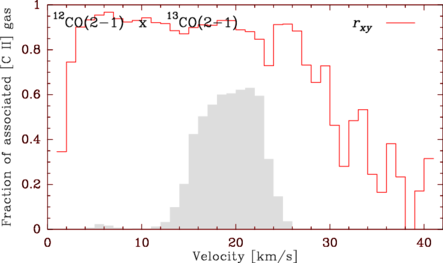
Appendix E [C II] emission associated with the three gas phases
Subtracting the scaled up spectra of [C I] 609 m, 12CO , and the velocity-resolved optical depth (H I) from the [C II] spectra, we obtained a residual [C II] emission that should be mostly associated with the ionized hydrogen gas (H II). When subtracting the maximum (channel by channel) between the tracers of the H2 gas (e.g., [C I] 609 m and 12CO , or [C I] 609 m and C18O ) from the original [C II] spectra, we obtain a second residual [C II] emission that is expected to be mostly associated with the neutral (H I) and ionized atomic gas (H II). The difference between these residual spectra and the original [C II] spectra gives the [C II] emission that is mostly associated with the H2 gas. Subtracting the the [C II] emission that is mostly associated with the H2 gas and the first residual spectra associated with H II from the original [C II] spectra would lead to a third residual [C II] emission that is mostly associated with the neutral atomic hydrogen gas, H I. The corresponding column densities can be estimated assuming the LTE conditions and Eq. 2. The velocity channel maps of the residual [C II] emission associated to each of the gas phases, as estimated with model (2) from Table 1, is shown in Fig. 32.
