Towards Energy-Proportional Computing Using Subsystem-Level Power Management
Abstract
Massive data centers housing thousands of computing nodes have become commonplace in enterprise computing, and the power consumption of such data centers is growing at an unprecedented rate. Adding to the problem is the inability of the servers to exhibit energy proportionality, i.e., provide energy-efficient execution under all levels of utilization, which diminishes the overall energy efficiency of the data center. It is imperative that we realize effective strategies to control the power consumption of the server and improve the energy efficiency of data centers. With the advent of Intel Sandy Bridge processors, we have the ability to specify a limit on power consumption during runtime, which creates opportunities to design new power-management techniques for enterprise workloads and make the systems that they run on more energy-proportional.
In this paper, we investigate whether it is possible to achieve energy proportionality for enterprise-class server workloads, namely SPECpower_ssj2008 and SPECweb2009 benchmarks, by using Intel’s Running Average Power Limit (RAPL) interfaces. First, we analyze the average power consumption of the full system as well as the subsystems and describe the energy proportionality of these components. We then characterize the instantaneous power profile of these benchmarks within different subsystems using the on-chip energy meters exposed via the RAPL interfaces. Finally, we present the effects of power limiting on the energy proportionality, performance, power and energy efficiency of enterprise-class server workloads. Our observations and results shed light on the efficacy of the RAPL interfaces and provide guidance for designing power-management techniques for enterprise-class workloads.
Index Terms:
Power Limiting, Energy Proportionality, RAPL, Enterprise Computing, SPEC1 Introduction
Massive data centers, which house thousands of computing nodes, have become increasingly more common. A large fraction of such data centers’ total cost of ownership (TCO) comes from the cost of building and maintaining infrastructure that is capable of powering such large-scale data centers and from the recurring energy costs [6]. Consequently, power and energy have emerged as first-order design constraints in data centers. These issues are further magnified by the inability of servers to provide energy-efficient execution at all levels of utilization (i.e., load-levels).
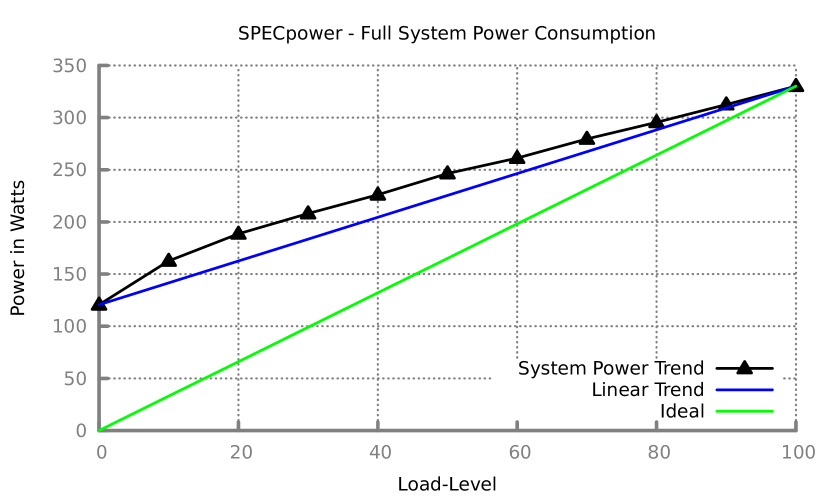
Figure 1 shows the power consumption of a compute server running SPECpower under different load-levels and the hypothetical linear and ideal (i.e., energy-proportional) non-peak power curves. As evident from the figure, there is room to improve the non-peak power efficiency of the server with respect to both the ideal as well as linear power curves. The recent recommendation of energy proportionality in servers, i.e., to design servers that consume power proportional to the utilization, is a move in the right direction as it has the potential to double the energy efficiency of servers [1]. However, achieving energy-proportional operation is a challenging task, particularly given that typical servers consume 35-45% of peak power, even when idling.
Typically, dynamic voltage and frequency scaling (DVFS) has been used to achieve better energy efficiency as it can potentially give up to cubic energy savings [8, 15, 17]. However, as we will show in this paper, the subsystem affected by DVFS (i.e., the core111The core subsystem includes components such as the ALUs, FPUs, L1, and L2 caches [9].) is already the most energy-proportional part of the system. There are other subsystems, such as the uncore,222The uncore subsystem includes components such as the memory controller, integrated I/O, and coherence engine [9]. that consume constant power, irrespective of the system utilization. In order to achieve energy proportionality, we need to understand the power consumption of each subsystem at different levels of utilization and to leverage mechanisms that enable us to control the power consumption of these subsystems.
With the advent of Intel Sandy Bridge processors, we have better control over the power consumption of the system via the Running Average Power Limit (RAPL) interfaces [3, 10]. RAPL exposes on-chip energy meters for the core subsystem, processor package, and DRAM and enables the tracking of power consumption at a time resolution (1 ms) and system-level granularity that was not possible before. Moreover, it facilitates deterministic control over the power consumption of subsystems through power limiting interfaces. These interfaces allow a user to specify a power bound and a time window over which the bound should be maintained. While this hardware-enforced power limiting is an appealing option, the impact of power limiting on the performance, power, and energy efficiency of enterprise-class server workloads is still not well understood and remains an active area of research.
In this paper, we investigate whether it is possible to achieve energy-proportional operation for enterprise-class server workloads, namely the SPECpower_ssj2008 and SPECweb2009 benchmarks (henceforth referred to as SPECpower and SPECweb respectively) by using the RAPL interfaces. To this end, this paper makes the following contributions: (i) insights into the mechanisms of power management for enterprise-class server workloads using the RAPL interfaces via an analysis of the SPECpower and SPECweb benchmarks by calibrating its input parameters, (ii) a rigorous quantification of the energy proportionality of each subsystem within a server node via an analysis of power consumption profiles of the different subsystems when running SPECpower and SPECweb at different load-levels, (iii) an analysis and characterization of the instantaneous-power profiles at different load-levels of SPECpower and SPECweb to understand whether power limiting will enable us to improve the energy efficiency of these benchmarks and (iv) empirical results on the impact of RAPL power limiting on average power, performance, instantaneous power, and energy efficiency.
Through our contributions, we make the following observations and conclusions on the power management of the SPECpower and SPECweb benchmarks using RAPL interfaces:
-
•
The core is the most energy-proportional subsystem and the uncore is the least.
-
•
Better power management mechanisms are required to achieve energy proportionality at the uncore subsystem-level.
-
•
There is ample opportunity for limiting the power consumption of processor package and memory subsystems.
-
•
Power limiting at the level of the core subsystem is the best option for improving energy efficiency and achieving energy proportionality.
-
•
Though we were not able to achieve energy proportionality at the full system level, i.e., entire compute node, we show that energy-proportional operation or better is possible at the granularity of subsystems over which we have control via RAPL power limiting (i.e., core subsystem, processor package, and DRAM).
The rest of the paper is organized as follows. In Section 2, we present the details of the SPECpower and SPECweb benchmarks and Intel RAPL interfaces. Section 4 describes our analysis and characterization of average power consumption. It presents details on the energy proportionality of full system as well as subsytems. Section 5 details the instantaneous power profile of all subsystems at different load levels in SPECpower and SPECweb and the observations from these experiments. Next in Section 6, we limit the power consumption of SPECpower and SPECweb to study the impact of it on the power, performance and energy efficiency of these benchmarks. In Section 7, we describe the related work, and we conclude in Section 8.
2 Background
In this section, we provide an overview of the SPECpower benchmark and its design as well as details into its configurable parameters. We then present the control and capabilities exposed by Intel’s RAPL interfaces.
2.1 Overview of SPECpower Benchmark
SPECpower [18] is an industry-standard benchmark that measures both the power and performance of a server node. The benchmark mimics a server-side Java transaction processing application. It stresses the CPU, caches, and memory hierarchy and tests the implementations of the Java virtual machine (JVM), just-in-time (JIT) compiler, garbage collection, and threads. The benchmark requires two systems: (1) the system under test or SUT and (2) the control and collection system (CCS) with communication between the systems established via Ethernet.333SUT and CCS can be the same system. Communication is established via Ethernet only if the systems are different. The SUT runs the workload and is connected to a power meter. The power meter, in turn, is connected to the CCS. The CCS collects the performance and power data passed to it by the SUT and power meter, respectively.
The SPECpower benchmark is designed to produce consistent and repeatable performance and power measurements. It executes different type of transactions and the transactions are grouped together in batches for scheduling purposes. Each load-level is achieved by controlling delay between the arrival of batches.
More specifically, the SPECpower benchmark is a graduated workload, i.e., it runs the workload at different load-levels and reports the power and performance at each load-level. The benchmark starts with a calibration phase, which determines the maximum throughput. The calibrated throughput is set as the throughput target for 100% load-level. The throughput target for the rest of the load-levels is calculated as a percentage of the throughput target for 100% load-level. For example, if the throughput target for 100% load-level is 100,000, then the target for 70% load-level is 70,000, 40% is 40,000 and so on. The throughput is measured in server-side Java operations per second (ssj_ops).
The benchmark supports a set of configurable parameters.444Only a subset of these parameters can be changed for compliant runs. For example, the maximum target throughput and the batch size can be manually configured. We refer the reader to [20] for further information on configurable parameters. The flexibility, coupled with the consistency and repeatability of SPECpower, allows us to evaluate the applicability of newer power-management interfaces, such as RAPL, to enterprise-class server workloads.
2.2 Overview of SPECweb Benchmark
SPECweb is an industry standard benchmark for measuring front-end web server performance. It allows the user to measure performance based on the request handling capability and response time maintained by a server node. The benchmark consists of four different components:
-
1.
Client: It runs the application program which sends HTTP requests to the server and receives the corresponding response from the server.
-
2.
Web Server: It handles the requests issued by the client. This is also the system under test (SUT) for this benchmark.
-
3.
Back-End Simulator (BeSim): It emulates a back-end application server. The web server communicates with Besim to retrieve specific information required to complete a request from one of the clients.
-
4.
Prime Client: It initiates and controls the clients and also initializes the web server and Besim. It collects performance results for the benchmark.
The main performance and power metric for the benchmark is simultaneous user sessions (SUS) and SUS/watt respectively. In addition to SUS, the SPECweb benchmarks adds two different response time performance metrics, namely TIME_GOOD and TIME_TOLERABLE. By default, 95% and 99% of the requests should have response time less that TIME_GOOD and TIME_TOLERABLE respectively. Similar to SPECpower, we can control the benchmark parameters to execute the benchmark at different load-levels i.e., different SUS. This benchmark also allows us tweak a set of input parameters. We refer the reader to [21] for a full list of configurable parameters.
2.3 Intel’s Running Average Power Limit (RAPL) Interfaces
RAPL was introduced in Intel Sandy Bridge processors. The RAPL interfaces provide mechanisms to enforce power consumption limits on a specific subsystem. The only official documentation available for these interfaces is section 14.7 of the Intel software developer’s manual [10]. Our experiments deal only with the Sandy Bridge server platforms.
The RAPL interfaces can be programmed using the model-specific registers (MSRs). MSRs are used for performance monitoring and controlling hardware functions. These registers can be accessed using two instructions: (1) rdmsr, short for “read model-specific registers” and (2) wrmsr, short for “write model-specific registers.” The msr kernel module can be used for accessing MSRs from user space in Linux environments. When loaded, the msr module exposes a file interface at /dev/cpu/x/msr. This file interface can be used to read from or write to any MSR on that CPU.
According to the Intel documentation, RAPL interfaces operate at the granularity of a processor socket. The server platforms provide control over three domains (i.e., subsystems):555Note: We use RAPL domain and subsystem interchangeably in rest of the paper. (1) package (PKG), (2) power plane 0 (PP0), and (3) DRAM. PKG, PP0 and DRAM represents the processor package (or socket), the core subsystem, and memory DIMMs associated with that socket, respectively. The MSR_RAPL_POWER_UNIT register contains the units for specifying time, power, and energy, and the values are architecture-specific. For example, our testbed requires and reports time, power, and energy at increments of 976 microseconds, 0.125 watts, and 15.3 microjoules, respectively. Each domain consists of its own set of RAPL MSR interfaces. On a server platform, RAPL exposes four capabilities:
-
1.
Power limiting – Interface to enforce limits on power consumption.
-
2.
Energy metering – Interface reporting actual energy usage information.
-
3.
Performance status – Interface reporting performance impact due to power limit.
-
4.
Power information – Interface which provides value range for control attributes associated with power limiting.
2.3.1 Power Limiting
RAPL maintains an average power limit over a sliding window instead of enforcing strict limits on the instantaneous power. The advantage of having an average power limit is that if the average performance requirement is within the specified power limits the workload will not incur any performance degradation even if the performance requirement well exceeds the power limit over short bursts of time. The user has to provide a power bound and a time window in which the limit has to be maintained. Each RAPL domain exposes a MSR which is used for programming these values. The PKG domain provides two power limits and associated time window for finer control over the workload performance whereas other domains provide only one power limit. The interface provides a clamping ability, which when enabled, allows the processor to go below an OS-requested P-state.
2.3.2 Energy Metering
Each domain exposes a MSR interface that reports the energy consumed by that domain. On a server platform, (1) energy(PKG) = energy consumed by the processor package, (2) energy(PP0) = energy consumed by the core subsystem, and (3) energy(uncore subsystem) = energy(PKG) energy(PP0).
2.3.3 Performance Status
This MSR interface reports the total time for which each domain was throttled (i.e., functioning below the OS-requested P-state) due to the enforced power limit. This information will be useful in understanding the effects of power limiting on a particular workload.
2.3.4 Power Information
The PKG and DRAM domains expose a MSR interface that provides information on the ranges of values that can be specified for a particular RAPL domain for limiting its power consumption. This includes maximum time window, maximum power, and minimum power. The range of per-socket values on our experimental platform is given in Table I.
| Domain/Range | MTW | MaxP | MinP |
|---|---|---|---|
| Package | 45.89 ms | 180 watts | 51 watts |
| DRAM | 39.06 ms | 75 watts | 15 watts |
3 Experimental Setup
The SUT for our experiments is an Intel Xeon E5-2665 processor (Intel Romley-EP). The node has two such processors for a total of 16 cores and 32 cores when hyperthreading is ON. It has 256 GB of memory and runs a Linux kernel version 3.2.0. We used a Yokogawa WT210 power meter for full system power measurements.
3.1 Setup for SPECpower
The CCS has an Intel Xeon E5405 processor with dual quad cores and 8 GB of RAM. The CCS runs a Linux kernel version 2.6.32. The CCS and SUT were connected through a gigabit Ethernet network. We used all the cores in SUT for our experiments. Eight JVMs with four threads for each JVM were used as the configuration for SPECpower. The four threads in each JVM were pinned to two adjacent physical cores on the SUT using numactl. To further enhance the performance of the SUT, we enabled large page memory (HugeTLB) support and set aside 32 GB for huge page allocation. Note that HugeTLB support is enabled only for SPECpower. In order to provide consistent performance results throughout our experiments, we configured the input.load_level.target_max_throughput parameter to achieve the same performance for each run. It was set to 140,000 ssj_ops for each JVM for a total of 1,120,000 ssj_ops for the entire run. In all our experiments, 100% load-level corresponds to 1,120,000 ssj_ops. This value was determined by averaging 10 calibration runs. We changed the runtime for each load-level to 120 seconds using the input.load_level.length_seconds parameter and the pre- and post-measurement interval to 15 seconds in order to reduce the total runtime of the benchmark. We use 1000 as our batch size as there is minimal to no effect on power due to batch sizes (See Appendix A). On an average, the SUT consumes 120 watts at idle and 330 watts at 100% load-level of SPECpower. We would like to stress that the system consumes 36.51% of peak power666Power consumed at 100% load-level. even when idling.
3.2 Setup for SPECweb
We used 26 clients, 1 prime client and 2 Besim for our experiments. The prime client is an Intel Xeon E5405 processor with two quad cores and 8 GB of RAM. The Besims had two dual core AMD Opteron 2218 processors with 4 GB of RAM. In this paper, we benchmark only the SPECweb_PHP_Ecommerce workload. We used a Apache installation with php module as our web serving application. We setup a bonded Ethernet link with the available ports on the SUT to enable data transmission upto 2 Gbps. Note that the bonded Ethernet link is only setup for SPECweb. In our experiments for SPECweb, 100% load-level corresponds to 13000 SUS. This value was determined using empirical analysis (see Appendix B). In addition to the sessions, all our experiments also maintain the response time criteria. In our case, 95% (TIME_GOOD parameter) and 99% (TIME_TOLERABLE parameter) of the requests need to have response times less than 3 and 5 seconds, respectively. These response time constraints are default values and used in the compliant runs. The load-level is changed by manually modifying the SIMULTANEOUS_SESSIONS parameter in the input configuration. We modified the RUN_SECONDS input parameter to 420 seconds to reduce the runtime of the benchmark. Since we focus only on the processor package and memory power management, we load all the data associated with the Ecommerce workload into RAMFS to keep the data set in memory and minimize the involvement of disks. On an average, the SUT consumes 120 watts when idling and 219 watts at 100% load-level of SPECweb. In case of SPECweb, the system consumes 54.88% of peak power when idling.
4 An Analysis of Average Power Consumption
In this section, we characterize the power consumption of the SPECpower and SPECweb benchmarks and analyze energy proportionality from the perspective of the entire system as well as each RAPL domain. Through our experiments, we will show that the most and least energy-proportional subsystems are the core (PP0) and the uncore (Package-PP0), respectively.
4.1 Power Consumption Analysis
As discussed earlier, we are interested in analyzing the energy proportionality of the system. The deviation of the power curve of the system from the ideal power curve is of particular interest to us. To illustrate with an example, we would like the area between the system and the ideal power curve to be as small as possible in Figure 1. Henceforth, this area will be referred to as energy proportionality gap (EPG). We are also interested in the linearity of the system power curve which is the area between the system power trend and linear curve. Henceforth, this area will be referred to as linear deviation gap (LDG).
4.1.1 Properties of Energy-Proportional Systems
Barroso et. al [1] advocated the design of energy-proportional systems by addressing power characteristics of the server and the behavior of enterprise-class server workloads. They proposed two properties of energy-proportional systems – low idle power and wide dynamic power range. These two properties are particularly illustrated by the ideal curve in Figure 1. The ideal curve consumes zero power when idling (i.e., at 0% load-level) and has a wide dynamic power range. In this paper, we will quantify the idle power and the dynamic power range as percentage of peak power (i.e., the power consumed at 100% load-level).
4.1.2 Energy Proportionality Metric
We quantify the EPG using two different metrics: (1) the EP metric [16] and (2) the PG metric [25]. Each of these metrics serve different purposes and quantifies the energy proportionality of the system along different granularities. The EP metric is calculated as shown in Equation 1 where and represent the area under the system and ideal power curve respectively. A value of 1 for the metric represents an ideal energy-proportional system. A value of 0 represents a system that consumes a constant amount of power irrespective of the load-level. A value greater than 1 represents a system which is better than energy-proportional.777Originally, the EP metric proposed in [16] varied only between 0 and 1 (i.e., it did not account for better than energy-proportional systems). However, in this paper we extend EP metric to account for better than energy-proportional system (i.e., 0 EP metric 2). The EP metric gives a perspective of the energy proportionality of the system at the full system level.
| (1) |
The PG metric is calculated as shown in Equation 2 where represents load-level. As observed, the PG metric defines the EPG at individual load-levels. For an ideal energy-proportional server, the PG for all utilization should be 0.
| (2) |
The LDG is quantified using LD metric [25]. The LD metric is calculated using Equation 3. For an linear energy-proportional system, the LD metric will be 0. LD metric 1 and 1 indicate superlinear and sublinear energy proportional systems.
| (3) |
We will use the properties described in Section 4.1.1 along with the EP metric, PG metric and LD metric to quantify the energy proportionality. We will also look at the EPG and LDG both at full system- and subsystem-levels in rest of the sections.
4.1.3 Methodology
We used the energy meters exposed in each RAPL domain to determine the power dissipated in each domain. In all our results, we report the average power888Average power is calculated as (initial energy reading - final energy reading)/time. over ten runs for the domain-level power consumption. For full-system power measurement, we have followed the power measurement methodology specified and developed by the SPEC organization for the SPECpower and SPECweb benchmarks [19].
4.1.4 Analysis of System- and Subsystem-Level Energy Proportionality
In this section, we present the details on the power consumption of SPECpower and SPECweb at a subsystem-level. We were able to profile the benchmark at a granularity that has not been possible until the advent of Intel Sandy Bridge by using the on-chip energy meters exposed by the RAPL interfaces. Our results provide insights into the energy proportionality of a system as a whole as well as at the RAPL domain-level.
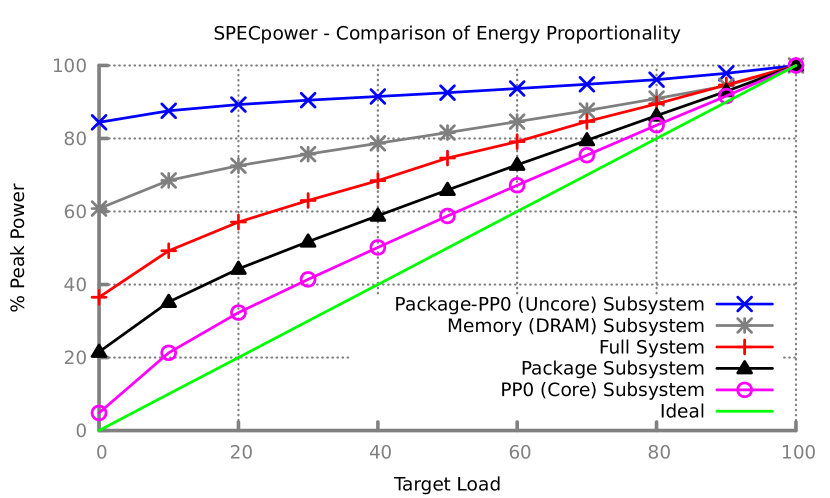
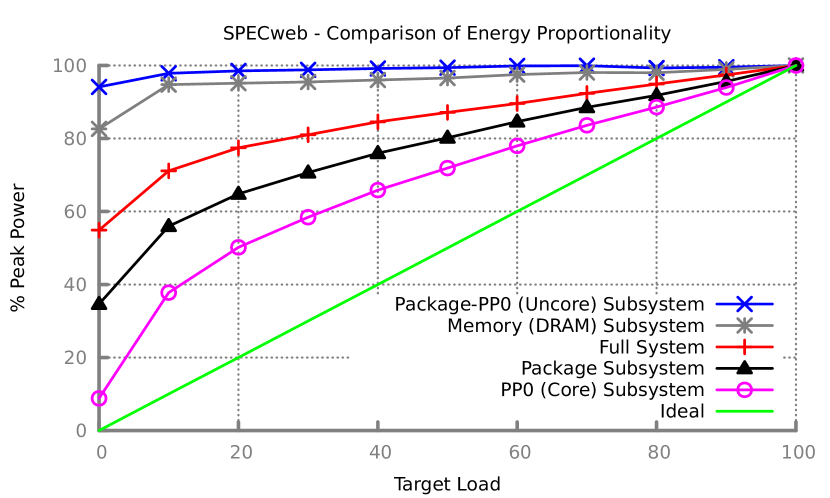
Figures 2 and 3 describes the energy proportionality of the full system and different subsystems. The Y-axis represents the percentage of peak power consumed by the system or subsystem and X-axis represents the load-level. As a result, the ideal curve (green line) consumes 40% of peak power at 40% load-level, 60% of peak power at 60% load-level and so on. Figures 2 and 3 are also a compact comparison of the energy proportionality of different components of the system. As mentioned earlier, we will quantify the energy proportionality using the EP, PG and LD metrics and the desired properties of an energy-proportional system.
Full System Energy Proportionality
The energy proportionality of full system is represented by the red line in Figures 2 and 3. The EP metric for full system is 0.54 and 0.29 for SPECpower and SPECweb respectively. Full system idles at 36.51% and 54.88% of peak power for SPECweb and SPECpower. Therefore, it is impossible to achieve energy-proportional operation for load-levels less than 36% in case of SPECpower and 54% in case of SPECweb. The dynamic power range is 63.48% for SPECpower and 45.11% for SPECweb.999Dynamic power range is calculated as power consumed at 100% load-level - 0% load-level.
Package (PKG) Energy Proportionality
The EP metric value for the package subsystem is 0.70 and 0.44 for SPECpower and SPECweb respectively. It is also worth noting that the power profile of package and full system follow a similar trend for both the benchmarks, indicating a strong correlation between them.101010The Pearson correlation is greater than 0.99. The package subsystem idles at 21.55% and 34.47% for SPECpower and SPECweb respectively. The dynamic power range for SPECpower is 78.44% and SPECweb is 65.52%. In general, due to its better EP metric, lower idle power and high dynamic power range package subsystem is more energy-proportional than the full system.
Core (PP0) Energy Proportionality
The purple line in Figures 2 and 3 describes the energy proportionality of the PP0 domain. We observe that this subsystem has near energy-proportional power profile for SPECpower benchmark. However, it is relatively less energy-proportional in case of the SPECweb benchmark. It has a EP metric value of 0.85 in case of SPECpower and 0.63 in case of SPECweb. This subsystem idles at 5.74 watts (4.83% of peak power) and has a dynamic power range of 95.16% of peak power for SPECpower. The idle power and dynamic power range are 8.80 and 91.19 percent of peak power for the SPECweb benchmark. The low idle power coupled with the high dynamic power range makes this subsystem suitable to be operated at different power-performance trade-offs.
Uncore (Package-PP0) Energy Proportionality
The uncore subsystem’s power consumption remains almost constant irrespective of the load-level with an EP metric value of 0.14 for SPECpower and 0.02 for SPECweb. The uncore subsystem has the greatest EPG, and as a result, exhibits the worst power consumption trend among the full system and RAPL domains from the perspective of energy-proportional power scaling. It idles at 84.41% and 94.13% of peak power for SPECpower and SPECweb, respectively. It has the least dynamic power range among all systems and subsystems at 15.58% for SPECpower and 5.86% for SPECweb.
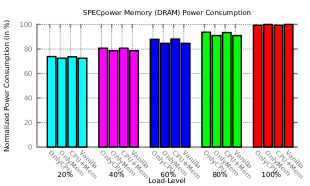
Memory (DRAM) Energy Proportionality
The memory subsystem has EP metric value of 0.36 for SPECpower and 0.07 for SPECweb. In case of SPECweb, the memory power trend closely follows the uncore power trend which makes it less energy-proportional. This worse memory energy proportionality of the SPECweb benchmark can be attributed to the usage of RAMFS to house the data required by the web server. This subsystem idles at 60.80% and 82.62% for SPECpower and SPECweb.
To summarize, Table II describes our results on the energy proportionality analysis of full system and subsystems.
| Subsystem | Benchmark | EP Metric | Idle Power | Dynamic Power Range |
| Full System | SPECpower | 0.54 | 36.51 | 63.48 |
| SPECweb | 0.29 | 54.88 | 45.11 | |
| Package (PKG) | SPECpower | 0.70 | 21.55 | 78.44 |
| SPECweb | 0.44 | 34.47 | 65.52 | |
| Core (PP0 | SPECpower | 0.85 | 4.83 | 95.16 |
| SPECweb | 0.63 | 8.80 | 91.19 | |
| Uncore (Package-PP0) | SPECpower | 0.14 | 84.41 | 15.58 |
| SPECweb | 0.02 | 94.13 | 5.86 | |
| Memory (DRAM) | SPECpower | 0.36 | 60.80 | 39.19 |
| SPECweb | 0.07 | 82.62 | 17.37 |
4.1.5 Analysis of Load-Level Energy Proportionality
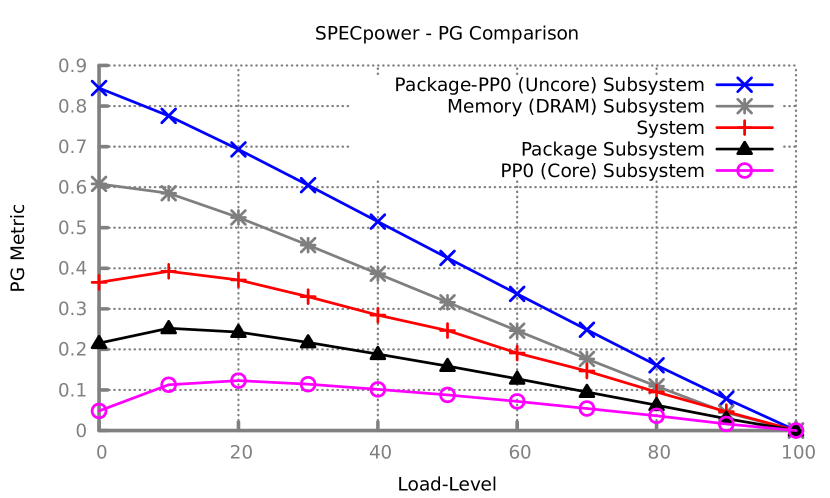
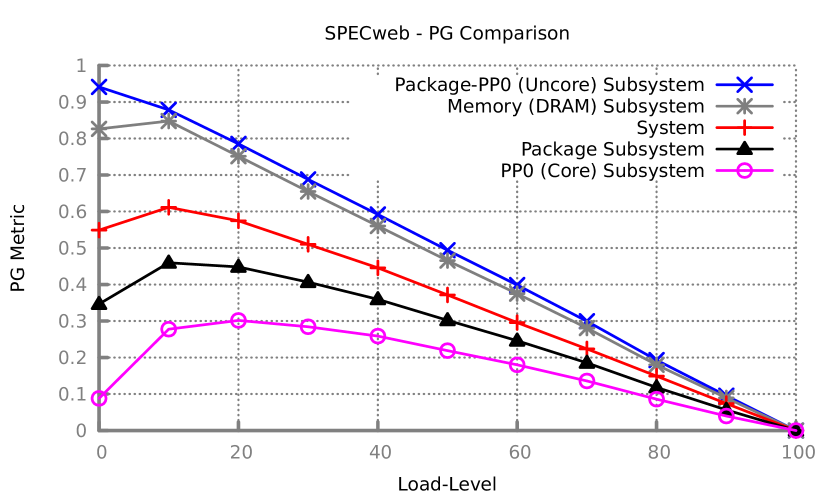
The PG metric allows us to look at the energy proportionality of a server at each load-level. Figure 4 shows the PG metric at each load-level for SPECpower and SPECweb benchmarks. Similar to EP metric, the uncore and core subsystem have the worst and best PG metric for all load-levels for both the benchmarks. The uncore subsystem’s PG increases linearly from 100 to 0 percent load-level which again shows that the subsystem’s power remains a constant irrespective of the load-level. In case of the PP0 subsystem, there is an increase in PG metric when load-level increases from 0 to 10 percent. This trend shows that the energy proportionality gap at 0% load is better than low utilization levels for both the benchmarks. The proportionality gap becomes better than 0% load-level only at 70% and 80% load-level for SPECpower and SPECweb benchmarks, respectively, for the PP0 subsystem. Such trends can be seen for Package subsystem and full system as well.
In summary, core is the most energy-proportional and the uncore is the least energy-proportional subsystem.
4.1.6 Analysis of Linear Deviation
Table III shows the LD metric for both benchmarks at each RAPL domain and full system. The LD metric for all subsystems is always positive as none of them have a sub-linear energy proportionality trend. This observation also provides evidence that there is opportunity to improve the energy proportionality by improving (i.e., decreasing) LD metric.
| Subsystem | Benchmark | LD Metric |
|---|---|---|
| Full System | SPECpower | 0.067 |
| SPECweb | 0.101 | |
| Package (PKG) | SPECpower | 0.066 |
| SPECweb | 0.151 | |
| Core (PP0 | SPECpower | 0.095 |
| SPECweb | 0.254 | |
| Uncore (Package-PP0) | SPECpower | 0.004 |
| SPECweb | 0.019 | |
| Memory (DRAM) | SPECpower | 0.013 |
| SPECweb | 0.053 |
5 An Analysis of Instantaneous Power Consumption
Here we present our results for the instantaneous power profile analysis of the SPECpower and SPECweb benchmarks. Our main goal is to visualize the opportunities for power limiting. We collected instantaneous power profile for five load-levels.
5.1 Methodology
Our results are shown as cumulative distribution functions (CDFs). The CDFs present the percentage of time spent at or below a given percentage of the maximum power limit possible. We refer the reader to Table I for the maximum power limit possible for each subsystem. We collect the instantaneous power profile of the package and memory subsystems at 50 ms resolution. The results are normalized to their respective maximum power limit possible.
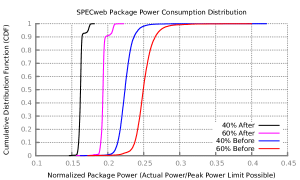
5.2 Instantaneous Power Analysis for Package (PKG) Subsystem
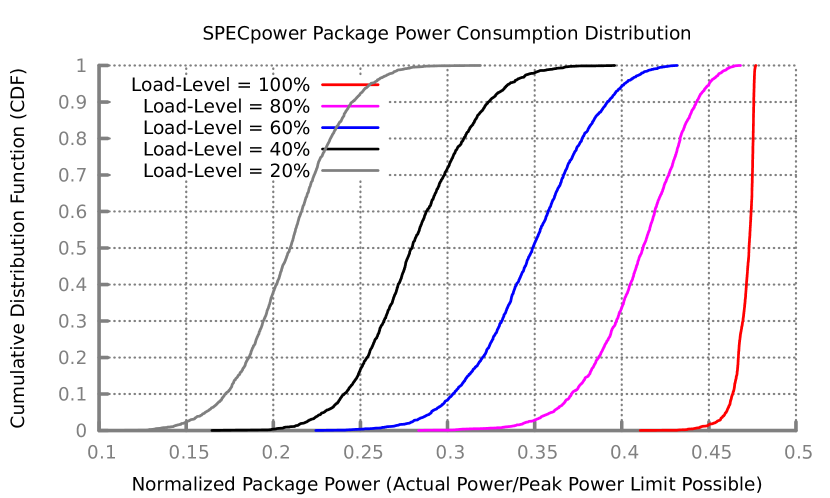
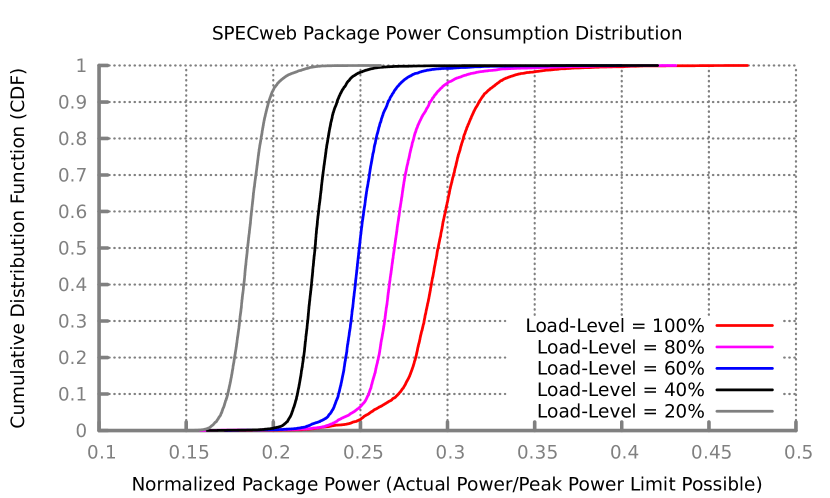
Figures 5 and 6 show the instantaneous power consumption for package subsystem for five different load-levels of SPECpower and SPECweb. We observe that the maximum power consumed by 100% load-level of SPECpower as indicated by its CDF is lower than 0.5 normalized power. This indicates that the maximum power consumed while executing SPECpower is less than 50% of maximum power limit possible. This upper limit for package power consumption for the SPECweb benchmark is also less than 50% of the maximum power limit possible. The lowest point in the CDF of each workload corresponds to the minimum power consumed. At no point during the execution of that load-level, the subsystem consumes lesser power. For example, 100% and 60% load-levels of SPECpower do not consume less than 40% and 20% of normalized power respectively. The shape of the curves indicate that each load-level spends most of the time consuming a narrow range of power. For instance in case of SPECpower, 80% load-level spends most of the time consuming power between 34% and 46% of maximum power limit possible. For both the benchmarks, we will benefit by removing the relatively few intervals (indicated by the flat lines at 100%) where the workload has a power spike. Power limiting can help in such cases to remove these few intervals. We also observe that the power range decreases with increase in load-level. In case of SPECpower, 100% load-level has a power range from 0.40 to 0.50 of the normalized power whereas 20% load-level has a power range from 0.10 to 0.32 of the normalized power.
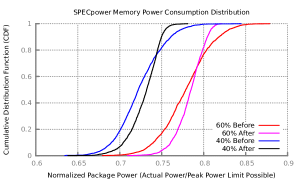
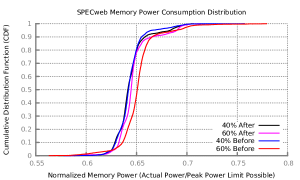
5.3 Instantaneous Power Analysis for Memory (DRAM) Subsystem
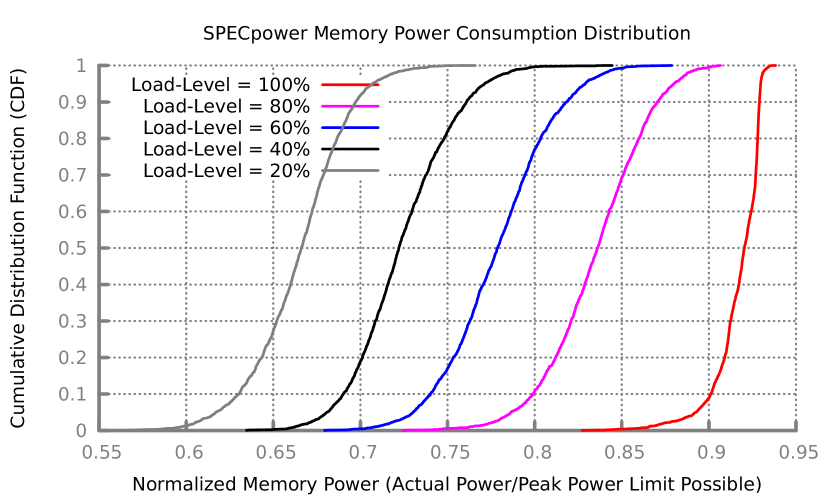
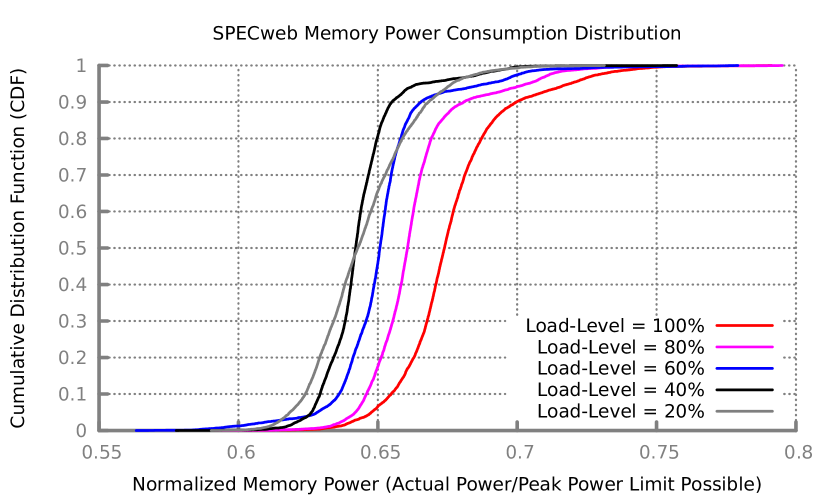
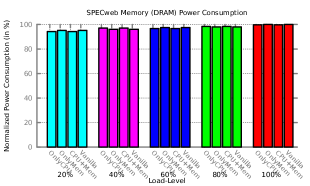
Figures 7 and 8 describe the instantaneous power consumption for memory subsystem for five different load-levels of SPECpower and SPECweb respectively. We observe CDF curves similar to package subsystem for both the benchmarks. Minimum normalized power consumed at each load-level is higher than the corresponding observation for package subsystem. This is an expected behavior as memory subsystem idles at a higher percentage of peak power than the package subsystem (see Table II). Similar to package subsystem, each load-level spends most of the time consuming a narrow range of power. The 100% load-level for SPECpower consumes 87 to 93 percent of peak power limit possible leaving lesser opportunity for memory power management than other load-levels. The memory power consumption for the SPECweb benchmark is more narrower than SPECpower as all load-levels of SPECweb consume power between 55 to 80 percent of the peak power limit possible. In general, there is less opportunity to limit the power consumption of memory than the package subsystem.
In summary, there is opportunity to limit the power consumption of SPECpower and SPECweb at different load-levels below the 50-ms resolution for the package and DRAM subsystems.
6 Efficacy of Power Limiting
In this section, we discuss the effects of power limiting on the performance and power of SPECpower and SPECweb benchmarks. Specifically, we investigate whether we can achieve energy-proportional operation for these benchmarks by leveraging the RAPL interfaces. Through our experiments, we show that most of the power savings comes from the PP0 domain and memory subsystem power limiting contributes the least to achieving power savings.
6.1 Methodology
We run both the SPECpower and SPECweb benchmarks at five different load-levels (from 20% to 100% in steps of 20) under power limit. Our experiments focus on PP0 and DRAM power limiting. We don’t focus on processor package power limiting as the uncore subsystem does not contribute to power savings at any load-level and all the power savings came from the PP0 domain while we experimented with processor package power limiting [22]. Our experiments present results for three different power limiting scenarios:
-
•
CPUOnly policy: Performance under only PP0 subsystem power limit.
-
•
MemOnly policy: Performance under only DRAM subsystem power limit.
-
•
CPU+Mem policy: Performance under PP0 and DRAM subsystem power limits.
In our experiments, we manually configure the power limit using RAPL interfaces. For the CPUOnly and MemOnly policies, we manually set 15 different power limits below the average power consumption of the corresponding subsystem. These 15 different power limits start from the average power consumption to 28 watts less than average power consumption at steps of 2 watt each. For the CPU+Mem policy we look at all possible power limits for a total of 225 combinations for each load-level. In this paper, we only present the best possible power savings without performance degradation for the benchmarks. We only present runs which achieve performance within 1% of target load-level for SPECpower. In case of SPECweb, we present results which achieve the target load-level and maintain TIME_GOOD and TIME_TOLERABLE constraints (see Section 3). We also use the least possible value as the time window for power limiting (i.e., 976 microseconds).
6.2 Impact of Power Limiting
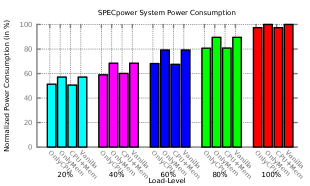
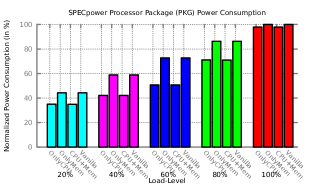
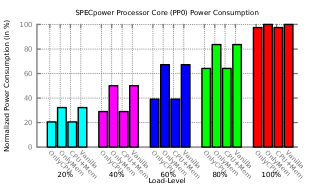
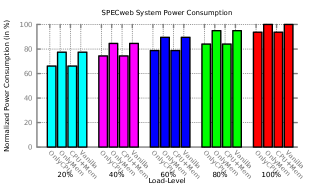
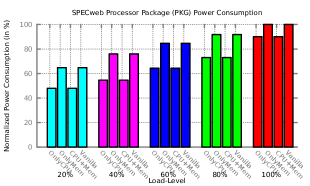
Figure 9 shows the normalized power consumption of five different load-levels of SPECpower. The values are normalized against the power consumption at 100% load-level vanilla run. We show the power consumption for the full system (top left) and processor package (top right), PP0 (bottom left) and DRAM (bottom right) subsystems. Such representation of the power consumption allows to identify whether we achieve energy proportionality at a particular load-level.
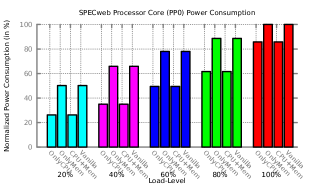
We observe that we achieve energy proportionality for the full system only for 100% and 80% load-levels. However, power limiting reduces the power consumption for other load-levels even though we are not able to achieve energy-proportional operations. We would like to emphasize that the system consumes 36.51% of peak power even when idling. The CPU+Mem and CPUOnly policies achieves the best power consumption. The MemOnly policy achieves negligible power consumption reduction. In case of processor package power consumption, we are able to achieve energy-proportional operation for all loads-levels except 20% load-level. Moreover, the reduction in power consumption is more when compared to the full system. This is an expected outcome as we only have power limiting control over processor package, PP0 (which is a part of processor package) and DRAM subsystems. Through power limiting, we achieve energy-proportional operation for all load-levels when we look at PP0 domain in isolation. As mentioned earlier, we achieve negligible power reduction from the DRAM subsystems while meeting the performance constraints of the benchmarks. In case of the subsystems, the different power limiting policies have same effect as seen for the full system (i.e., using CPU+Mem and CPUonly results in best possible power reduction whereas using MemOnly results in negligible power savings).
Figure 10 shows the normalized power consumption of five different load-levels of SPECweb benchmark. Similar to SPECpower, we show the power consumption for the full system (top left) and processor package (top right), PP0 (bottom left) and DRAM (bottom right) subsystems. We achieve energy-proportional operation only for 100% load-level in case of SPECweb. Similar to SPECpower, we however achieve power savings for other load-levels. The power reduction for SPECweb is less than power reduction seen for SPECpower as SPECpower is more energy-proportional than SPECweb (see Section 4). We would also like to stress that the SPECweb benchmarks idles at 54.88% of its peak power. When looking at the processor package power consumption in isolation, we are able to achieve energy-proportional operation for 100% and 80% load-levels. PP0 domain provides the highest power reduction and achieves energy-proportional operation for all load-levels except 20% load-level. The memory subsystem does not contribute much to the power reduction. CPU+Mem and CPUOnly policies provide the best power reduction possible.
Table IV shows the EP metric for the configuration which achieves best power savings of the SPECpower and SPECweb benchmarks. We see components with EP metric 1 indicating that we are operating at better than energy-proportional trade-off points. As expected, the EP metric for the PP0 subsystem has seen a substantial increase. For the PP0 domain, the metric increases from 0.85 to 1.18 and 0.63 to 1.12 for the SPECpower and SPECweb benchmarks respectively. The memory and the uncore subsytem does see any significant EP metric improvement.
| Subsystem | Benchmark | EP Metric | LD Metric |
|---|---|---|---|
| Full System | SPECpower | 0.69 | -0.044 |
| SPECweb | 0.48 | -0.024 | |
| Package (PKG) | SPECpower | 0.96 | -0.1490 |
| SPECweb | 0.79 | -0.101 | |
| Core (PP0 | SPECpower | 1.18 | -0.221 |
| SPECweb | 1.12 | -0..192 | |
| Uncore (Package-PP0) | SPECpower | 0.16 | 0.004 |
| SPECweb | 0.03 | 0.019 | |
| Memory (DRAM) | SPECpower | 0.37 | 0.013 |
| SPECweb | 0.09 | 0.045 |
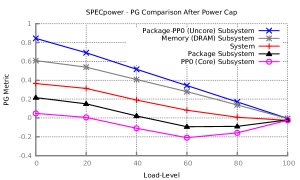
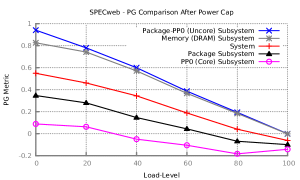
Figure 11 shows the PG metric for the configuration which achieve best power savings. For the Package and PP0 subsystems, the PG metrics is negative for some load-levels suggesting that we achieve better than energy-proportional operation. As observed both memory and uncore subsystem are not amenable to operating at different power performance trade-off points as the PG metric trend decrease linearly for those subsystems.
Table IV also shows the LD metric for the best power savings run. We are able to shift the linear deviation from positive to negative for the full system, Package and PP0 subsystems. Our approach improves the energy proportionality of the server by improving the linear deviation of subsystems.
6.3 Power Savings
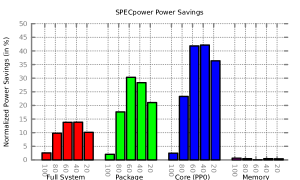
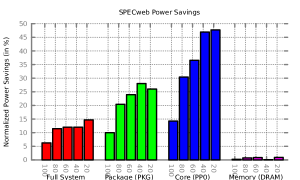
Figure 12 shows the power savings for the SPECpower (left) and SPECweb (right) benchmarks. Power limiting conserves between 3% to 15% of power at the full system-level. We would like to stress that the subsystems over which we don’t have power limiting control consume between 11% and 17% power of the full system depending upon the load-level. The power savings at 100% load-level for SPECpower is less than SPECweb as the former is a CPU-intensive benchmark and most of our power savings come from the PP0 domain. We observe that the memory subsystems provides negligible power savings. In case of PP0 domain we conserve between 3% and 30% for SPECpower and 14% to 45% for SPECweb depending upon the load-level.
6.4 Impact on Energy Efficiency
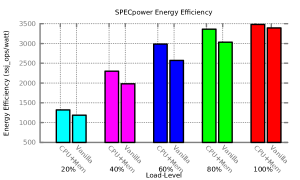
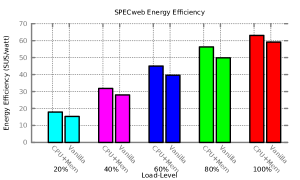
Figure 13 shows the energy efficiency of SPECpower and SPECweb at five different load-levels for the CPU+Mem and vanilla runs. The energy efficiency of SPECweb and SPECpower are represented as ssj_ops/watt and SUS/watt respectively. The improvement is calculated as the ratio of difference between the energy efficiency under power limit and vanilla run over the vanilla run. We achieve energy efficiency improvements in all cases. SPECpower and SPECweb achieve up to 16 and 17 percent energy efficiency improvement, respectively, due to power limiting.
6.5 Impact on Instantaneous Power Consumption
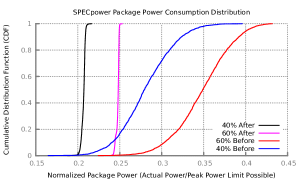
Over-provisioning leads to the wasting of infrastructure resources, and the maximum instantaneous power consumed by the subsystems is an important factor in determining the power budget for a system. Determining the optimal power provisioning strategy requires an understanding of the instantaneous power profile of the system. Towards this end, the instantaneous power profile is discussed in this section. We describe the difference in instantaneous power profile between two different load-levels (40 and 60 percent) with and without power cap for both SPECpower and SPECweb benchmarks. The instantaneous power profile for the configuration which achieved best power savings is shown. The power profile of the package and memory subsystems is collected at 50 ms resolution in all cases.
Figures14 and 15 show the instantaneous power profile of the package subsystem at 40 and 60 percent load-level with and without the power cap for SPECpower and SPECweb respectively. Power limiting works as expected for both SPECpower and SPECweb benchmarks. The range of instantaneous power consumption is narrowed due to power capping. Moreover, the power limiting removes the relatively few power spikes indicated by the flat lines at 100% (see Section 5). Such power limiting mechanisms are useful for power provisioning without impacting the performance of the application.
Figures 16 and 17 show the instantaneous power profile of the memory subsystem at 40 and 60 percent load-level with and without the power cap for both the benchmarks. The relatively few power spikes in the memory subsystem for both the benchmarks are removed due to power limiting. Even though we don’t achieve considerable power savings at the memory subsystem-level due to power limiting, applying appropriate power limits such that the impact on performance is controlled at desirable level can help make power provisioning decisions and increase the efficiency of the server.
7 Related Work
7.1 Energy-Proportional Operation For Enterprise Class Workloads
Wong et al. [25] provide an architecture for improving the energy proportionality using server-level heterogeneity. They combine a high-power compute node with a low-power processor essentially creating two different power-performance operation regions. They save power by redirecting requests to the low-power processor at low request rates thereby improving energy proportionality. Our work looks at improving the energy proportionality of traditional servers by improving the subsystem-level energy proportionality using RAPL interfaces.
Meisner et al. [13] characterize online data-intensive services (OLDI) to identify opportunities for power management, design a framework that predicts the performance of OLDI workloads and investigate the power and performance trade-offs using their simulation framework. Fan et al. [6] investigate the benefits of energy-proportional systems in improving the efficiency of power provisioning using their power models. They provide evidence that energy-proportional systems will enable improved power-capping at the data-center level. In contrast, we look at leveraging the power-capping mechanism to achieve energy-proportional operation for SPECpower and SPECweb.
Tolia et al. [23] proposed that by migrating workloads from under-utilized systems to other systems and turning the under-utilized systems off, energy proportionality can be approximated at an ensemble-level (i.e., for a group of nodes or rack-level). They used virtual machine (VM) migration as a software mechanism to move workloads off of under-utilized systems. In this paper, we use user-defined and hardware-enforced power limiting to achieve energy-proportional systems at the node-level.
7.2 Subsystem-level Power Management
Deng et al. [4] propose the CoScale framework which dynamically adapts the frequency of the CPU and memory respecting a certain application performance degradation target. They also take per-core frequency settings into account [5]. Li et al. [11] study the CPU microarchitectural adaptation and memory low power states to reduce energy consumption of applications bounding the performance loss by using a slack allocation algorithm. Our paper deals with subsystem-level power management on a real system.
7.3 Power Limiting
Several mechanisms to cap the power consumption of the system have been studied [2, 7]. However, we study the use of RAPL power limiting which is hardware-enforced in this paper. David et al. [3] proposed RAPL and evaluated RAPL for the memory sub-system. They present a model that accurately predicts the power consumed by the DIMMs and use RAPL to cap the power consumption. Rountree et al. [14] use RAPL power limiting to study the behavior of performance for benchmarks in the NAS parallel benchmark suite. Specifically, they are interested in the performance of various compute nodes under a power bound. Weaver et al. [24] have have exposed RAPL energy meters through PAPI. We use RAPL interfaces to achieve energy-proportional operation for SPECpower and SPECweb benchmarks and to the best of our knowledge, there is no previous study on using RAPL interfaces for enterprise class server workloads.
8 Conclusion
The management of power and energy is a key issue for data centers. Efficient power management of enterprise-class server workloads have the potential to greatly reduce energy-related costs and facilitate efficient power provisioning.
Energy proportionality holds the potential to significantly improve the energy efficiency of data centers. Consequently, in this paper, we investigate the potential of achieving energy proportionality for SPECpower and SPECweb benchmarks using RAPL interfaces. Our study sheds light on the mechanisms for power management of enterprise-class server workloads and the efficacy of RAPL interfaces. We identify the least and most energy-proportional subsystem using the on-chip energy meters. We then characterize the instantaneous power profile of these benchmarks to identify if there is any opportunity to limit the power consumption of these benchmarks. Finally, we present our results on the impact of power limiting on the power, performance and energy efficiency of SPECpower and SPECweb benchmarks. Our results show that we are able to achieve power savings of up to 15%.
Appendix A SPECpower Batch Size has No Effect on Power Consumption
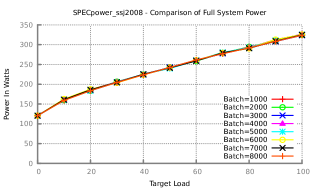
Figure 18 shows the average power consumption of SPECpower benchmark at different load-levels. For full-system power measurement, we have followed the power measurement methodology specified and developed by the SPEC organization for the SPECpower benchmark [19]. The figure also shows the effect of changing the batch sizes in SPECpower. We wanted to quantify this effect as batching queries to exploit and create opportunities for power management is a well-researched area [12]. The number of transactions in each batch scheduled in SPECpower benchmark is calibrated using the input.scheduler.batch_size input parameter. We use eight different batching sizes from 1000 to 8000 in steps of 1000. Each data presented is the average of 10 runs. The standard deviation for the power consumed during the runs were less than 2% of the mean.
Our results shed light on the repeatability of our experiments and the consistency of SPECpower benchmark. We observe that the lines in the plot overlap each other. Based on our experiments, the batch sizes have minimal to no effect on the power consumed by the benchmark. Similarly, changing batch sizes did not have any effect on the power consumption of subsystems (i.e., package, core and memory) as well.
Appendix B SPECweb at 13000 SUS is Network-Intensive
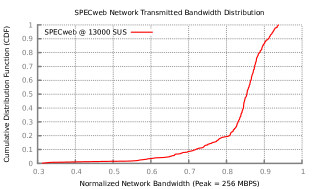
Figure 19 shows the cumulative distribution function (CDF) for the transmitted network bandwidth while running SPECweb at 13000 SUS. This CDF presents the percentage of total time where the transmitted bandwidth was either at or below a certain percentage of peak bandwidth possible. In our case the peak bandwidth is 256 megabytes per seconds (MBPS) due to the bonded Ethernet connection on the testbed (see Section 3). We monitor the network bandwidth using the sar utility at a resolution of one second. We observe that the SPECweb benchmark at 13000 SUS is networking intensive. The benchmark spends 80% of the time consuming more than 80% of the network bandwidth. Moreover, it spends 50% of time consuming more than 85% of the network bandwidth. Through our experiments we also found that the system under test was not able to meet the response time constraints when we increased the SUS beyond 13000. Hence, our experiments use 13000 SUS as 100% load-level for SPECweb.
References
- [1] L. A. Barroso and U. Hölzle. The Case for Energy-Proportional Computing. IEEE Computer, 40(12):33–37, 2007.
- [2] R. Cochran, C. Hankendi, A. K. Coskun, and S. Reda. Pack & Cap: Adaptive DVFS and Thread Packing Under Power Caps. In Proc. of the Int’l Symp. on Microarchitecture, MICRO-44, pages 175–185, 2011.
- [3] H. David, E. Gorbatov, U. R. Hanebutte, R. Khanna, and C. Le. RAPL: Memory Power Estimation And Capping. In Proceedings of the International Symposium on Low Power Electronics and Design, ISLPED, pages 189–194, 2010.
- [4] Q. Deng, D. Meisner, A. Bhattacharjee, T. F. Wenisch, and R. Bianchini. CoScale: coordinating CPU and memory system DVFS in server systems. In Proceedings of the International Symposium on Microarchitecture, MICRO, 2012.
- [5] Q. Deng, D. Meisner, A. Bhattacharjee, T. F. Wenisch, and R. Bianchini. MultiScale: memory system DVFS with multiple memory controllers. In Proceedings of the International Symposium on Low Power Electronics and Design, ISLPED, 2012.
- [6] X. Fan, W.-D. Weber, and L. A. Barroso. Power Provisioning For a Warehouse-Sized Computer. In Proceedings of the International Symposium on Computer Architecture, ISCA, 2007.
- [7] A. Gandhi, M. Harchol-Balter, R. Das, J. Kephart, and C. Lefurgy. Power Capping Via Forced Idleness. In Proceedings of Workshop on Energy-Efficient Design, WEED, 2009.
- [8] C. Hsu and W. Feng. A Power-Aware Run-Time System for High-Performance Computing. In Proceedings of the SC Conference, 2005.
- [9] Intel. Intel Xeon Processor E5-2600 Product Family Uncore Performance Monitoring Guide, 2012. Available at http://www.intel.com/content/dam/www/public/us/en/documents/design-guid%es/xeon-e5-2600-uncore-guide.pdf.
- [10] Intel. Intel 64 and IA-32 Software Developer Manuals - Volume 3, 2013. Available at www.intel.com/content/www/us/en/processors/architectures-software-devel%oper-manuals.html.
- [11] X. Li, R. Gupta, S. V. Adve, and Y. Zhou. Cross-Component Energy Management: Joint Adaptation of Processor and Memory. ACM Transactions on Architecture and Code Optimization, 2007.
- [12] D. Meisner, B. T. Gold, and T. F. Wenisch. PowerNap: Eliminating Server Idle Power. In Proceedings of International Conference on Architectural Support for Programming Languages and Operating Systems, ASPLOS, 2009.
- [13] D. Meisner, C. M. Sadler, L. A. Barroso, W.-D. Weber, and T. F. Wenisch. Power Management of Online Data-Intensive Services. In Proceedings of the International Symposium on Computer Architecture, ISCA, pages 319–330, 2011.
- [14] B. Rountree, D. Ahn, B. de Supinski, D. Lowenthal, and M. Schulz. Beyond DVFS: A First Look at Performance Under a Hardware-Enforced Power Bound. In Proc. of the Int’l Parallel and Distributed Processing Symp. Workshops and PhD Forum, IPDPSW, pages 947–953, 2012.
- [15] B. Rountree, D. K. Lownenthal, B. R. de Supinski, M. Schulz, V. W. Freeh, and T. Bletsch. Adagio: Making DVS Practical For Complex HPC Applications. In Proc. of the Int’l Conf. on Supercomputing, ICS, pages 460–469, 2009.
- [16] F. Ryckbosch, S. Polfliet, and L. Eeckhout. Trends in Server Energy Proportionality. IEEE Computer, (9):69–72, 2011.
- [17] D. C. Snowdon, S. M. Petters, and G. Heiser. Accurate On-line Prediction of Processor and Memory Energy Usage Under Voltage Scaling. In Proceedings of the International Conference on Embedded Software, EMSOFT, pages 84–93, 2007.
- [18] SPEC. SPECpower Benchmark, 2008. Available at http://www.spec.org/power_ssj2008.
- [19] SPEC. SPECpower Benchmark – Benchmarking Methodology, 2008. Available at http://www.spec.org/power/docs/SPEC-Power_and_Performance_Methodology.p%df.
- [20] SPEC. SPECpower Benchmark – Run Rules, 2008. Available at http://www.spec.org/power/docs/SPECpower_ssj2008-Run_Reporting_Rules.ht%ml.
- [21] SPEC. SPECweb2009 Benchmark – User Guide, 2009. Available at http://www.spec.org/web2009/docs/usersguide.html.
- [22] B. Subramaniam and W. Feng. Towards Energy-Proportional Computing for Enterprise-Class Server Workloads. In Proceedings of the International Conference on Performance Engineering, ICPE, 2013.
- [23] N. Tolia, Z. Wang, M. Marwah, C. Bash, P. Ranganathan, and X. Zhu. Delivering Energy Proportionality with Non Energy-Proportional Systems: Optimizing the Ensemble. In Proceedings of the Conference On Power Aware Computing and Systems, HotPower. USENIX Association, 2008.
- [24] V. Weaver, M. Johnson, K. Kasichayanula, J. Ralph, P. Luszczek, D. Terpstra, and S. Moore. Measuring Energy and Power with PAPI. In Int’l Workshop on Power-Aware Systems and Architectures, 2012.
- [25] D. Wong and M. Annavaram. KnightShift: scaling the energy proportionality wall through server-level heterogeneity. In Proceedings of the International Symposium on Microarchitecture, MICRO, 2012.
| Balaji Subramaniam is a Ph.D. student in Computer Science department at Virginia Tech. His research interests include energy-proportional computing, power modeling and prediction, hardware- and software-controlled power management, and benchmarking. |
| Wu-chun Feng is Professor and Elizabeth and James E. Turner Fellow of Computer Science at Virginia Tech. He received his Ph.D. in Computer Science from the University of Illinois at Urbana-Champaign in 1996. |