Crystal plasticity as a mean field depinning transition: results from a phase field crystal model
Abstract
Until now, most of our knowledge about the universality class of crystal plasticity has come from simulations using discrete dislocation dynamics. These are force-controlled, typically at zero temperature, and deal with the creation and annihilation of dislocations phenomenologically. In this work, we go beyond these limitations by using phase field crystal simulations in two dimensions at finite temperature to extract the avalanche statistics of a simulated crystal under constant shear velocity. In addition to the avalanche size and energy distributions we extract the avalanche duration distributions and power spectra. All exponents and scaling functions extracted here for the statics and dynamics of crystal plasticity, belong to the mean field elastic depinning universality class, confirming earlier findings based on discrete dislocation dynamics.
pacs:
62.20.F-, 61.72.Bb, 89.75.Da, 64.60.DeCrystal plasticity is in some sense a solid state analogue of fluid turbulence, with deformation at micro scales being both intermittent and spatially inhomogeneous Miguel et al. (2001a); Weiss et al. (2001); Richeton et al. (2005a); Richeton et al. (2006); Richeton et al. (2005b); Weiss et al. (2000); Weiss and Grasso (1997); Weiss (2003); Dimiduk et al. (2006); Zaiser (2006); Tsekenis et al. (2013). These phenomena have been captured realistically by a number of approaches, including discrete dislocation dynamics (DDD) models Miguel et al. (2001a); Zaiser et al. (2005); Miguel et al. (2001b); Laurson and Alava (2006); Csikor et al. (2007); Ispanovity et al. (2010); Tsekenis et al. (2011, 2013), continuum models Zaiser et al. (2005), phase field models Koslowski et al. (2004); Koslowski (2007) and phase field crystal (PFC) models Chan et al. (2010). The most prominent open question that remains unanswered is the one that unifies the accumulated literature and solidifies the hard-earned knowledge: What is the universality class of crystal plasticity?
A wealth of critical exponent and scaling function information from DDD simulations (in two Zaiser et al. (2005); Tsekenis et al. (2013) and three dimensions Csikor et al. (2007)) and experiments on slowly compressed nanocrystals and microcrystals Dimiduk et al. (2006); Friedman et al. (2012); Zaiser (2006) strongly suggest that crystal plasticity belongs to the mean field depinning universality class. Nevertheless the issue is by no means settled; for example recent DDD simulations in 2D obtained non-mean field results Ispanovity et al. (2014).
Our main aim in this paper is to uncover the universal behavior of deforming crystalline matter as it emanates from microscopic origins and percolates through all scales. To this end we study crystalline plasticity with a phase field crystal model Elder and Grant (2004); Elder et al. (2007); Chan et al. (2009, 2010). The elementary entity in our simulations is a phase field representing local atomic density, which is appropriately constrained to behave as an atomic crystal, and indeed can be related to density functional theoryElder et al. (2007). The phase field crystal exhibits elastic, reversible deformation at small external loads. It deforms plastically at exceedingly large external loads. Large deformations imprint permanent, irreversible change in the lattice structure. At sufficient shearing the periodicity is broken and topological defects emerge in the system. Dislocations travel and interact with each other through the lattice forming intricate structures. One can observe plastic deformation being mediated through intermittent dislocation motion, i.e. through discrete slip-avalanches. Here we extract several avalanche measures and show that they are distributed according to power-laws over several orders of magnitude revealing long range spatial and temporal correlations. The set of critical exponents we calculate (the duration distribution power law exponent for the first time) fully supports the mean field depinning picture for crystal plasticity. This is in strong agreement with earlier 2D DDD simulations Tsekenis et al. (2013). It also agrees with 3 dimensional simulations of dislocation dynamics Csikor et al. (2007), with analytics Dahmen et al. (2009a); Zaiser (2006) and experiments Friedman et al. (2012); Dimiduk et al. (2006); Zaiser (2006). Our work addresses the fundamental question of the universality class of crystal plasticity and is relevant to the deformation of nano-crystals Brinckmann et al. (2008); Jennings et al. (2010); Friedman et al. (2012) and micro-crystals Miguel et al. (2001a); Dimiduk et al. (2006); Zaiser (2006) as the need for miniaturization of devices expands both in breath and depth.
| quantity | exponent | DDD sims | our PFC sims | MFT | other sims | experiments |
|---|---|---|---|---|---|---|
| 1.5 Tsekenis et al. (2013) | 1.5 (Fig. 1) | 1.4Zaiser et al. (2005),1.6Miguel et al. (2001b),1.5Csikor et al. (2007)* | 1.5-1.6Dimiduk et al. (2006),1.5Brinckmann et al. (2008); Friedman et al. (2012) | |||
| 2 Tsekenis et al. (2013) | 2 | 2Zaiser et al. (2005),2Csikor et al. (2007)* | 2Zaiser et al. (2005); Friedman et al. (2012) | |||
| 2LeBlanc et al. (2012) | 1.8Koslowski et al. (2004); Koslowski (2007) | 2Weiss et al. (2001), Richeton et al. (2005b) | ||||
| ” | ” | 1.5-2Weiss and Grasso (1997),1.2-2.2Weiss et al. (2000) | ||||
| 2 (Fig. 1) | 2 | |||||
| 1 | ||||||
| 1.3 Tsekenis et al. (2013) | 1.3 (Fig. 1) | Miguel et al. (2001a)+ | Miguel et al. (2001a),Richeton et al. (2006) | |||
| 3 Tsekenis et al. (2013) | 3 | |||||
| Tsekenis et al. (2013) | 2 (Fig. 2) | 2 | 1.5Laurson and Alava (2006)+ | |||
| Tsekenis et al. (2013) | ||||||
| Tsekenis et al. (2013) | 2 | 1.5Laurson and Alava (2006)+ | ||||
| , | Tsekenis et al. (2013) | 2 (Fig. 2) | 2 | 1.5Laurson and Alava (2006)+ | ||
| Tsekenis et al. (2013) | 1 | |||||
| Tsekenis et al. (2013) | 1 | Miguel et al. (2002)+ |
The Phase Field Crystal Model, Sheared: The phase field crystal (PFC) model Elder et al. (2002); Elder and Grant (2004); Majaniemi and Grant (2007) describes how the local density of atoms changes with time while maintaining the symmetries and periodicity of the lattice. In addition, the elastic interactions of the atoms are also captured by the PFC allowing for the elasticity of the crystal to be expressed. These characteristic properties of the phase field crystal model are distinctly different from the phase field model. In a typical phase field model the phase field describes the dynamics of interfaces that separate dissimilar regions without keeping track of the microscopic information inside those regions. In Koslowski (2007); Koslowski et al. (2004) Koslowski et al. developed a phase field model to simulate dislocations as interfaces (separating crystal regions with different accumulated slip). In studying plasticity, however, it is important to capture the microscopic details such as the dislocations which disrupt the periodicity of the perfect lattice. At the same time, it is important to capture the macroscopic behavior as well such as the collective motion of the dislocation ensemble. The phase field crystal model is particularly successful in doing that in an elegant way Chan et al. (2010).
The total free energy in the phase field crystal (PFC) model Elder et al. (2002); Elder and Grant (2004)
| (1) |
is a functional of the local density of the phase field (at point in space and time ). The first term in Eq.(1) penalizes departures of from periodicity, thus describing a crystal structure as a density wave. The last two terms impose a double well potential (to lowest order) similar to the Landau ansatz. The reduced temperature is given by and controls the phase behavior. The material is liquid for temperatures higher than a critical temperature while it crystallizes for temperatures below . Thus, for one finds a liquid, constant , phase (because the potential is single well) while for the stable state is a triangular lattice or a striped phase (due to the double well potential).
The PFC density evolves according to the massive phase field crystal equation Stefanovic et al. (2006); Chan et al. (2010):
| (2) |
where controls the range and the time scale of phonon excitations of the crystal Stefanovic et al. (2006). Thermal fluctuations are represented by the stochastic noise which is assumed to be Gaussian with second moment given by the fluctuation-dissipation theorem . The noise amplitude sets the scale of temperature . This free energy is governed by conservative, relaxational, diffusive dynamics that can be derived from density-functional theory Majaniemi and Grant (2007).
The PFC solid is a perfect triangular lattice in equilibrium, but its excitations are phonons and topological defects such as dislocations. When the phase field crystal is sheared, it will respond by generating dislocations, just as a real crystal. The ability to create and annihilate dislocations naturally and easily is one of the advantages of the phase field crystal method, compared to DDD.
We applied a shear strain rate along the direction at the boundaries by adding the convection term , to the evolution equation Eq.(2). The boundary shear velocity profile, ( for , for ) is designed to be mainly controlled by the velocity at the boundary since its penetration length does not affect the results strongly. The simulations take place in a square box of sides , in the , direction. The boundary conditions are periodic in and fixed at i.e. we design the simulation cell such that the crystal wraps around in and terminates at (without wrapping around). That way we can easily apply a fixed shear rate at the boundaries and allow the dislocations to flow unbounded through the boundaries effectively simulating a larger thermodynamic system than the mere dimensions of our basic simulation cell.
The PFC model has the added value over DDD simulations that it incorporates nonlinear elasticity Chan and Goldenfeld (2009) as well as dislocation creation and annihilation seamlessly without requiring additional phenomenological rules to model these number-changing operations. The PFC methodology is thus uniquely capable of addressing such questions as how strain heterogeneity drives dislocation number fluctuations, which in turn couple to plasticity avalanches Tarp et al. (2014). Since the PFC model is in essence an atomic simulation, the highly nonlinear interaction at small dislocation distances is captured naturally through the crystal lattice that mediates it. The same holds true for the particular effects of creation and annihilation of dislocations.
The PFC model handles applied shear velocity natively. DDD models incorporate applied external stress naturally. Thus the PFC is suitable to investigate the slip avalanches above the critical point (flow stress) in the depinned state while the DDD below the critical point, in the pinned state. In that sense they perform complementarily to each other.
PFC simulations at Finite Shearing Rate and Temperature: We study crystal plasticity as it proceeds intermittently through slip avalanches using the sheared phase field crystal (PFC) model Chan et al. (2010). We obtain the main scaling behavior of the distribution of a variety of avalanche measures and for several different temperatures () and shearing rates (). We find remarkable agreement between simulations and analytical mean field theory predictions of exponents Zaiser (2006); Fisher (1998); Dahmen et al. (2009a). Our results strongly support the critical point picture of plasticity, and suggest new experiments.
At every time step we obtain the phase field density in a 2D square simulation cell (i.e. ) through Eq.(2). Large values of indicates PFC ‘atoms” while low field signifies interatomic space, cooperatively arranged into a tight crystal (triangular in 2D). By applying shear along the fixed boundaries the translational symmetry breaks and dislocations are created in an attempt to relieve the high stress accumulated near those boundaries. Once the dislocations are created, they interact with each other to form pairs and more complex structures such as low-angle grain boundaries; individual dislocations, dislocation pairs and grain boundaries can be seen in the snapshot of the PFC simulations in Supplementary Material. Dislocations may also glide throughout the entire crystal, allowing for slips to self-organize into slip avalanches. We quantify the avalanche activity by extracting the total speed of the dislocations,
| (3) |
where is the number of dislocations in the system at time and is the speed of the -th dislocation. This measure is similar to the acoustic emission signal in Weiss et al.’s single crystal ice experiments (e.g. Miguel et al. (2001a)). Other variants of the avalanche activity measure in the literature can track the avalanches as well. For example the collective dislocation velocity is defined as ( is the dislocation’s burgers vector) and represents the strain rate of the crystal Miguel et al. (2002); Zaiser et al. (2005); Zaiser (2006). Note that all dislocations, single dislocations or disclination pairs that move at high speeds and grain boundaries that move slowly, participate equally in the calculation of (see figure in Supplementary Material).
A perfect unsheared triangular crystal is devoid of dislocations and therefore every atom has nearest neighbors (identified with Delaunay triangulation). Conversely there exists one dislocation for every atom with or neighbors since vacancies are not allowed.
We capture the speed of the dislocations, , through the speed of these defect atoms with neighbors, , where is the number of defect atoms and is the velocity of defect atom .
In order to partition the signal into individual slip avalanches we apply a threshold, , to it for each temperature and shearing rate we simulate. The beginning of the avalanche is signified at an instant when the collective dislocation speed intersects upward the threshold while its end is when crosses the threshold downward immediately after. We extract the probability distribution of the avalanche duration
| (4) |
size (also called activity fluctuations in the flowing state) , and energy , where and are the starting and ending time of the event respectively. In order to see the fluctuations that correspond to slip avalanches we applied a threshold equal to the average of the signal, , in each realization of total time , , We also calculate the power spectrum of :
| (5) |
The power spectrum reveals the frequency content of the time series of the collective dislocation speed and it needs no thresholding. It is equivalent to extracting the time-time correlations of the collective dislocation behavior and near a critical point it is expected to have no characteristic scale, i.e. be scale-free Kuntz and Sethna (2000); Travesset et al. (2002).
For each shearing rate and temperature, we run different realizations each with different seed for the random number generator for the noise to obtain sufficient statistics. This results in tens of thousands of avalanche events for each shearing rate and temperature . In Fig. 1 we show the event size, duration and energy distributions while in Fig. 2 the power spectra and average size versus duration for different shearing rates at the same temperature. We find that the distributions follow a power law for small event sizes and cut off at larger sizes, with the maximum avalanche size not exhibiting a strong dependence on shear rate over the simulated range of the parameter . We suspect that the reason that shear rate does not affect the distribution much is that for our systems the system size sets the cutoff of the avalanche size distribution. For much larger systems the mean field theory predicts that an increase in shear rate will reduce the cutoff of the avalanche size distribution. This can only be seen in systems that are so large that the system size is much larger than the correlation length of the avalanches given by the finite shear rate. In previous work with PFC Chan et al. (2010) a different threshold was applied to the signal so as to extract avalanches. It resulted in a rate-dependent avalanche distribution cutoff. Although both thresholds reveal the same power-law in the avalanche distributions we believe the threshold used here (equal to the average of the dislocation activity for each run) is a more natural way to quantify the fluctuations around the mean dislocation activity.
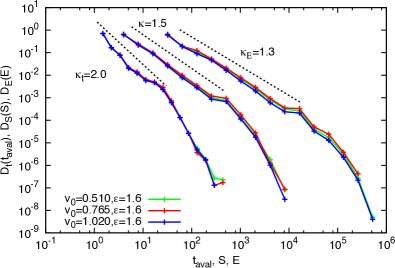
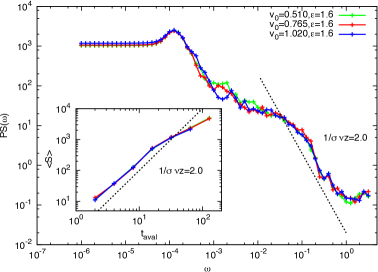
Scaling Behavior of the avalanches: The distributions of the avalanche size, duration and energy, the power spectra and average size versus duration shown at same shearing rate, , and different temperature parameter values are shown in figures in the Supplementary Material. In Figs. 1 and 2 we presented the distributions of the avalanche size, duration, energy, power spectra and average size versus duration at the same temperature parameter values and different shearing rates, . Each curve is characterized by a power law for several decades and a cutoff at large values (smaller values for the power spectra) which does not change with shear rate. Mean field theory predicts the dependence on the shear rate, that should be visible in larger simulations Dahmen et al. (2009b). The slip events distribute themselves according to power laws , , , , with critical exponents that are in agreement with the Mean Field interface depinning transition universality class (Table 1).
Our extended results from the PFC model agree with the majority of the robust experimental and computational results in the literature (for an extended summary see Table 1). Friedman et al. Friedman et al. (2012) analyzes the slip statistics of compressed crystalline nano-pillars in different stress bins as the flow stress is approached and get (also ). Dimiduk et al. measure from compression experiments on micro-pillars at slowly increasing stress Dimiduk et al. (2006). Similarly, in 2D DDD and continuum models with quasi-static stress increase in the pinned regime, Zaiser et al. calculate Zaiser et al. (2005); Zaiser and Nikitas (2007). Slip-event energy amplitudes are power law distributed with exponent Miguel et al. (2001a) in simulations, and in experiments Miguel et al. (2001a). Richeton et al. Richeton et al. (2006) report for the energy distribution of acoustic emission deformation experiments. Of course in Tsekenis et al. (2013) a large number of scaling exponents was extracted from 2D DDD simulations and as shown in Table 1 they corroborate that crystalline plasticity belongs to the universality class of mean field depinning for the discussed static and dynamic properties of the avalanche statistics. This result is also consistent with analytic results Dahmen et al. (2009a); Zaiser (2006) and simulations in 3 dimensions Csikor et al. (2007).
Discussion: We approach crystalline plasticity with a new and alternative simulation methodology: the phase field crystal model. The PFC simulations can essentially be thought of as molecular dynamics simulations but greatly sped up. At the same time they are free from the several phenomenological rules and constraints that discrete dislocation dynamics need in order to incorporate the variety of dynamical phenomena that take place in a stressed crystal. The reason is that the phase field crystal reproduces faithfully the real crystal including its elastic properties and topological behavior.
By employing this sheared PFC model we were successful in extracting the characteristic statistical scaling behavior of plastic deformation. We verified the robustness of the DDD simulations, nullified potential artifacts of the add-on phenomenological creation and annihilation rules of the DDD simulations and strengthened the universal conclusions. Our results reaffirm that all the exponents and scaling forms extracted here for crystal plasticity are consistent with the mean field interface depinning universality class – even in the absence of frozen-in pinning centers.
An increasing number of studies (including this work) have indicated the striking similarities between crystal plasticity and the interface depinning dynamic phase transition Zaiser (2006); Dahmen et al. (2009a); Tsekenis et al. (2013). The critical exponents we found here are in excellent agreement with the mean field theory of the interface depinning universality class (see Table 1) even though the PFC results are performed at finite temperature, , and as a result the extracted scaling relations are plagued by larger fluctuations (due to temperature-induced dislocation creep), when compared to DDD simulations at .
Acknowledgements: We thank Pak Yuen Chan, Jonathan Dantzig and Stefano Zapperi for helpful conversations. We acknowledge NSF grant DMR 03-25939 ITR (MCC) and DMR 10-05209, the University of Illinois Taub cluster.
References
- Miguel et al. (2001a) M.-C. Miguel, A. Vespignani, S. Zapperi, J. Weiss, and J. Grasso, Nature 410, 667 (2001a).
- Weiss et al. (2001) J. Weiss, J. R. Grasso, M.-C. Miguel, A. Vespignani, and S. Zapperi, Mater. Sci. Eng. A 309-310, 360 (2001).
- Richeton et al. (2005a) T. Richeton, J. Weiss, and F. Louchet, Nat. Mater. 4, 465 (2005a).
- Richeton et al. (2006) T. Richeton, P. Dobron, F. Chmelik, J. Weiss, and F. Louchet, Mater. Sci. Eng. A 424, 190 (2006).
- Richeton et al. (2005b) T. Richeton, J. Weiss, and F. Louchet, Acta Mat. 53, 4463 (2005b).
- Weiss et al. (2000) J. Weiss, F. Lahaie, and J. Grasso, J. Geo. Res, 105, 433 (2000).
- Weiss and Grasso (1997) J. Weiss and J. Grasso, J. Phys. Chem. B 101, 6113 (1997).
- Weiss (2003) J. Weiss, Surveys in Geophysics 24, 185 (2003).
- Dimiduk et al. (2006) D. Dimiduk, C. Woodward, R. LeSar, and M. Uchic, Science 312, 1188 (2006).
- Zaiser (2006) M. Zaiser, Advances in Physics 55, 185 (2006).
- Tsekenis et al. (2013) G. Tsekenis, J. T. Uhl, N. Goldenfeld, and K. A. Dahmen, EPL 101, 36003 (2013).
- Zaiser et al. (2005) M. Zaiser, B. Marmo, and P. Moretti, Proceedings of Science (Statistical Mechanics of Plasticity and Related Instabilities) 053 (2005).
- Miguel et al. (2001b) M.-C. Miguel, A. Vespignani, S. Zapperi, J. Weiss, and J. R. Grasso, Mater. Sci. Eng. A 309-310, 324 (2001b).
- Laurson and Alava (2006) L. Laurson and M. Alava, Phys. Rev. E 74, 066106 (2006).
- Csikor et al. (2007) F. F. Csikor, C. Motz, D. Weygand, M. Zaiser, and S. Zapperi, Science 318, 251 (2007).
- Ispanovity et al. (2010) P. D. Ispanovity, I. Groma, G. Gyorgyi, F. F. Csikor, and D. Weygand, Phys. Rev. Lett. 105, 085503 (2010).
- Tsekenis et al. (2011) G. Tsekenis, N. Goldenfeld, and K. A. Dahmen, Phys. Rev. Lett. 106, 105501 (2011).
- Koslowski et al. (2004) M. Koslowski, R. LeSar, and R. Thomson, Phys. Rev. Lett. 93 (2004).
- Koslowski (2007) M. Koslowski, Phil. Mag. 87, 1175 (2007).
- Chan et al. (2010) P. Y. Chan, G. Tsekenis, J. Dantzig, K. A. Dahmen, and N. Goldenfeld, Phys. Rev. Lett. 105, 015502 (2010).
- Friedman et al. (2012) N. Friedman, A. T. Jennings, G. Tsekenis, J.-Y. Kim, M. Tao, J. T. Uhl, J. R. Greer, and K. A. Dahmen, Phys. Rev. Lett. 109 (2012).
- Ispanovity et al. (2014) P. D. Ispanovity, L. Laurson, M. Zaiser, I. Groma, S. Zapperi, and M. Alava, Phys. Rev. Lett. (2014).
- Elder and Grant (2004) K. R. Elder and M. Grant, Phys. Rev. E 70, 051605 (2004).
- Elder et al. (2007) K. R. Elder, N. Provatas, J. Berry, P. Stefanovic, and M. Grant, Phys. Rev. B 75, 64107 (2007).
- Chan et al. (2009) P. Y. Chan, N. Goldenfeld, and J. Dantzig, Phys. Rev. E (R) 79, 035701:1 (2009).
- Dahmen et al. (2009a) K. A. Dahmen, Y. Ben-Zion, and J. Uhl, Phys. Rev. Lett. 102, 175501 (2009a).
- Brinckmann et al. (2008) S. Brinckmann, J.-Y. Kim, and J. R. Greer, Phys. Rev. Lett. 100, 155502 (2008).
- Jennings et al. (2010) A. T. Jennings, M. J. Burek, and J. R. Greer, Phys. Rev. Lett. 104, 135503 (2010).
- LeBlanc et al. (2012) M. LeBlanc, L. Angheluta, and N. Goldenfeld, Phys. Rev. Lett. 109 (2012).
- Miguel et al. (2002) M.-C. Miguel, A. Vespignani, M. Zaiser, and S. Zapperi, Phys. Rev. Lett. 89, 165501 (2002).
- Elder et al. (2002) K. R. Elder, M. Katakowski, M. Haataja, and M. Grant, Phys. Rev. Lett. 88, 245701 (2002).
- Majaniemi and Grant (2007) S. Majaniemi and M. Grant, Phys. Rev. B 75, 054301 (2007).
- Stefanovic et al. (2006) P. Stefanovic, M. Haataja, and N. Provatas, Phys. Rev. Lett. 96, 225504 (2006).
- Chan and Goldenfeld (2009) P. Y. Chan and N. Goldenfeld, Physical Review E 80, 65105 (2009).
- Tarp et al. (2014) J. M. Tarp, L. Angheluta, J. Mathiesen, and N. Goldenfeld, Phys. Rev. Lett. 113, 265503 (2014).
- Fisher (1998) D. S. Fisher, Physics Reports 301, 113 (1998).
- Kuntz and Sethna (2000) M. C. Kuntz and J. P. Sethna, Phys. Rev. B 62, 11699 (2000).
- Travesset et al. (2002) A. Travesset, R. A. White, and K. A. Dahmen, Phys. Rev. B 66, 024430 (2002).
- Dahmen et al. (2009b) K. A. Dahmen, Y. Ben-Zion, and J. T. Uhl, Nat. Phys. 7, 554 (2009b).
- Zaiser and Nikitas (2007) M. Zaiser and N. Nikitas, J. Stat. Mech. P04013 (2007).