Realizing strong light-matter interactions between single nanoparticle plasmons and molecular excitons at ambient conditions
Abstract
Realizing strong light-matter interactions between individual 2-level systems and resonating cavities in atomic and solid state systems opens up possibilities to study optical nonlinearities on a single photon level, which can be useful for future quantum information processing networks. However, these efforts have been hampered by unfavorable experimental conditions, such as cryogenic temperatures and ultrahigh vacuum, required to study such systems and phenomena. Although several attempts to realize strong light-matter interactions at room-temperature using plasmon resonances have been made, successful realizations on the single nanoparticle level are still lacking. Here, we demonstrate strong coupling between plasmons confined within a single silver nanoprism and excitons in molecular J-aggregates at ambient conditions. Our findings show that deep subwavelength mode volumes, , together with quality factors, , that are reasonably high for plasmonic nanostructures result in a strong coupling figure-of-merit – as high as m-3/2, a value comparable to state-of-art photonic crystal and microring resonator cavities. This suggests that plasmonic nanocavities, and specifically silver nanoprisms, can be used for room-temperature quantum optics.
pacs:
78.67.Bf, 71.35.-y, 73.20.Mf, 78.66.QnStrong light-matter interactions are not only interesting from a fundamental quantum optics point of view, e.g. for studying entanglement and decoherence, but also because of their relevance for high-end emerging applications such as quantum cryptography Lo and Chau (1999), quantum networks Tiecke et al. (2014), single atom lasers McKeever et al. (2003), ultrafast single photon switches Volz et al. (2012) and quantum information processing Imamoglu et al. (1999); Khitrova et al. (2006); Chang et al. (2014). These phenomena rely on a quantum emitter strongly interacting with a resonant cavity, which leads to cavity and emitter mode hybridization and vacuum Rabi splitting Hennessy et al. (2007). In the time domain, these strong light-matter interactions manifest themselves as a coherent exchange of energy between the cavity and the emitter occurring on timescales faster than both cavity and emitter dissipative dynamics – a situation that is dramatically different from irreversible spontaneous emission. Traditionally this kind of quantum optical phenomena have been studied in atomic Thompson et al. (1992); Aoki et al. (2006) and solid state systems Yoshie et al. (2004); Gröblacher et al. (2007); Faraon et al. (2008), which are associated with considerable experimental challenges such as ultrahigh vacuum, cryogenic temperatures, and fabrication issues.
A possible solution to these challenges could be to use noble metal nanoparticles instead of photonic crystal and microring resonator cavities Wu et al. (2010); Savasta et al. (2010); Manjavacas et al. (2011); Chen et al. (2013); Antosiewicz et al. (2014). This is because metal nanostructures can trap electromagnetic fields on subwavelength scales as so-called surface plasmon excitations. These plasmonic nanocavities possess a number of desirable properties, such as room temperature operation, deep subwavelength mode volumes and nanoscale dimensions that have been shown to lead to many remarkable phenomena including single-molecule Raman spectroscopy Kneipp et al. (1997); Nie and Emory (1997); Xu et al. (1999), tip-enhanced imaging Zhang et al. (2013), ultracompact nanolasers Noginov et al. (2009) and enhanced-fluorescence Kinkhabwala et al. (2009) to name a few. Despite these progresses, there has been considerably less success in achieving and demonstrating light-matter interactions in the strong coupling regime in these structures.
Most experiments aiming at realization of strong coupling utilize electronic excitations in a special kind of dye molecule aggregates, so-called J-aggregates, motivated by their exceptionally high oscillator strength and narrow resonances even at room temperature Würthner et al. (2010). Recent studies along these lines include a variety of macroscopic or ensemble type systems such as propagating surface plasmons in thin metal films, low-Q Fabry-Pérot resonators and various nanoparticle arrays or assemblies coupled to a large number of excitons Bellessa et al. (2004); Dintinger et al. (2005); Vasa et al. (2013); Schwartz et al. (2011); Balci (2013), as well as single nanoparticle measurements Uwada et al. (2007); Liu et al. (2007); Ni et al. (2010); Schlather et al. (2013); Zengin et al. (2013). However, to date there remain ambiguities in interpretation of the plasmon-exciton interactions in these structures Antosiewicz et al. (2014), which from the quantum optics perspective translates into uncertainty in the number of excitons involved in the coupling process as well as into a question of whether plasmonic nanocavities are at all capable of realizing strong light-matter interactions at its fundamental limit. These questions are crucial for potential quantum optics applications, since those require involvement of only a single exciton Hennessy et al. (2007); Gröblacher et al. (2007); Faraon et al. (2008).
Here we realized light-matter interaction in the strong coupling regime between plasmons confined within single isolated silver nanoprisms and molecular excitons in J-aggregates at ambient conditions (Fig. 1). Our observations were facilitated by the weakly radiating nature of the silver nanoprisms and their small mode volumes ( nm3). We found that the plasmon-exciton systems in our study exhibit -factors up to 20, splitting-to-damping ratios () as high as 1.5 and vacuum Rabi splitting up to 280 meV involving -85 excitons in the mode volume. Furthermore, our morphological and spectral measurements and analysis of a wide range of samples reveal complex spectral features as a result of diversity of silver nanoprisms and inhomogeneous distribution of J-aggregates around the nanostructures, including almost 100% transparency dips and distinct Fano shaped scattering spectra.
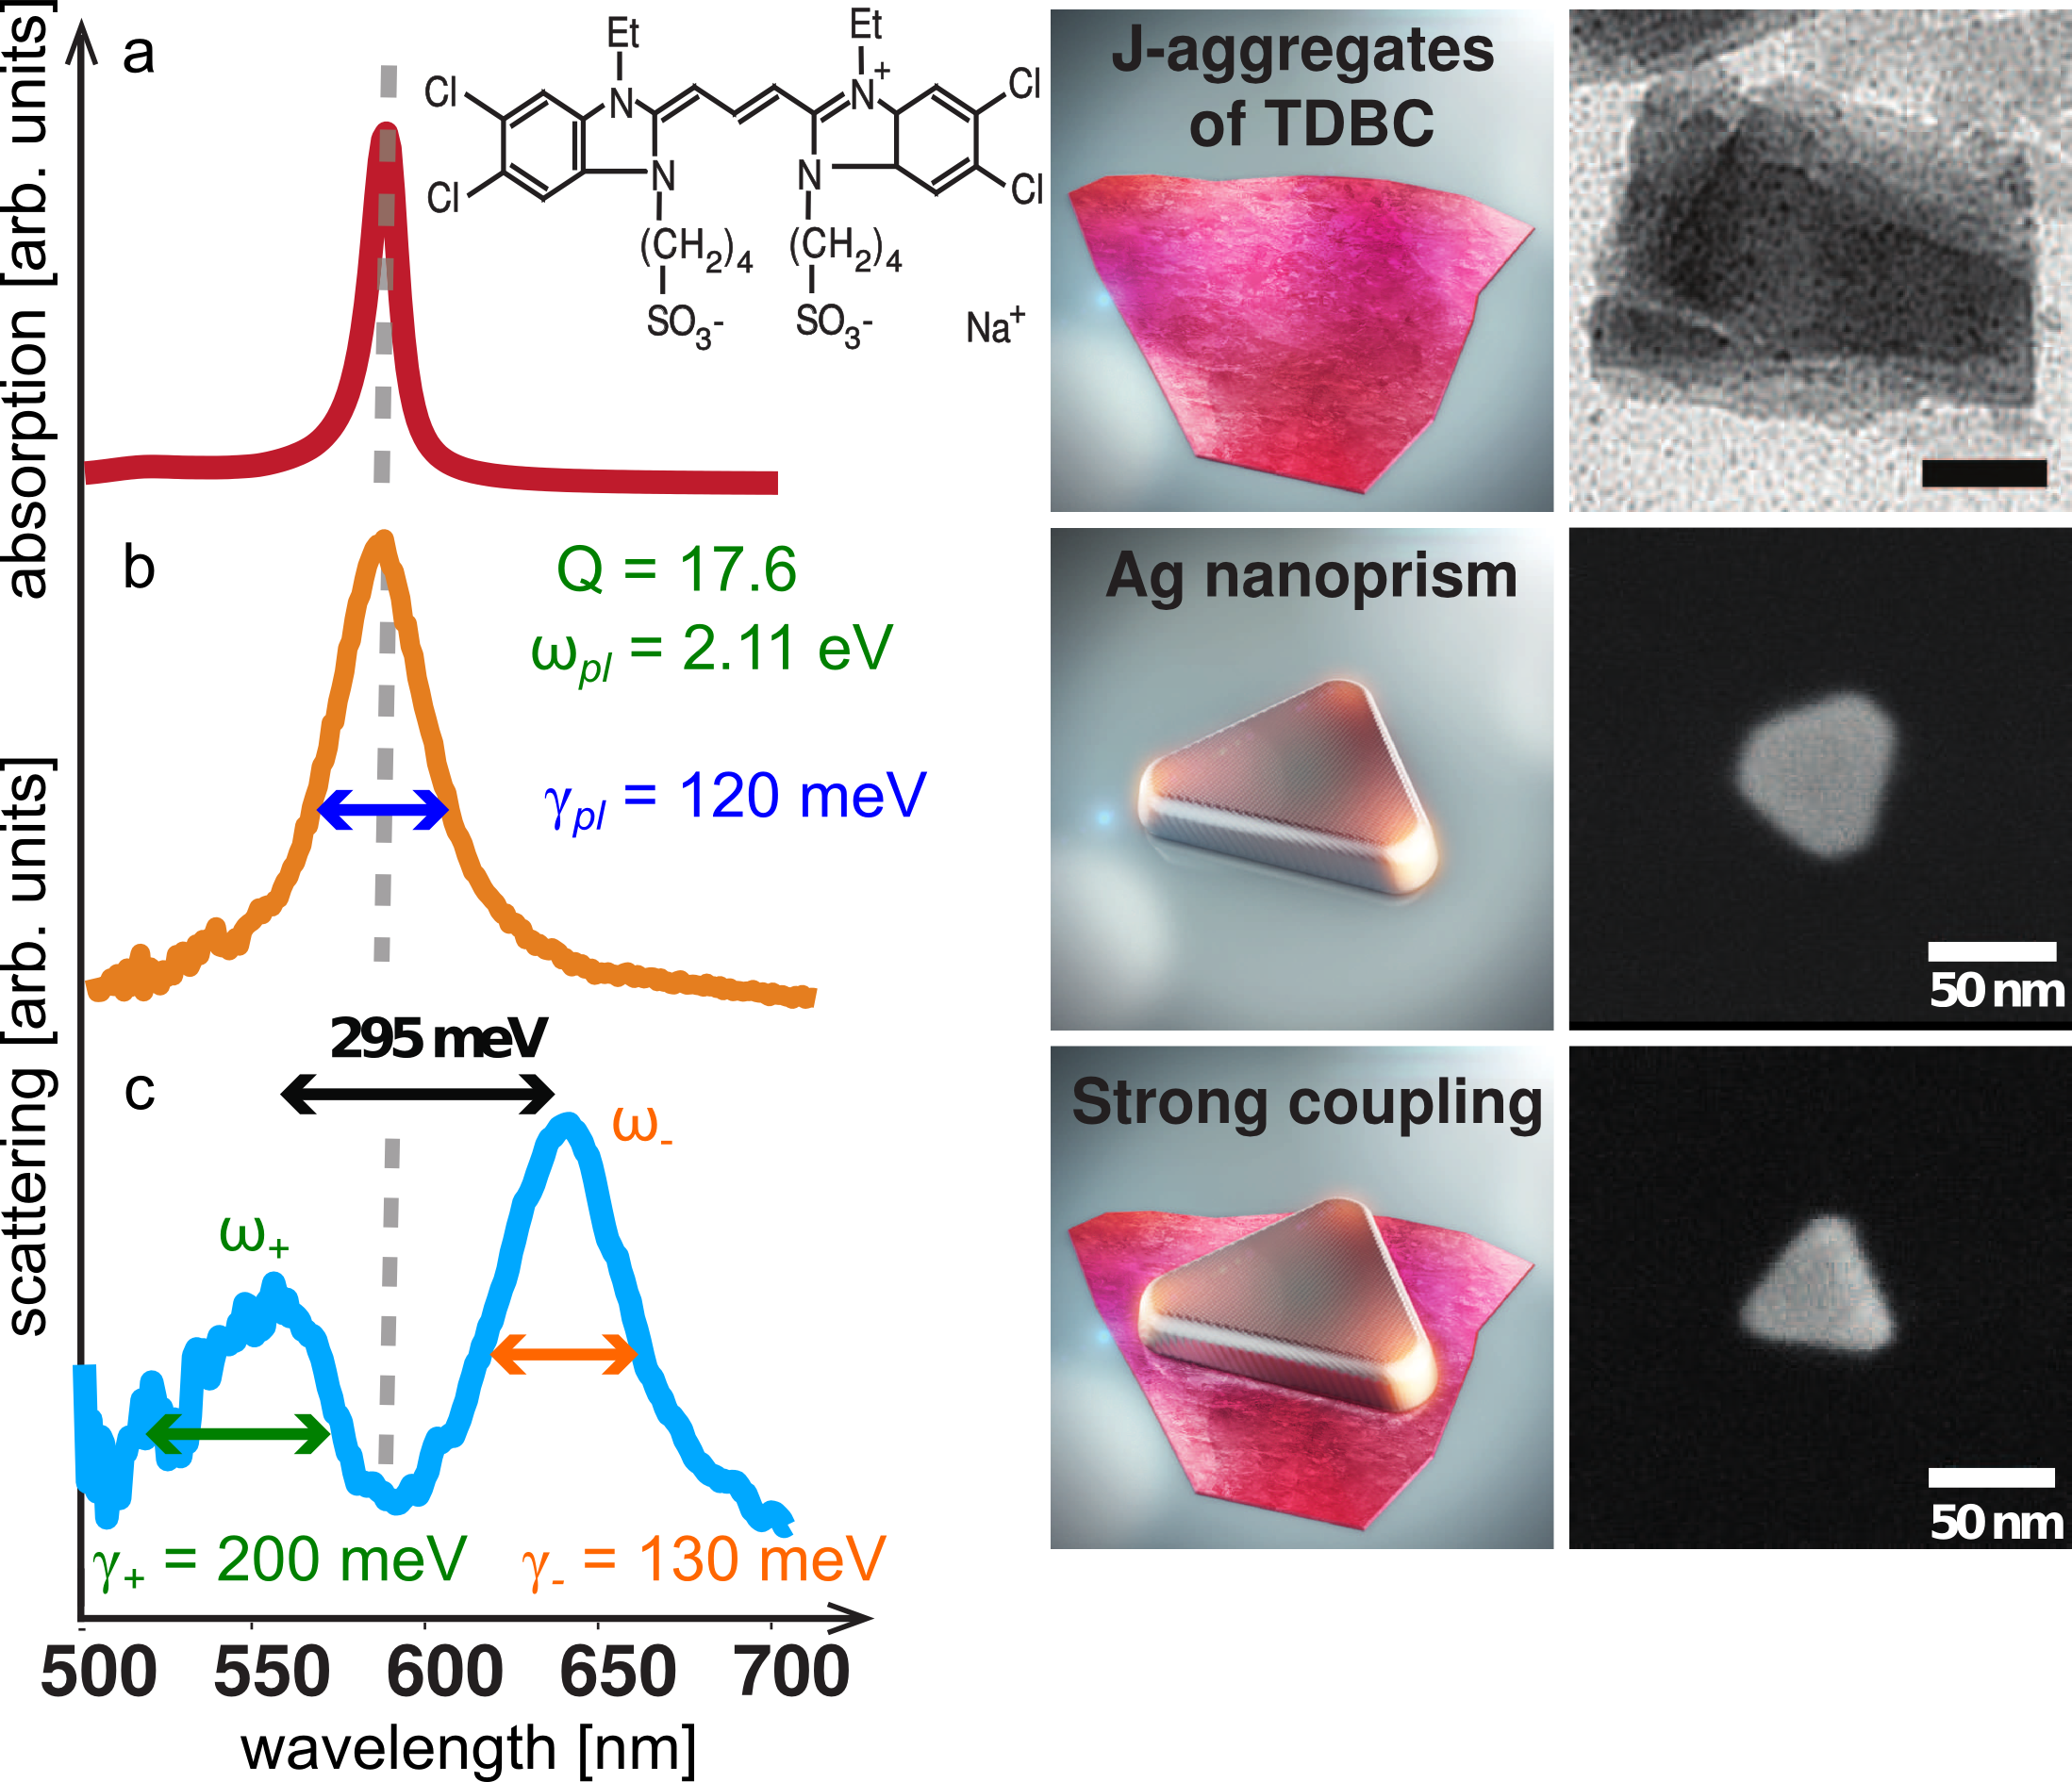
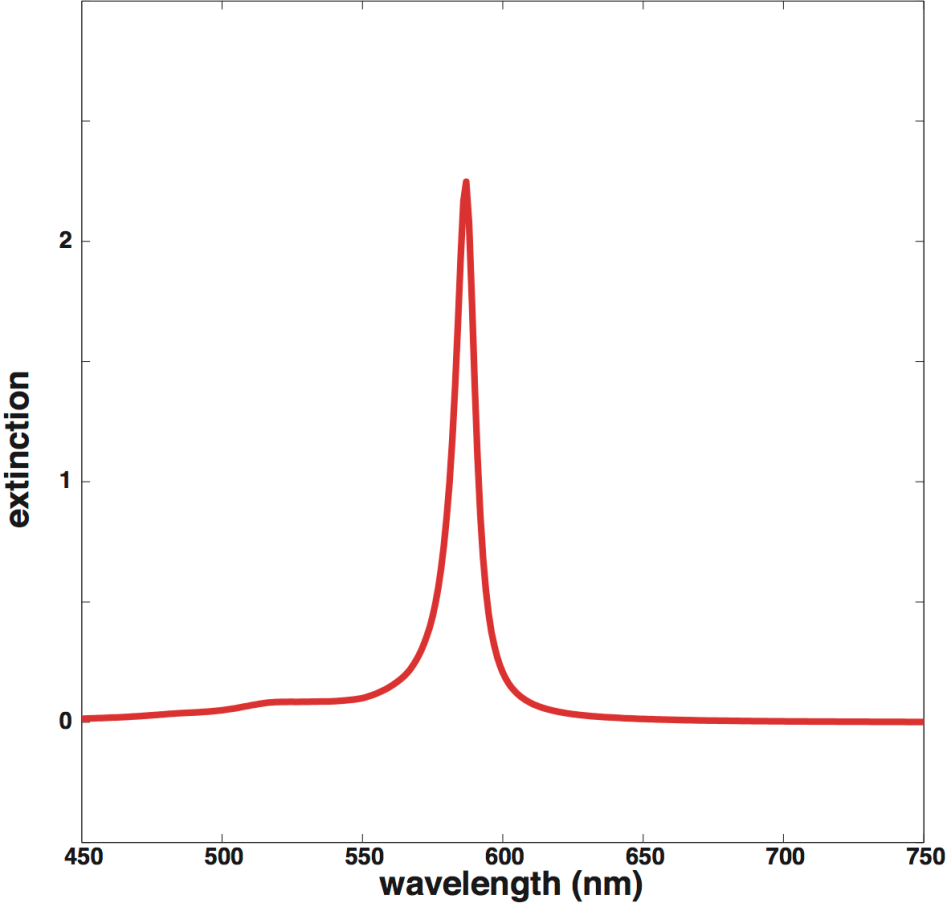
To achieve strong coupling between a cavity and an emitter, it is essential to combine a high-/low- cavity with a high oscillator strength of the emitter. For this reason, we specifically chose silver nanoprisms and J-aggregates, since the former possess low damping due to small geometrical volumes and high crystalline quality, while the transition dipole moment of the latter is large due to a single electron excitation being delocalized over many adjacent molecules – all contributing to the oscillator strength Würthner et al. (2010). The specific molecule we use is a cyanine dye called TDBC that forms J-aggregates in water solution with a single exciton delocalized over 15 molecules at room temperature van Burgel et al. (1995). Figure 1a shows the extinction spectrum of J-aggregates exhibiting a narrow peak at 588 nm ( eV). When a silver nanoprism supporting a plasmon resonance matching the J-band (Fig. 1b) is placed in close proximity to the molecules, a coupled hybrid system exhibiting very significant mode splitting into upper () and lower () hybrid plasmon-exciton branches is formed, signaling the realization of a strong coupling scenario (Fig. 1c). A possible dye-nanoparticle arrangement that could lead to such scattering spectrum is schematically shown in Fig. 1 – as supported by scanning and transmission electron (SEM and cryo-TEM) and atomic force (AFM) microscopies showing that J-aggregates form thin 3 nm planar sheets and silver nanoprisms reside above or below them (Fig. S1).
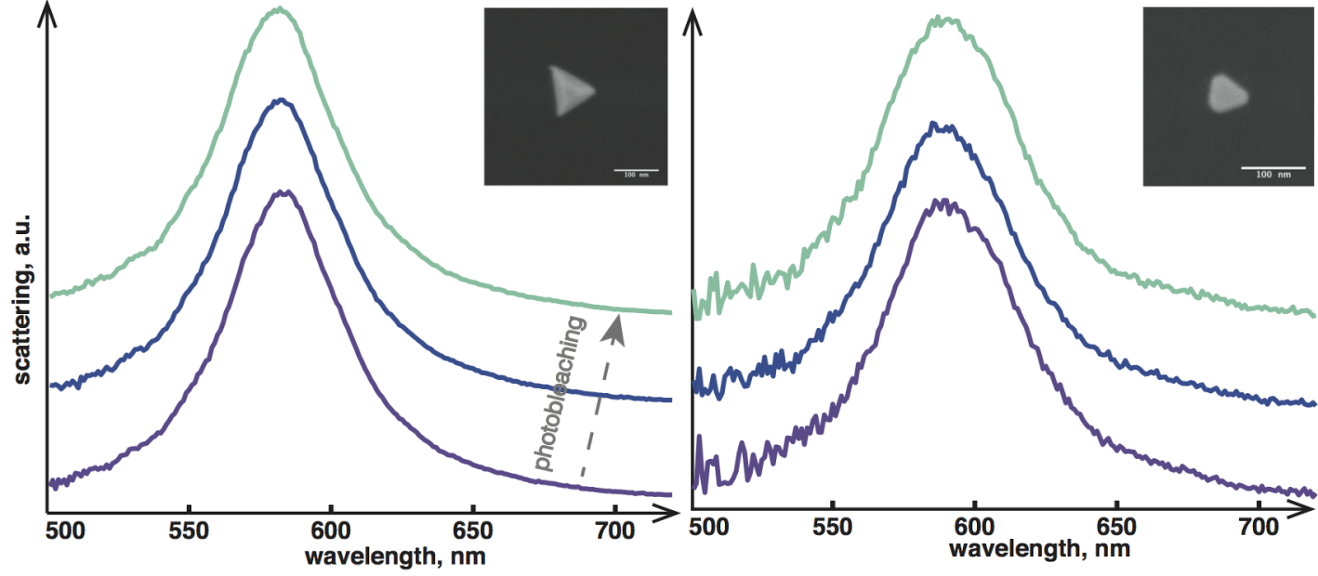
Figure 1 shows that silver nanoprisms can indeed strongly interact with J-aggregates. To reveal the factors affecting the coupling process, we measured and analyzed scattering spectra from 20 isolated plasmon-exciton systems, structurally characterized them and performed electrodynamics finite-difference time domain (FDTD) calculations. Individual silver nanoprisms’ spectra were measured using hyperspectral imaging – an approach that allows for parallel sampling of many isolated particles Bingham et al. (2009); Chen et al. (2011) (Fig. S3). Control experiments ensuring that the scattering dips indeed originate from plasmon-exciton coupling were performed: monitoring spectral evolution as a function of J-aggregate photodecomposition (Fig. 3), fluorescence of hybrid systems (Fig. S8) and bare silver nanoparticle scattering measurements (Fig. S4, S9).
To determine whether the plasmon-exciton system is strongly coupled, we describe our scattering spectra in terms of the classical coupled harmonic oscillator model, which predicts upper and lower plasmon-exciton branches in agreement with the quantum mechanical Jaynes-Cummings picture Bellessa et al. (2004); Rudin and Reinecke (1999); Agranovich et al. (2003):
| (1) |
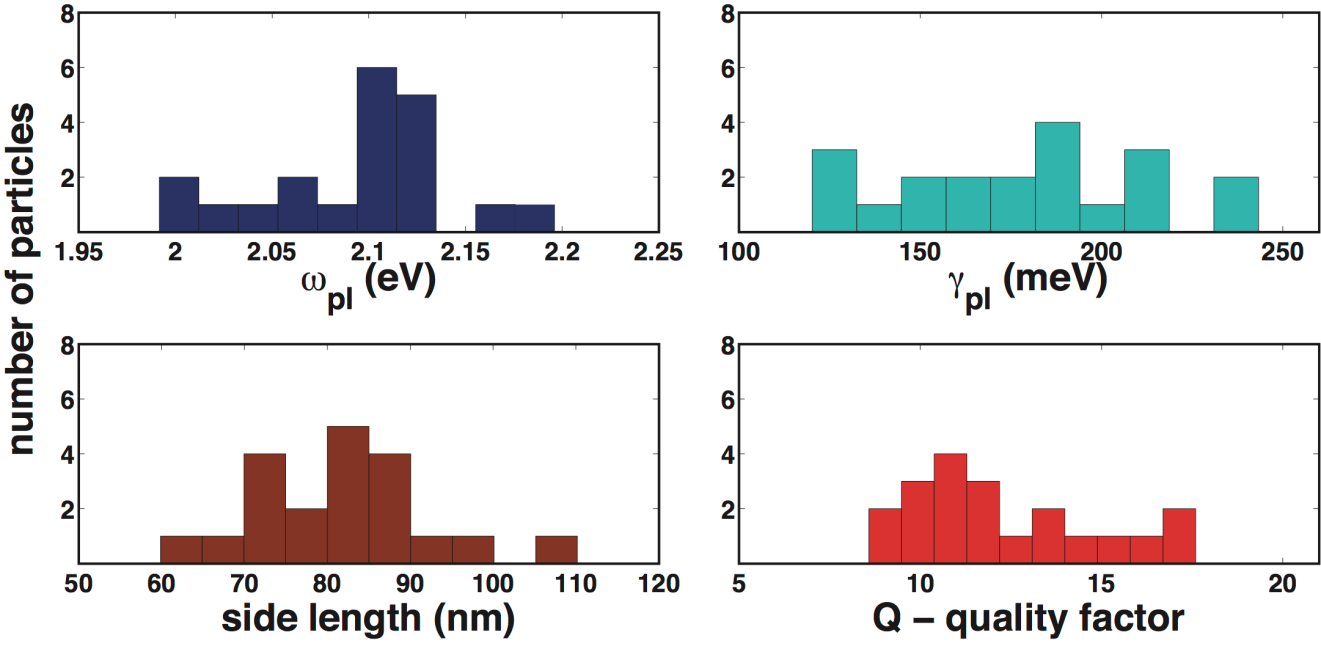
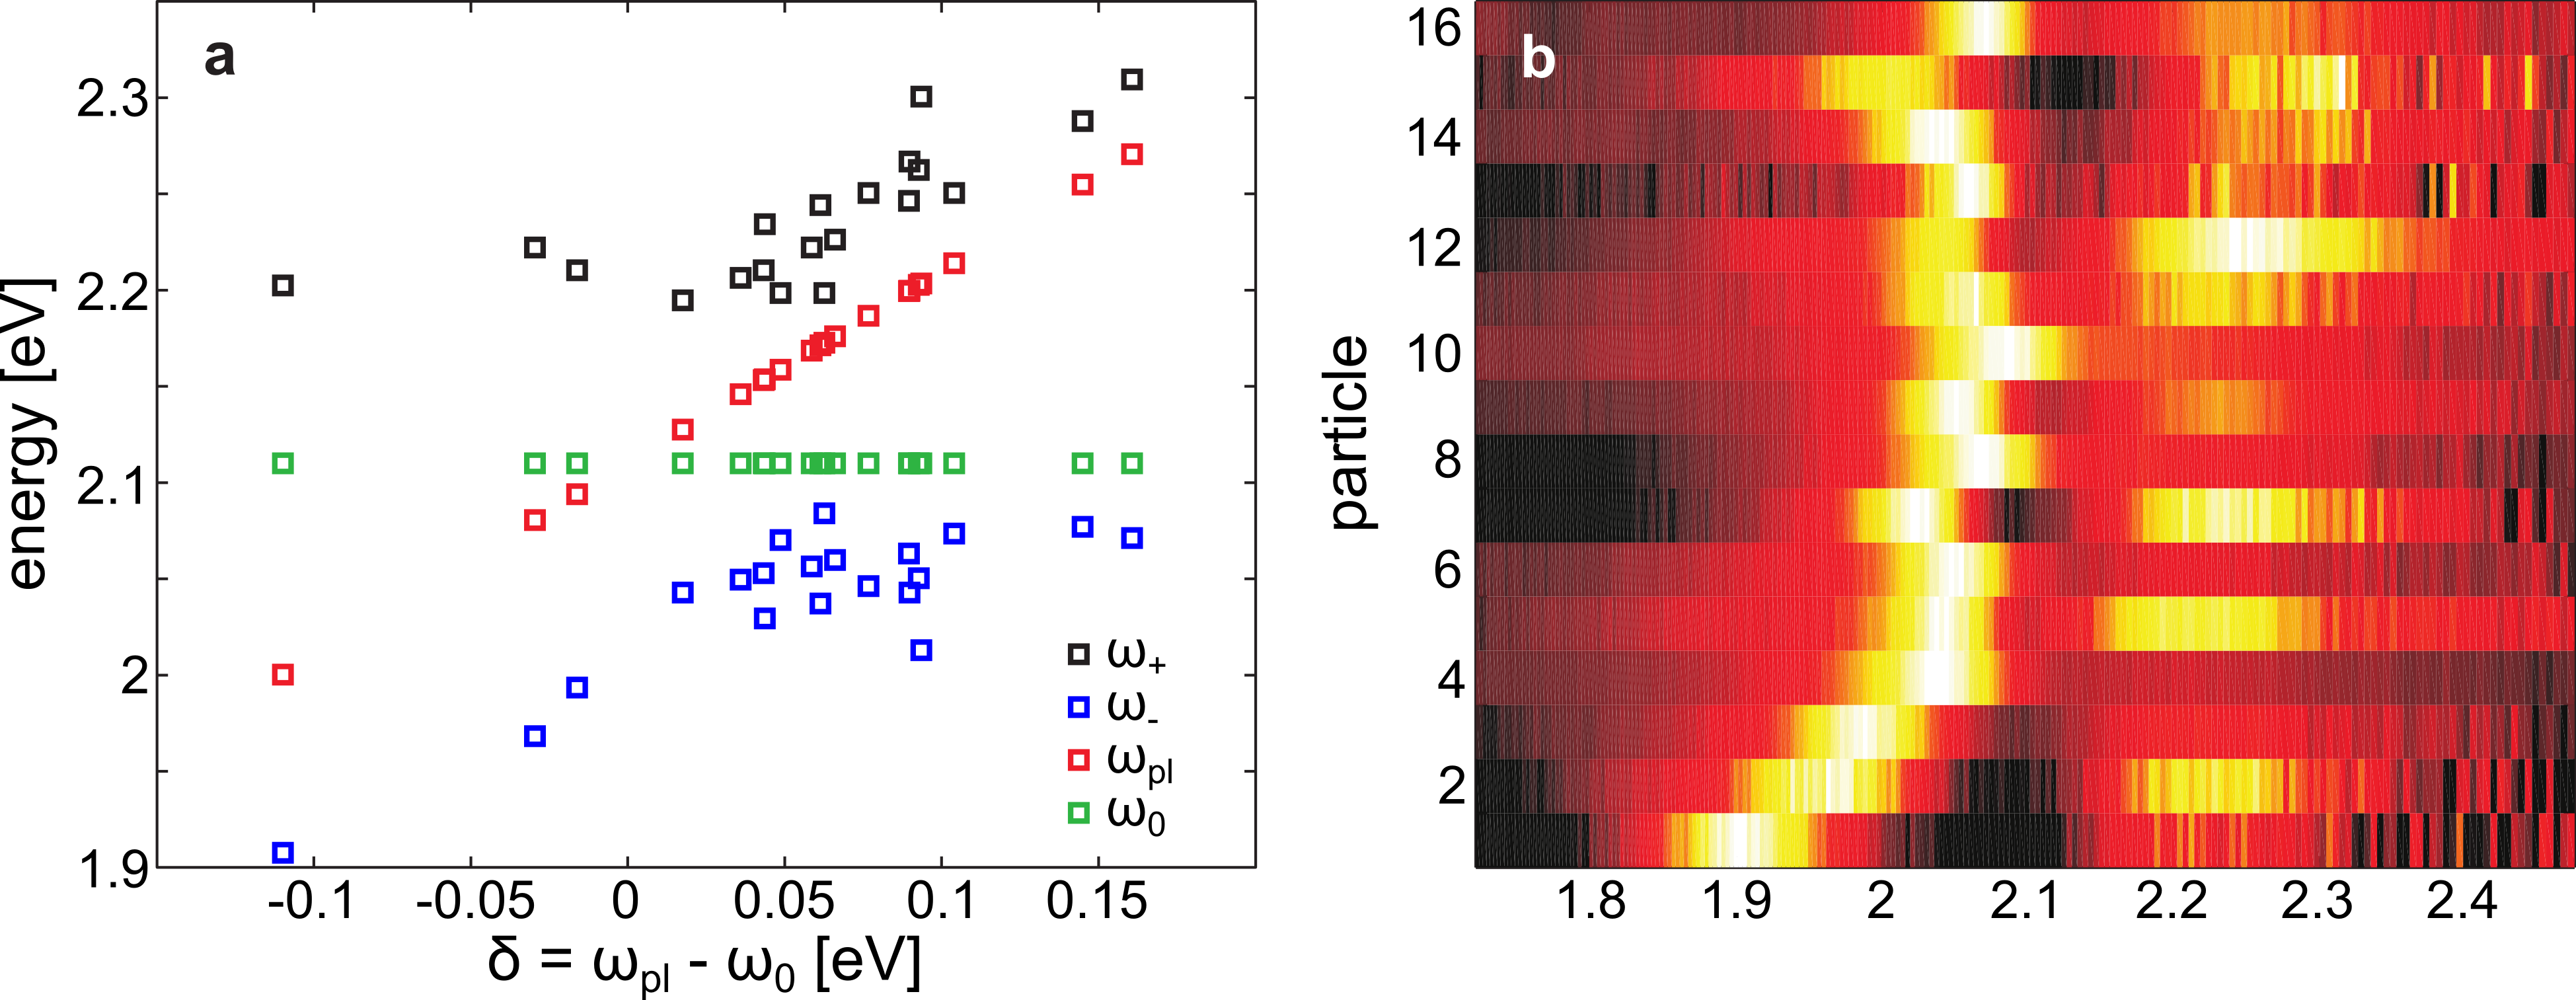
Here is the coupling rate, and are plasmon and exciton resonance energies and is the detuning. The plasmon-exciton branches can be directly accessed from the scattering data (Fig. 1c). Assuming the exciton resonance and width are homogeneous over the whole set of experiments ( eV and meV), we obtain the vacuum Rabi splitting , plasmon resonance and plasmon linewidth from Eq. (1) as , and , where is the full width at half maximum of the corresponding plasmon-exciton branch. The quality factor is calculated as . The coupled oscillator model is an alternative to direct determination of via anti-crossing at zero detuning, which is typically used in case of e.g. tunable photonic crystal cavities Khitrova et al. (2006). Here the nanocavity resonances are not tunable, however, by looking at the upper and lower plasmon-exciton branches for all measured nanoprisms (Fig. S5), we observe that the resulting curves resemble an anti-crossing behavior with of 170 meV, in good agreement with Fig. 2b. The analysis reveals that , , and of the coupled plasmon-exciton systems are distributed across a broad range of values (Fig. 2b-e), reflecting variations in particle morphology (Fig. 2f) as well as in the number of excitons contributing to the coupling process, . Since , where is the vacuum field and is the mode volume Yoshie et al. (2004), we should comment on the physical meaning of for plasmonic cavities. Following Koenderink (2010); Kristensen and Hughes (2014), we note that in case of small plasmonic nanoparticlesis the mode volume is well approximated by the geometrical volume, becasue the energy density – is concentrated mostly in the metal (Fig. 2a inset). This implies that is given by the nanoprism side lengh, , as since the nanoprism’s height is constant 10 nm. Thus, the coupling process can be seen as given by only two parameters – and .
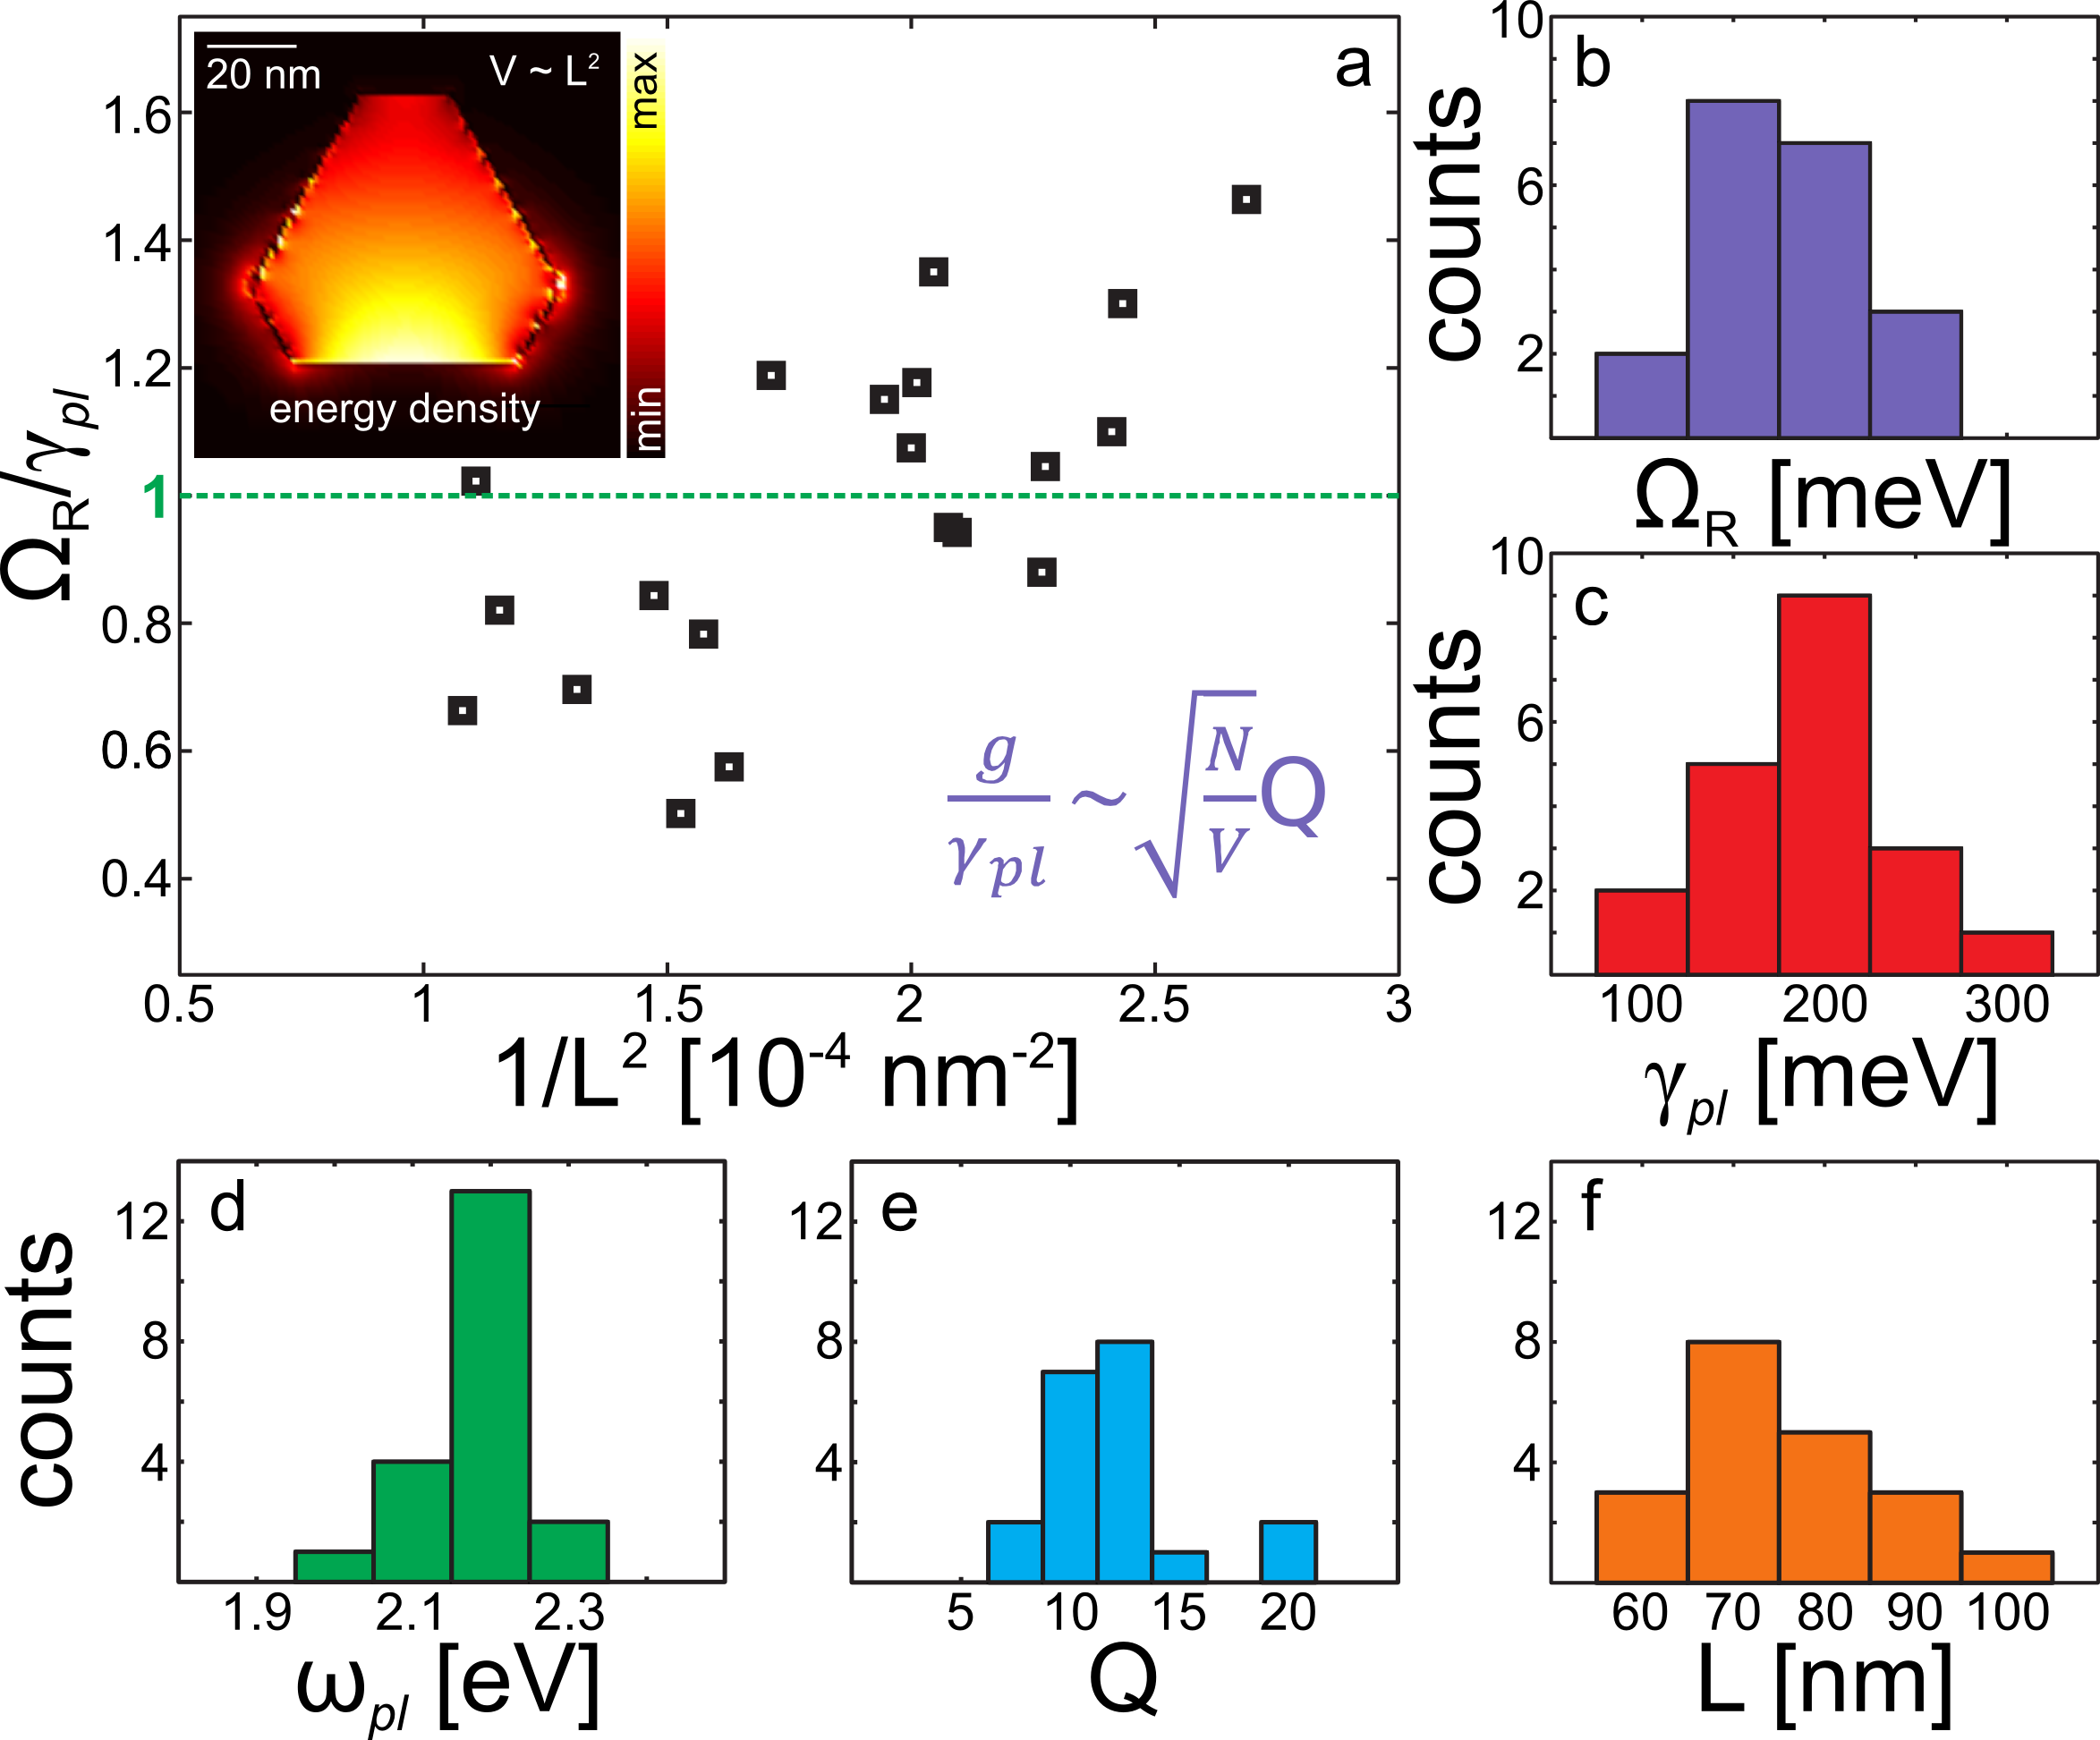
For further analysis we should first confine ourselves to a specific criterion of strong coupling taken as in this study. This is a rather strict criterion in comparison to or used in other works Khitrova et al. (2006); Schlather et al. (2013) and therefore satisfaction of this strict condition automatically implies satisfaction of all the weaker ones. The parameters extracted from the coupled oscillator model – , and – on one hand allow to infer whether the system satisfies the strong coupling condition and on the other to estimate and through the standard relation for the coupling rate Yoshie et al. (2004). That said, in Fig. 2a we plot as a function of (mimicking dependence on ) and observe that several plasmon-exciton systems exhibit strong coupling, i.e. . We also observe that increases for smaller particles, however, the correlation is not very strong, which is likely due to the diversity of the nanoprisms and inhomogeneous distribution of molecules around them. To verify whether such spread is realistic, we performed electrodynamic FDTD calculations (Fig. S6), which show that silver nanoprisms indeed can be expected to have values in the range of 8-14 and the mode volume in the range of nm3 in good correlation with geometrical volume. Such mode volume dispersion agrees well with the spread shown in Fig. 2a. We would like to stress here that a quantity , which characterizes the cavity in terms of its coupling ability and therefore referred to in the literature as the figure-of-merit for strong coupling related phenomena Yoshie et al. (2004); Englund et al. (2005), is about m-3/2 in case of silver nanoprisms studied here ( and nm m3), which is only 5 times smaller than state-of-art photonic crystal cavities m-3/2 ( and m3 – parameters taken from Ref. Yoshie et al. (2004)). This implies that plasmonic nanoparticles, especially in the form of weakly radiating single crystalline nanoprisms studied here, are indeed very prominent alternatives to photonic crystal and microring resonator cavities.
To elucidate how many excitons contribute to the observed interactions, we used the experimentally obtained values for together with numerically evaluated , and compared them using the standard relations for the coupling rate and the vacuum field. For the two limiting cases representing the data ( meV, nm3 and meV, nm3), we estimate Debye. is independently evaluated from the extinction measurement in water solution of J-aggregates Debye (Fig. S2) and thus the overall number of excitons contributing to is , while the number of TDBC monomers is . Although, the current realization is rather far from the quantum optics limit, by extrapolating the coupling down to a single exciton we obtain meV, which can be realistically increased by further compressing the mode volume and increasing .
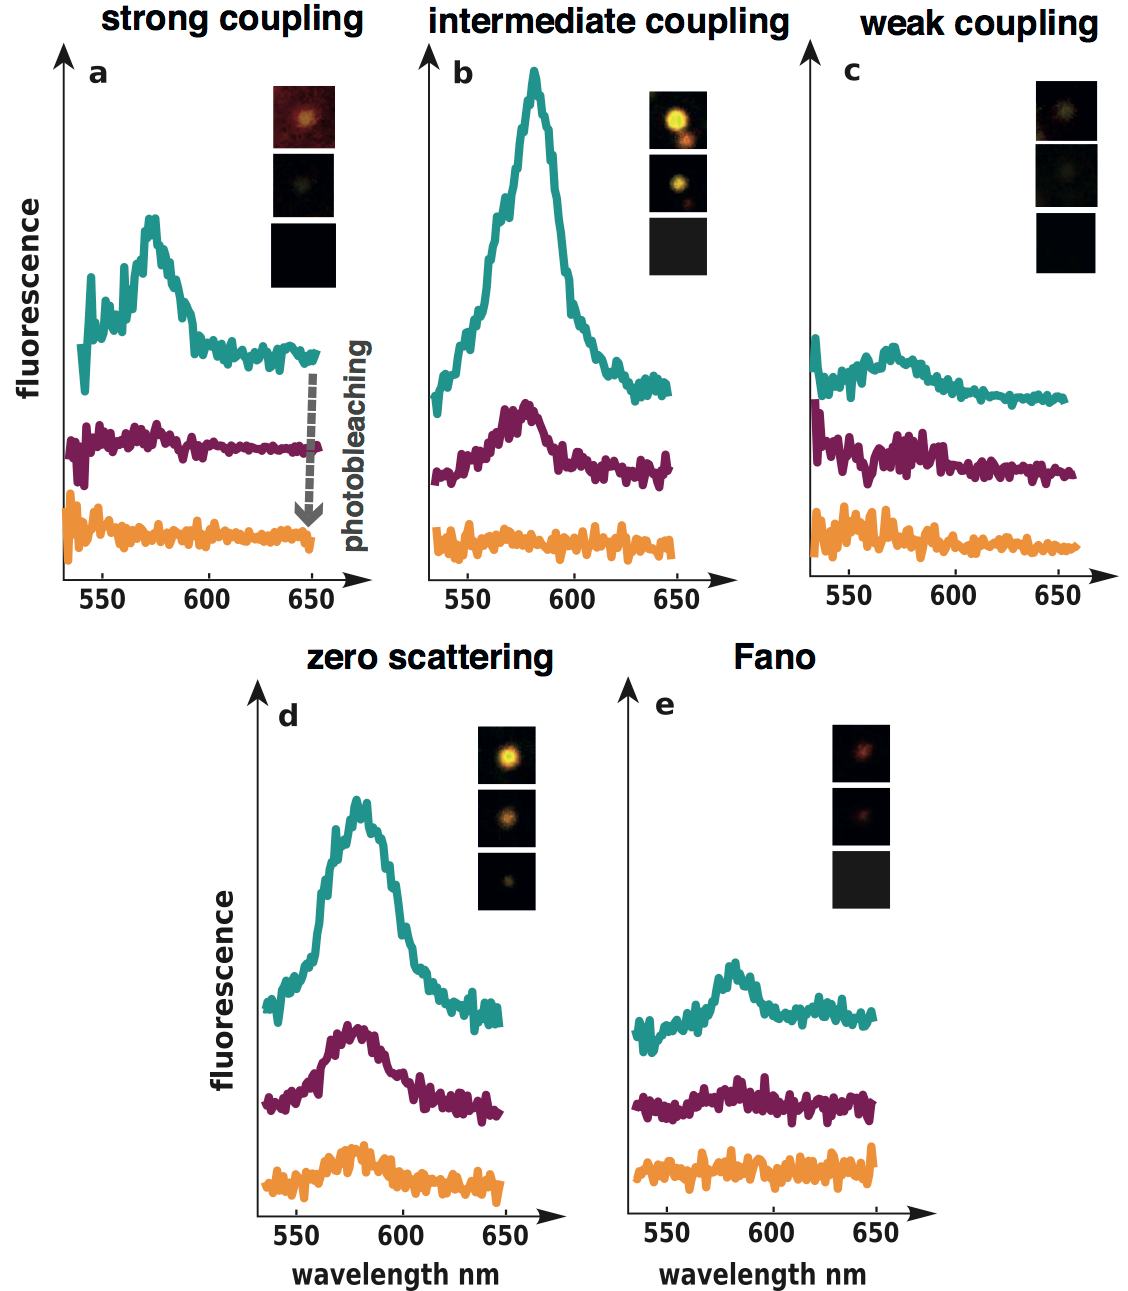
The plasmon-exciton system used in our study is amenable for realizing a wide range of light-matter interactions (Fig. 2a). To illustrate this diversity we have chosen and characterized five of the nanoprisms in greater detail. The realized coupling regimes range from very strong to weak. Figure 3a shows a strongly coupled plasmon-exciton system with a Rabi splitting of meV, while meV and , resulting in a value of of about 1.5 – a very high number for both plasmonic and photonic systems Khitrova et al. (2006); Schlather et al. (2013); Zengin et al. (2013). Importantly, Fig. 3a shows a system with relatively modest Rabi splitting of meV, while the maximum observed in this study is meV, yet it is deep in the strong coupling regime – achieved due to relatively high in this case. In Fig. 3b we show the scattering spectrum for a nanoprism resembling a case of intermediate coupling (). Here, meV, while meV and . The characteristic of this regime is that the dip is not as pronounced as in the strong coupling case – a result of increased and an average . However, coupling in the intermediate regime is still more pronounced than in the weak coupling case shown in Fig. 3c, where the scattering spectrum is only slightly suppressed at the position of the J-aggregate line – a situation realized when splitting is low, i.e. ( meV, meV). Moreover, it has been shown previously that suppression of scattering in case of weak coupling occurs mostly due to enhanced absorption in the dye layer Antosiewicz et al. (2014). A situation observed in Fig. 3c is similar to several previously published single-particle data Uwada et al. (2007); Liu et al. (2007); Ni et al. (2010), suggesting realization of an enhanced-absorption scenario in these works.
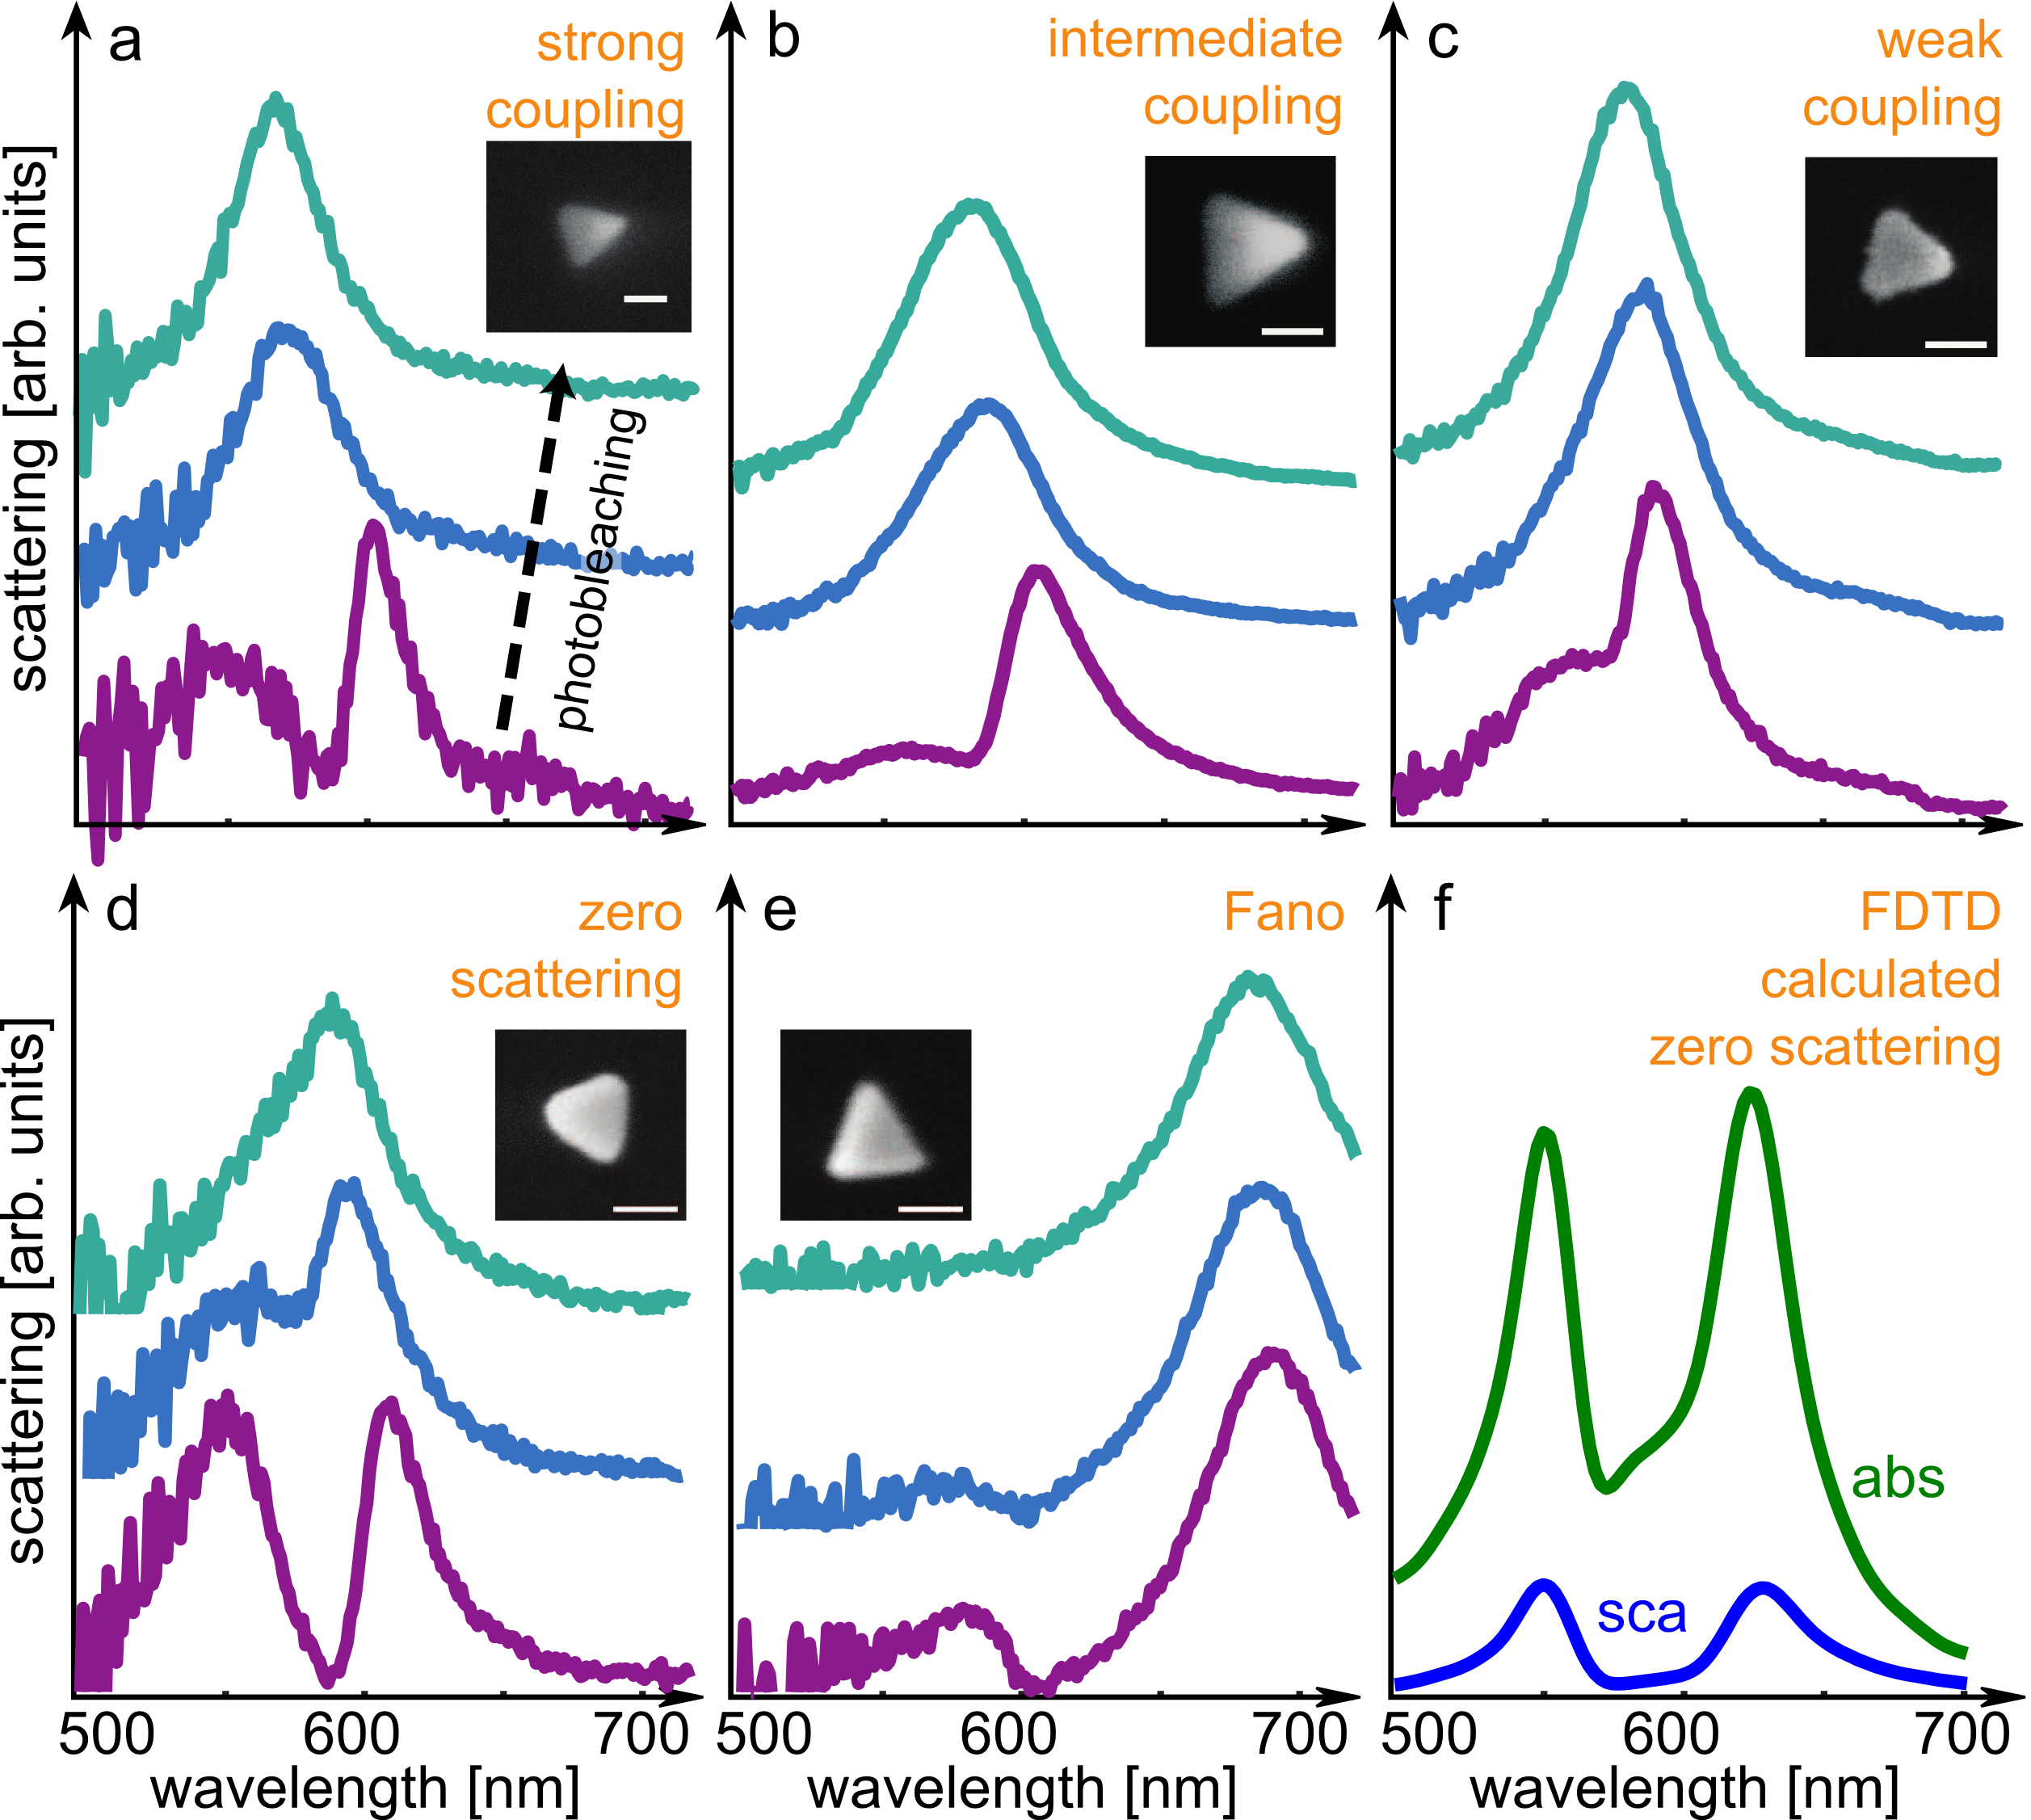
Interestingly, the spectrum in Fig. 3d exhibits a nearly complete suppression of scattering in the strong coupling regime (i.e. zero-scattering), with meV dominating over meV. From Ref. Wu et al. (2010); Zengin et al. (2013), it can be shown that very pronounced dips in scattering response can be achieved when , which is true for both Fig. 1c and Figs. 3a,d, suggesting that strong coupling is accompanied not only by large splitting but also by nearly complete suppression of scattering. The phenomenon of zero scattering requires that the absorption cross-section of these nanostructures should be also strongly suppressed, in accordance with the optical theorem. To illustrate this, we perform FDTD caclulations using realistic nanoprism-J-aggregate parameters (Fig. 3f), which indicate that spectral dips are present not only in scattering but also in absorption – as anticipated in case of strong coupling Antosiewicz et al. (2014).
Finally, in Fig. 3e, we observe an asymmetric Fano lineshape in the plasmon-exciton system, arising due to interaction between narrow J-aggregate resonance and a broad detuned plasmon resonance (). This example aims at illustrating similarities between various aspects of plasmon related phenomena often referred as Fano resonances, strong coupling or electromagnetically induced transparency.
In all five cases presented in Fig. 3, independently of the realized scenario, the scattering dips gradually disappeared upon laser-induced J-aggregate degradation, implying that the diversity arises directly from plasmon-exciton interactions. Indeed, SEM images confirm that in each case a spectrum originated from an isolated nanoprism. Fluorescence spectra of these plasmon-exciton systems (Fig. S8) are much broader than fluorescence of the free J-aggregates in solution, indicating strong interaction between J-aggregates and surface plasmons. Note that control experiments on bare silver nanoprisms showed that the laser illumination does not affect the nanoparticles’ shape and spectra (Fig. S9).
In conclusion, strong light-matter interactions realized in the single crystal nanoprisms studied here outperform all previously reported realizations, including Ag nanorods Zengin et al. (2013) and Au dimers Schlather et al. (2013) in terms of degree of coupling – – and strong coupling figure-of-merit . We note that and are more relevant for the description of strong coupling than the vacuum Rabi splitting alone, no matter how high the latter is. Indeed, ensemble measurements reported Rabi splitting approaching eV Schwartz et al. (2013) – more than three times greater than in the current study, however, this was achieved due to tremendous amount of molecules adsorbed within large mode volumes of macroscopic samples. Vacuum Rabi splitting in the range 200-400 meV was also claimed for the case of Au dimers produced by electron beam lithography Schlather et al. (2013), however, these polycrystalline dimer structures exhibit significant radiative losses resulting in as large as meV, thereby reducing to values of about even for the only nanostructure displaying meV Rabi splitting. In the current study, is strongly suppressed due to reduced radiative damping and high crystalline quality of silver nanoprisms resulting in and m-3/2 as demonstrated by both experiments and calculations. These results allow us to estimate the number of excitons coherently contributing to the coupling process, , implying that single exciton strong coupling might be within reach provided further compression of the mode volume. Furthermore, photobleaching and structural characterization experiments unambiguously prove that coupling arises due to plasmon-exciton interactions. Importantly, our results show that plasmon-exciton systems are viable alternatives to photonic cavities, thereby opening exciting opportunities for room temperature quantum optics.
We would like to thank André Dankert for helping with AFM measurements, Dr. Annika Altskär for helping with cryo-TEM measurements and Dr. Stefan Gustafsson for helping with TEM measurements. The authors acknowledge financial support from Swedish Research Council (VR), Knut and Alice Wallenberg Foundation (KAW), Swedish Foundation for Strategic Research (SSF), and the Foundation for Polish Science via the project HOMING PLUS/2013-7/1.
References
- Lo and Chau (1999) H.-K. Lo and H. F. Chau, Science 283, 2050 (1999).
- Tiecke et al. (2014) T. G. Tiecke, J. D. Thompson, N. P. de Leon, L. R. Liu, V. Vuletić, and M. D. Lukin, Nature 508, 241 (2014).
- McKeever et al. (2003) J. McKeever, A. Boca, A. D. Boozer, J. R. Buck, and H. J. Kimble, Nature 425, 268 (2003).
- Volz et al. (2012) T. Volz, A. Reinhard, M. Winger, A. Badolato, K. J. Hennessy, E. L. Hu, and A. Imamoglu, Nature Photon. 6, 605 (2012).
- Imamoglu et al. (1999) A. Imamoglu, D. D. Awschalom, G. Burkard, D. P. DiVincenzo, D. Loss, M. Sherwin, and A. Small, Phys. Rev. Lett. 83, 4204 (1999).
- Khitrova et al. (2006) G. Khitrova, M. Gibbs, M. Kira, S. W. Koch, and A. Scherer, Nature Phys, 2, 81 (2006).
- Chang et al. (2014) D. E. Chang, V. Vuletic, and M. D. Lukin, Nature Photon. 8, 685 (2014).
- Hennessy et al. (2007) K. Hennessy, A. Badolato, M. Winger, D. Gerace, M. Atatüre, S. Gulde, S. Fält, E. L. Hu, and A. Imamoglu, Nature 445, 896 (2007).
- Thompson et al. (1992) R. J. Thompson, G. Rempe, and H. J. Kimble, Phys. Rev. Lett. 68, 1132 (1992).
- Aoki et al. (2006) T. Aoki, B. Dayan, E. Wilcut, W. P. Bowen, A. S. Parkins, T. J. Kippenberg, K. J. Vahala, and H. J. Kimble, Nature 443, 671 (2006).
- Yoshie et al. (2004) T. Yoshie, A. Scherer, J. Hendrickson, G. Khitrova, H. M. Gibbs, G. Rupper, C. Ell, O. B. Shchekin, and D. G. Deppe, Nature 432, 200 (2004).
- Gröblacher et al. (2007) S. Gröblacher, T. Paterek, R. Kaltenbaek, C. Brunker, M. Żukowski, M. Aspelmeyer, and A. Zeilinger, Nature 446, 871 (2007).
- Faraon et al. (2008) A. Faraon, I. Fushman, D. Englund, N. Stoltz, P. Petroff, and J. Vucković, Nature Phys. 4, 859 (2008).
- Wu et al. (2010) X. Wu, S. K. Gray, and M. Pelton, Opt. Express 18, 23633 (2010).
- Savasta et al. (2010) S. Savasta, R. Saija, A. Ridolfo, O. Di Stefano, P. Denti, and F. Borghese, ACS Nano 4, 6369 (2010).
- Manjavacas et al. (2011) A. Manjavacas, F. J. G. d. Abajo, and P. Nordlander, Nano Letters 11, 2318 (2011).
- Chen et al. (2013) X.-W. Chen, V. Sandoghdar, and M. Agio, Phys. Rev. Lett. 110, 153605 (2013).
- Antosiewicz et al. (2014) T. J. Antosiewicz, S. P. Apell, and T. Shegai, ACS Photonics 1, 454 (2014).
- Kneipp et al. (1997) K. Kneipp, Y. Wang, H. Kneipp, L. T. Perelman, I. Itzkan, R. R. Dasari, and M. S. Feld, Phys. Rev. Lett. 78, 1667 (1997).
- Nie and Emory (1997) S. Nie and S. R. Emory, Science 275, 1102 (1997).
- Xu et al. (1999) H. Xu, E. J. Bjerneld, M. Käll, and L. Börjesson, Phys. Rev. Lett. 83, 4357 (1999).
- Zhang et al. (2013) R. Zhang, Y. Zhang, Z. C. Dong, S. Jiang, C. Zhang, L. G. Chen, L. Zhang, Y. Liao, J. Aizpurua, Y. Luo, J. L. Yang, and J. G. Hou, Nature 498, 82 (2013).
- Noginov et al. (2009) M. A. Noginov, G. Zhu, A. M. Belgrave, R. Bakker, V. M. Shalaev, E. E. Narimanov, S. Stout, E. Herz, T. Suteewong, and U. Wiesner, Nature 460, 1110 (2009).
- Kinkhabwala et al. (2009) A. Kinkhabwala, Z. Yu, S. Fan, Y. Avlasevich, K. Mülen, and W. E. Moerner, Nature Photon. 3, 654 (2009).
- Würthner et al. (2010) F. Würthner, T. E. Kaiser, and C. R. Saha-Möller, Angew. Chem., Int. Ed. 50, 3376 (2010).
- Bellessa et al. (2004) J. Bellessa, C. Bonnand, J. C. Plenet, and J. Mugnier, Phys. Rev. Lett. 93, 036404 (2004).
- Dintinger et al. (2005) J. Dintinger, S. Klein, F. Bustos, W. L. Barnes, and T. W. Ebbesen, Phys. Rev. B 71, 035424 (2005).
- Vasa et al. (2013) P. Vasa, W. Wang, R. Pomraenke, M. Lammers, M. Maiuri, C. Manzoni, G. Cerullo, and C. Lienau, Nature Photon. 7, 128 (2013).
- Schwartz et al. (2011) T. Schwartz, J. A. Hutchison, C. Genet, and T. W. Ebbesen, Phys. Rev. Lett. 106, 196405 (2011).
- Balci (2013) S. Balci, Opt. Lett. 38, 4498 (2013).
- Uwada et al. (2007) T. Uwada, R. Toyota, H. Masuhara, and T. Asahi, The Journal of Physical Chemistry C 111, 1549 (2007).
- Liu et al. (2007) G. L. Liu, Y. T. Long, Y. Choi, T. Kang, and L. P. Lee, Nature Methods 4, 1015 (2007).
- Ni et al. (2010) W. Ni, T. Ambjönsson, S. P. Apell, H. Chen, and J. Wang, Nano Letters 10, 77 (2010).
- Schlather et al. (2013) A. E. Schlather, N. Large, A. S. Urban, P. Nordlander, and N. J. Halas, Nano Lett. 13, 3281 (2013).
- Zengin et al. (2013) G. Zengin, G. Johansson, P. Johansson, T. J. Antosiewicz, M. Käll, and T. Shegai, Sci. Rep. 3, 3074 (2013).
- van Burgel et al. (1995) M. van Burgel, D. A. Wiersma, and K. Duppen, The Journal of Chemical Physics 102, 20 (1995).
- Bingham et al. (2009) J. M. Bingham, K. A. Willets, N. C. Shah, D. Q. Andrews, and R. P. Van Duyne, J. Phys. Chem. C 113, 16839 (2009).
- Chen et al. (2011) S. Chen, M. Svedendahl, R. P. van Duyne, and M. Käll, Nano Lett. 11, 1826 (2011).
- Rudin and Reinecke (1999) S. Rudin and T. Reinecke, Phys. Rev. B 59, 10227 (1999).
- Agranovich et al. (2003) V. Agranovich, M. Litinskaia, and D. Lidzey, Phys. Rev. B 67, 085311 (2003).
- Koenderink (2010) A. F. Koenderink, Opt. Lett. 35, 4208 (2010).
- Kristensen and Hughes (2014) P. T. Kristensen and S. Hughes, ACS Photonics 1, 2 (2014).
- Englund et al. (2005) D. Englund, I. Fushman, and J. Vuckovic, Opt. Express 13, 5961 (2005).
- Schwartz et al. (2013) T. Schwartz, J. A. Hutchison, J. Léonard, C. Genet, S. Haacke, and T. W. Ebbesen, ChemPhysChem 14, 125 (2013).
Supplemental Material for
“Realizing strong light-matter interactions between single nanoparticle plasmons and molecular excitons at ambient conditions”
Gülis Zengin, Martin Wersäll, Sara Nilsson, Tomasz J. Antosiewicz, Mikael Käll, and Timur Shegai
Department of Applied Physics, Chalmers University of Technology, 412 06 Göteborg, Sweden
Centre of New Technologies, University of Warsaw, Banacha 2c, 02-097 Warszawa, Poland
I Methods
Sample preparation
The Ag colloidal particles were synthesized by the light-induced ripening process Jin et al. (2001). TDBC dye (5,6-Dichloro-2- [[5,6-dichloro-1-ethyl-3-(4-sulfobutyl)-benzimidazol-2-ylidene]-propenyl]-1-ethyl-3-(4-sulfobutyl)-benzimidazolium hydroxide, inner salt, sodium salt) was purchased from FEW Chemicals. The formation of J-aggregates from monomers depends on a number of factors including dye concentration, ionic environment and pH. By optimizing these parameters, the aqueous solution of TDBC dye was prepared at concentration of M in 5 mM NaOH. 50 l of Ag solution was mixed with 50 l of J-aggregate solution. The mixture was let for incubation overnight. The J-aggregate/Ag nanoparticles mixture was then applied to a TEM grid precoated with polylysine.
Optical measurements
Single particle dark-field scattering and fluorescence measurements were performed in an inverted microscope (Nikon TE-2000E) equipped with variable numerical aperture oil immersion objective (100X, NA = 0.5-1.3, Nikon). A tunable liquid crystal filter (VariSpec, 400-720 nm), that is transparent for light of only certain wavelength and linear polarization was used together with iXon EM-CCD detector (Andor) for hyperspectral imaging. Nearly isotropic in-plane polarization response of the nanoprisms justifies usage of the tunable filter in a single polarization channel. The transmission window of the liquid crystal filter was 10 nm. The liquid crystal filter was set to perform wavelength steps of 1 nm between successive images and synchronized with the CCD-chip. The hyperspectral images were recorded in sequences with wavelengths ranging from 500-720 nm and 535-650 nm for the dark-field and fluorescence measurements respectively. In case of triangular nanoprisms studied here, the method has an additional technical advantage, that is, many of the particles turned out to be aggregates of several silver prisms, thereby effectively lowering the throughput of the measurements. Only single nanoparticle data was analyzed in this study. In dark-field measurements, an air dark-field condenser (Nikon, NA = 0.8-0.95) was used. Tungsten halogen lamp was used to illuminate the sample. Even when driven at the maximum power, the light intensity from the lamp was still low enough to ensure no significant photodegradation of the dye samples. For fluorescence measurements, the sample was illuminated with a 532 nm laser at power of 100 W/cm2 in epi-illumination mode. The colored Rayleigh scattering and fluorescence images were taken by Nikon D300s DSLR camera.
Electron microscopy
High-vacuum scanning electron microscopy (SEM) with 2 kV acceleration voltage was used for imaging the single nanoparticles. As described in the sample preparation section, the particles were applied on top of a copper-grid substrate containing several distinct hollow quadrants. Each quadrant was supported with a very thin membrane on which the particles finally landed. Furthermore, in the center of the copper-grid, an asymmetric alignment mark was present which enabled us to locate and map out the quadrant of interest. Each particle inside a given quadrant was correlated with a corresponding optical image, based on which a correlated SEM-optical map was obtained.
II S1: Structural characterization of J-aggregates/Ag nanoparticle hybrids
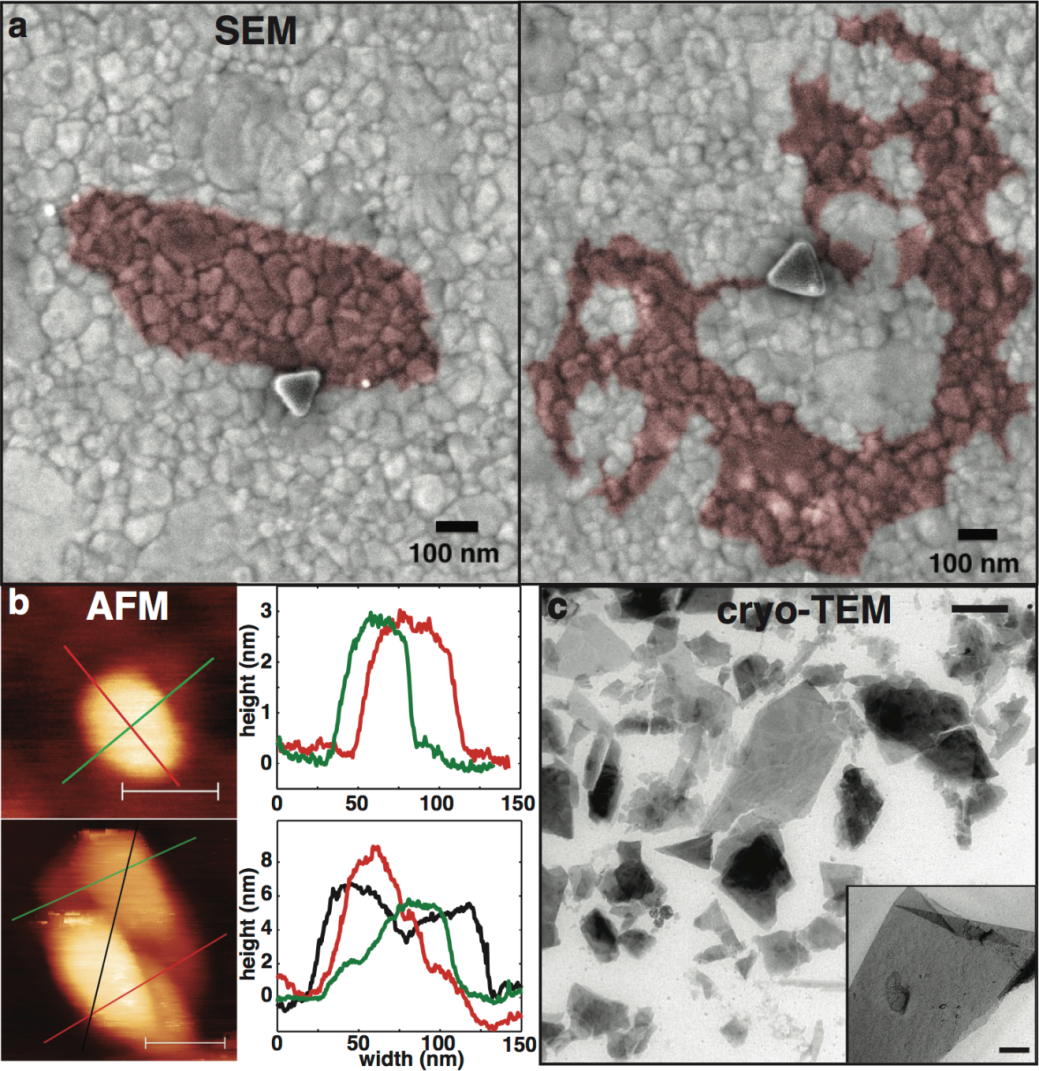
The results of our morphological characterization are summarized in Figure S1. The data show that J-aggregates are organized in large planar sheets of about nm thickness (see AFM scan) – somewhat similar to 2D materials e.g. graphene. Multiple layers, folded regions and defects are sometimes seen as evidenced by different level of contrast observed in both AFM and cryo-TEM images. AFM Scans along various directions (see Fig. S1b Bottom) show that the height profile varies in steps of about 2.5-3 nm, indicating occasional formation of bi-, tri- and multi-layers. The lateral size distribution of J-aggregate flakes is rather broad and ranges from about few tens of nanometers to tens of microns (see cryo-TEM). The largest of them can be easily observed in scattering.
Silver nanoparticles were found to lie flat either above or below J-aggregate sheets (see Fig. S1a). As is seen from those examples, due to very broad size distribution of J-aggregates, some of them can in principle be much larger than nanoprisms. If such a system is observed in a scattering experiment, most of the aggregate would not couple to the plasmon mode at all, but the non-interacting part would nevertheless contribute to scattering at J-band wavelength – a situation that was never observed in experiments. We therefore conclude that the optical data presented in Figs. 1-3 probably originates from J-aggregates whose lateral dimensions are comparable, but not much larger than the size of the nanoprism. These reasonably small J-aggregates are hard to directly visualize in SEM, nonetheless the structures shown in Figure S1a provide a reasonable idea of the plasmon-molecule organization. This hypothesis is additionally supported by numerical simulations using realistic dimensions and oscillator strength for the J-aggregate layers (see Figs. S7-S9).
III S2: Extinction of a free J-aggregate
Free dye parameters
An extinction measurement performed on free J-aggregates in water solution can be used to evaluate independently. In these estimations, it is important to have in mind that the exciton is strongly delocalized over many molecules forming the J-band and that each of the molecules involved contributes to the total oscillator strength of the transition. For TDBC, the literature suggests the room-temperature delocalization to occur over molecules, irrespectively of the actual physical size of the aggregate, which can be much larger van Burgel et al. (1995). Keeping the delocalization in mind, one can obtain the absorption cross-section of the exciton as cm2, where is the extinction optical density ( at maximum), is the concentration of monomers (15 M = cm-3) and is the light path length (0.4 cm) in the extinction measurement. Transition dipole moment characterizing the delocalized exciton is then given by Hilborn (1982), , where is the FWHM of the extinction spectrum (in s-1), – vacuum permittivity and is the resonance wavelength. Substituting all the measured parameters, we obtain the charge displacement Å and the dipole moment Debye of one exciton.
IV S3: Hyperspectral imaging
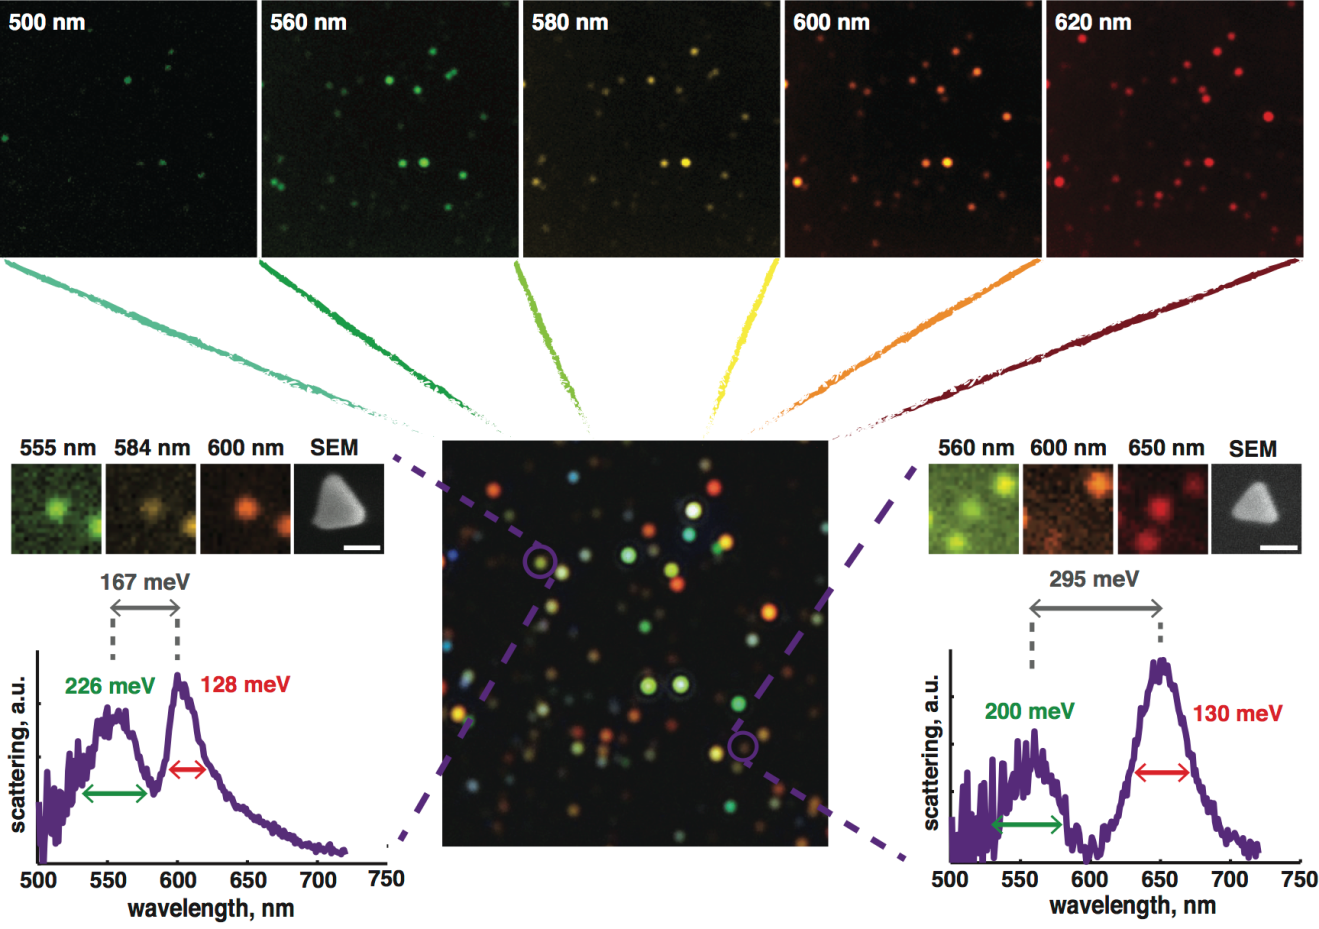
In this study the experiments were done by using a hyperspectral imaging technique utilizing a tunable liquid crystal filter. The concept of “spectroscopy by imaging” is illustrated in Fig. S3. Rayleigh scattering images in dark-field configuration were recorded at a number of spectrally narrow intervals controlled by a tunable filter. The scattering spectrum was then reconstructed by monitoring the intensity of a given particle as a function of wavelength. This procedure allows for parallel sampling of many isolated particles over the entire visible range and tremendously increases the throughput of single nanoparticle spectroscopy measurements Bingham et al. (2009); Chen et al. (2011). Dark-field scattering images of silver nanoparticles/J-aggregates hybrids recorded in this way are shown in the top row of Fig. S3 (for five exemplary wavelengths 500, 560, 580, 600, and 620 nm). The images are approximately m. Two representative single nanoprism spectra together with their SEM images are shown. The first particle (p1) exhibits a suppressed scattering at around the J-aggregate resonance, however, the mode splitting does not overcome the plasmon resonance width. The second particle (p2), on the other hand, shows much wider splitting which clearly overwhelms both plasmon and molecular decoherence rates and therefore enters the true strong coupling regime. Vacuum Rabi splitting for the case of particle (2) reaches about 300 meV, well above the plasmon resonance width, as shown in Fig. S3. These two particles, and the brief analysis of their spectral differences, aim at illustrating the power of hyperspectral imaging for single particle spectroscopy.
V S4: Bare Ag nanoprisms statistics
VI S5: Mode anti-crossing and scattering data for all nanoparticles
VII S6: Numerical calculations of electromagnetic near fields, mode volumes and quality factors for uncovered silver nanoprisms
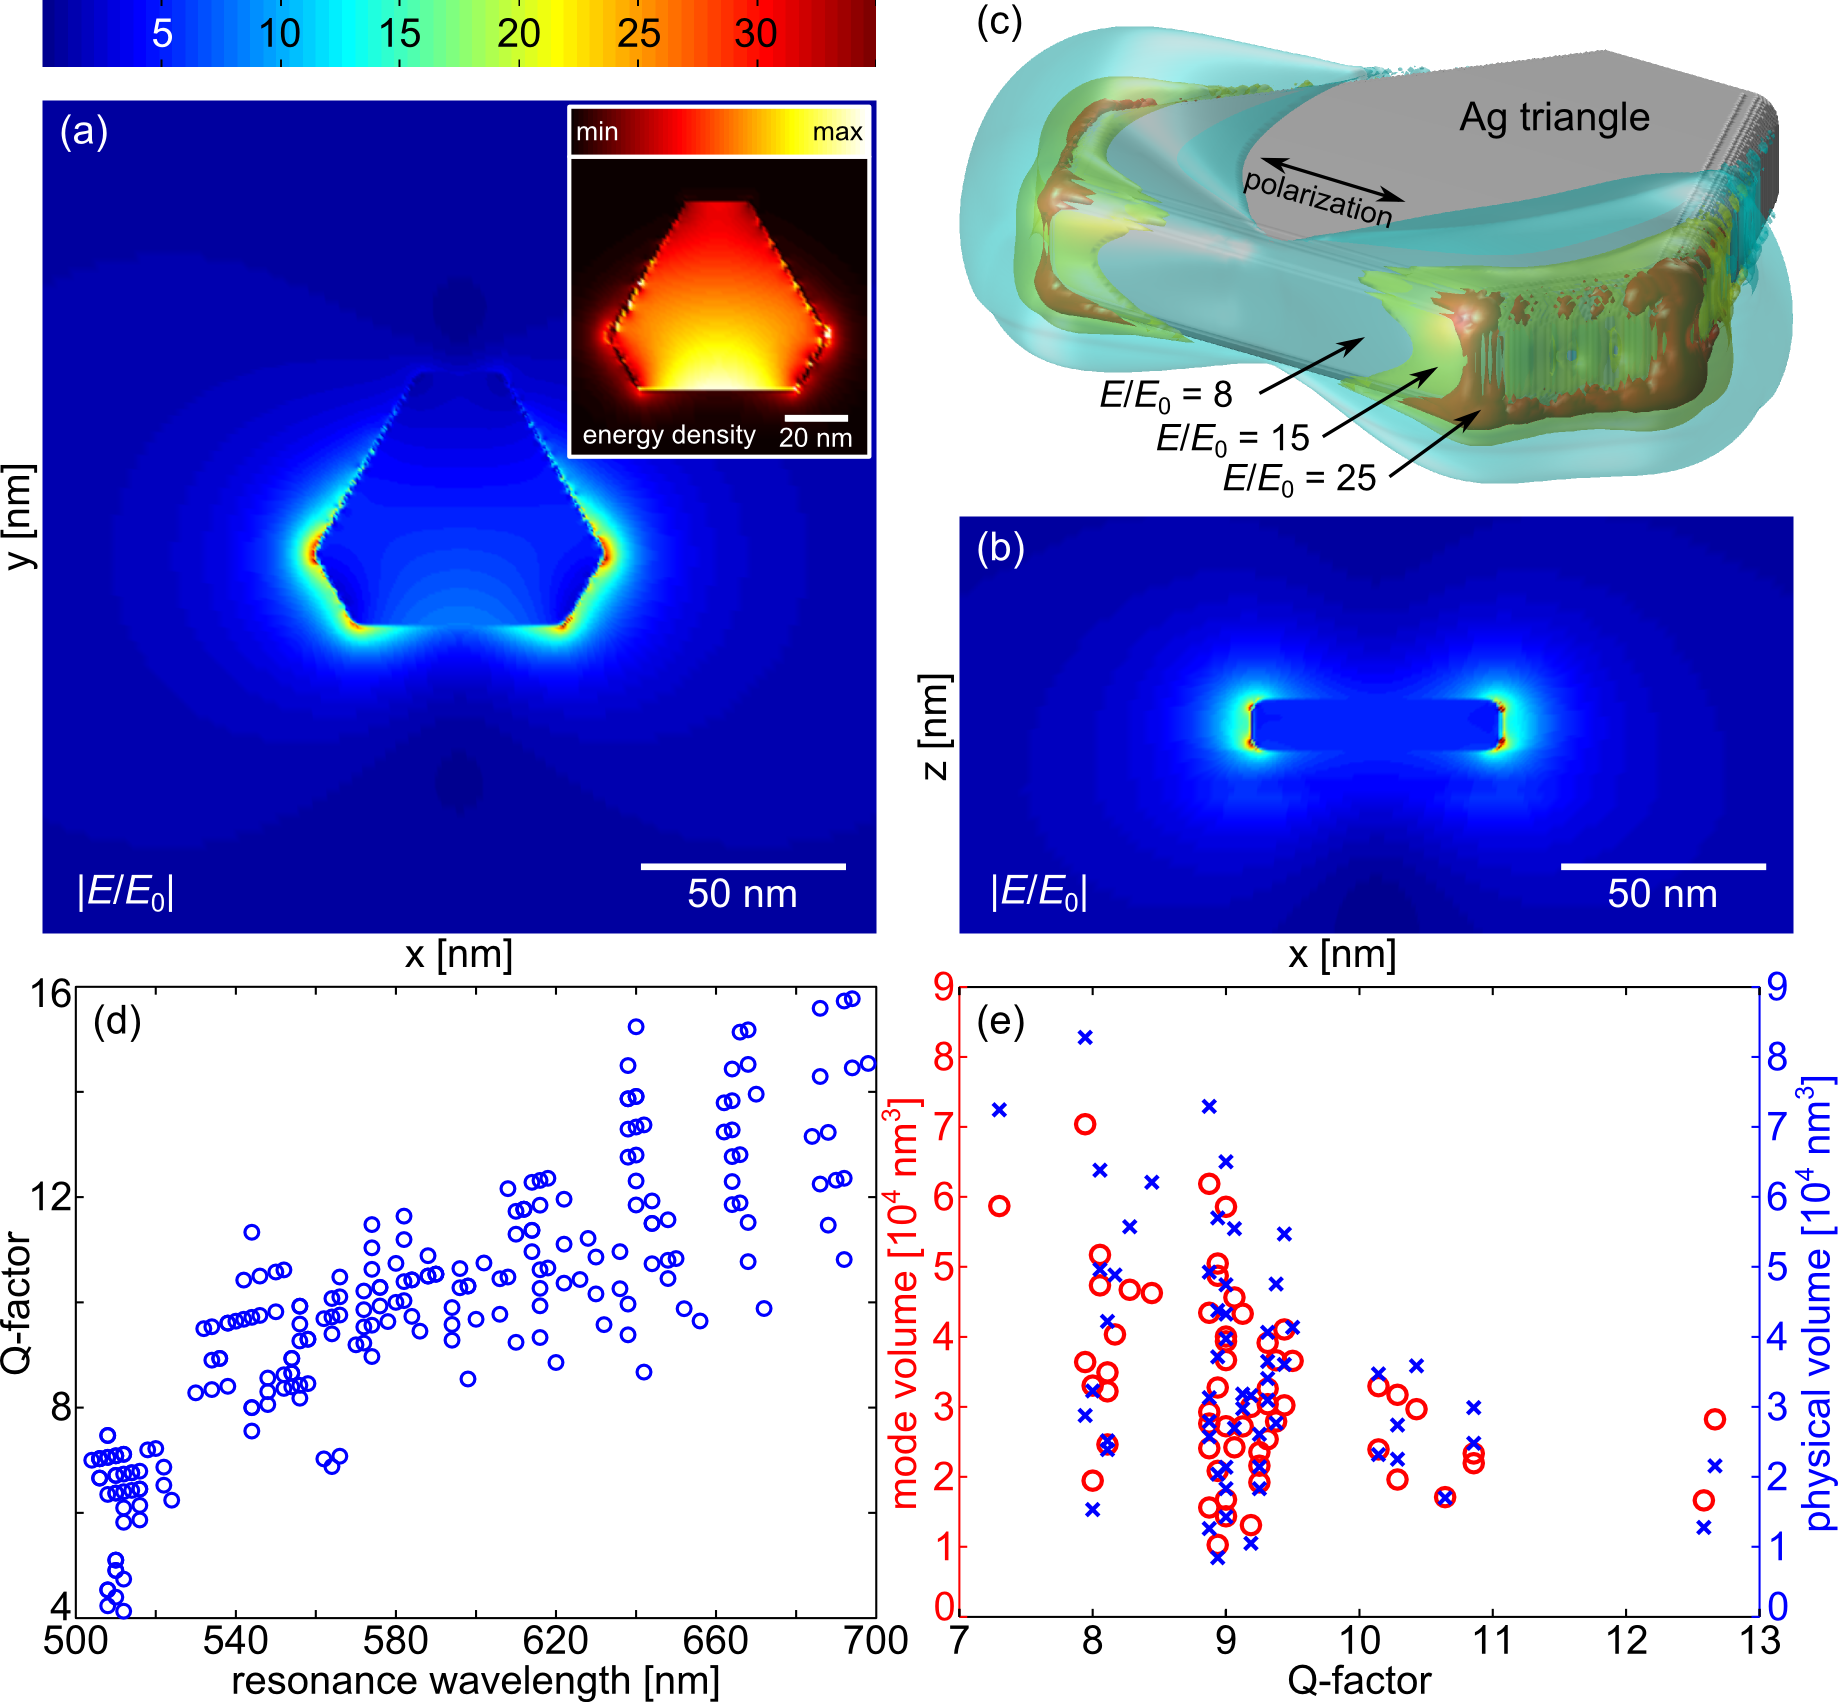
Mode volume calculation
The mode volume is calculated using
| (S1) |
however, with the modification to make the equation applicable to plasmons, where the term , where is the permittivity of the metal, is the Drude damping term, and Re[] and Im[] are, respectively, the real and imaginary parts Ruppin (2002); Koenderink (2010).
Calculating the mode volume from FDTD simulations may encounter problems that result from staircase meshing which may give very large field enhancements over volume spanning one or at most a few pixels (nodes). This makes the denominator in the mode volume equation very large and make abnormally small. To mitigate this effect, we analyze the energy distributions in a number of nanotriangles and identify locations where it assumes maximum values due to physical, not numerical, effects. For triangles illuminated by linearly polarized light as in simulations the maximum energy density occurs along the long edge parallel to the polarization, see inset in Fig. S6a.
VIII S7: Numerical calculations of scattering and absorption cross-sections of nanoprisms interacting with J-aggregate sheets
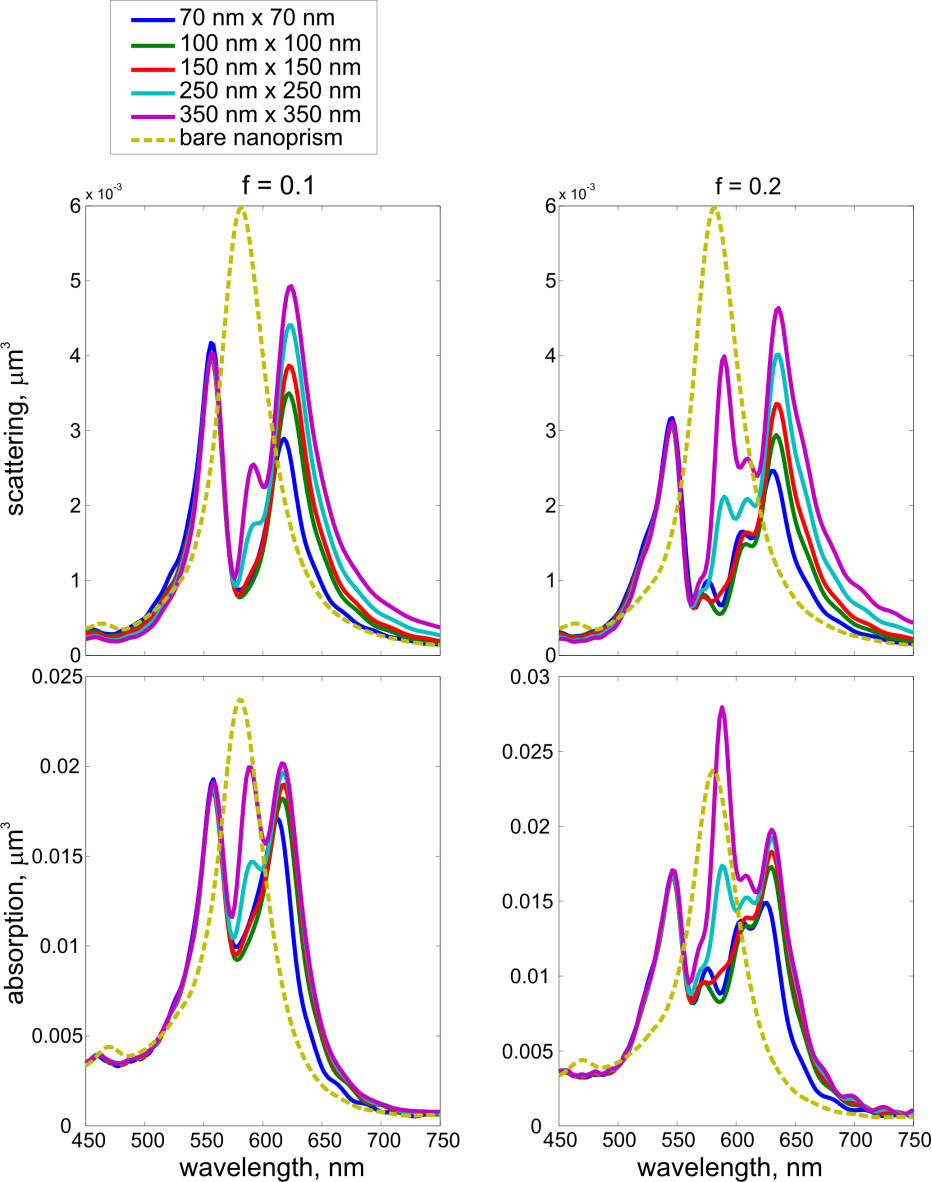
Note, that for the investigated triangles their absorption cross section is about 5 times larger than scattering. Thus, scattering spectra feature much lower dips due to coupling between the plasmon and the J-aggregate than absorption spectra. Solid lines indicate coupled spectra for Ag triangles on a single rectangular sheet of J-aggregate ranging from 70 by 70 nm to 350 by 350 nm. Note, that very large sheets of J-aggregate with large should mark their presence by narrow peaks at the absorption line – these originate from molecules uncoupled or weakly coupled to the silver triangle. The upper limit of the oscillator strength is estimated based on the absorption cross-section of one exciton (15 molecules). For simplicity we assume a spherical structure with a Lorentzian line (50 meV linewidth) whose peak absorption we vary by changing the oscillator strength, with the volume given by the geometrical volume of 15 TDBC molecules (the volume of one TDBC molecule is approximately 0.5 nm3.). To match the literature reported value of cm2 we need to set with a sphere 7.5 nm3 in volume. However, this yields large negative permittivity values on the order of -10 (real part) and gives spectra not observed experimentally. In order to reliably match the measurements we need to reduce f (i.e. dilute the J-aggregate). Very good agreement is achieved for oscillator strengths on the order of . Assuming the effective volume of one molecule has to be 2.5 nm3, meaning that the estimated 1000 TDBC molecules ( excitons) coupled to the silver triangle occupy about 2500 nm3. If we further take that the sheets are approximately 3 nm thick, this means that the active molecules occupy a surface area on the order of 830 nm2, a value comparable or smaller to the geometrical cross section of a typical triangle. Assuming unpolarized light, the hot-spots around the triangle are concentrated at the corners (or narrower sides for a truncated triangle as in Fig. S6, though there we only show one polarization) and the total length of those corners and edges is about 220 nm. The fields extend laterally (with respect to the circumference) for at least a few nanometers, meaning that the area exposed to strongly enhanced near-fields is enough to fit a considerable amount of the estimated 1000 TDBC molecules.
IX S8: Fluorescence data for five exemplary nanoparticles with diverse coupling
Fluorescence of free TDBC J-aggregates in water solution exhibits a narrow (fwhm meV) spectrum peaking at 588 nm, i.e. with nearly zero Stokes shift Zengin et al. (2013). In contrast, fluorescence of J-aggregates interacting with silver nanoprisms is much broader, up to meV as in Fig. S8a, indicating strong interaction between plasmons and excitons. Similarly to photodegradation of scattering spectra observed in Fig. 3 of the main text, fluorescence of coupled J-aggregates also decays as a function of time, confirming it originates from the J-aggregates.
X S9: Control measurements on bare Ag nanoprisms
References
- Jin et al. (2001) R. Jin, Y. Cao, C. A. Mirkin, K. L. Kelly, G. C. Schatz, and J. G. Zheng, Science 294, 1901 (2001).
- van Burgel et al. (1995) M. van Burgel, D. A. Wiersma, and K. Duppen, The Journal of Chemical Physics 102, 20 (1995).
- Hilborn (1982) R. C. Hilborn, Am. J. Phys. 50, 982 (1982).
- Bingham et al. (2009) J. M. Bingham, K. A. Willets, N. C. Shah, D. Q. Andrews, and R. P. Van Duyne, J. Phys. Chem. C 113, 16839 (2009).
- Chen et al. (2011) S. Chen, M. Svedendahl, R. P. van Duyne, and M. Käll, Nano Lett. 11, 1826 (2011).
- Ruppin (2002) R. Ruppin, Phys. Lett. A 299, 309 (2002).
- Koenderink (2010) A. F. Koenderink, Opt. Lett. 35, 4208 (2010).
- Zengin et al. (2013) G. Zengin, G. Johansson, P. Johansson, T. J. Antosiewicz, M. Käll, and T. Shegai, Sci. Rep. 3, 3074 (2013).