Petersburg Nuclear Physics Institute, Gatchina, Russia
Departement für Physik, Universität Basel, Switzerland
Interference phenomena in the -wave in photoproduction
Abstract
The recent precise experimental results for the photoproduction of -mesons off the neutron measured with the Crystal Ball/TAPS calorimeter at the MAMI accelerator have been investigated in detail in the framework of the Bonn-Gatchina coupled channel model. The main result is that the narrow structure observed in the excitation function of can be reproduced fully with a particular interference pattern in the partial wave. Introduction of the narrow resonance with the properties reported in earlier publications deteriorates the quality of the fit.
1 Introduction
So far photoproduction of mesons off the neutron has been much less investigated than the corresponding reactions off the free proton. The reasons are the obvious difficulties related to measurements using nucleons bound in nuclei (in most cases neutrons bound in the deuteron) as targets. There are not only the technical complications arising from the necessity to detect the recoil neutrons but also the difficulties in the interpretation of the results which are effected by nuclear Fermi motion and Final State Interaction (FSI) effects. Nevertheless, such reactions are important because they reveal the isospin structure of the electromagnetic excitation currents. The coupling of isospin resonances to is identical for protons and neutrons, but the couplings are isospin dependent. During the last few years quite some progress has been made for this branch of the photonuclear experimental program Krusche:2011 and first results have been reported for several reaction channels. The measurements of photoproduction off the neutron have attracted particular interest, because around 1 GeV of incident photon energy (1680 MeV) a narrow structure was observed in the excitation function Kuznetsov:2006kt ; Jaegle:2008ux ; Jaegle:2011sw . These observations are listed by the Particle Data Group Beringer:1900zz as one-star nucleon resonance . Remarkably, such a structure had been predicted by soliton models in the context of the conjectured baryon antidecuplet of pentaquarks. The nonstrange member of the multiplet with spin-parity Diakonov:1997mm should be electromagnetically excited more strongly on the neutron, should have a large decay branching ratio to , an invariant mass around 1.7 GeV, and a width of a few tens of MeV Diakonov:1997mm ; Polyakov:2003dx ; N_1680 ; Arndt:2003ga ; all properties that are phenomenologically exhibited by the observed structure. If one treats this structure as a single isolated resonance, a mass of MeV and a width of MeV are determined. Assuming a constant angular distribution ( or ) and ignoring possible interference effects, the electromagnetic coupling strength is determined to GeV-1/2 Jaegle:2011sw or, respectively, to GeV-1/2 Werthmuller:2014 . The radiative width derived by Azimov et al. Azimov:2005 using the GRAAL data Kuznetsov:2006kt corresponds to GeV-1/2. The experimental values for the properties of are all in the predicted range for the nonstrange partner of the , an exotic baryon which was “discovered” in 2003. Shortly after, the evidence for its existence faded away in a number of precision experiments Burkert:2005ft ; Hicks:2012zz ; Liu:2014yva but evidence is reported in several more recent experiments Nakano:2008ee , Amaryan:2011qc (see, however, Anghinolfi:2012np ), and Barmin:2013lva .
In contrast to the history of the exotic pentaquark, the statistical significance of the structure observed in is undisputable. All experiments that searched for this structure came out with positive results, and the most recent measurements at the MAMI accelerator with deuterium Werthmuller:2014 ; Werthmuller:2013rba and also 3He targets Werthmuller:2013rba ; Witthauer:2013 established it beyond any doubts. Due to the full kinematic reconstruction of the - neutron final state, effects from nuclear Fermi motion - smearing out narrow structures - were removed so that a better estimate of the width of the structure became possible Werthmuller:2014 ; Werthmuller:2013rba . Monte Carlo simulations showed that the observed width of 5010 MeV (the natural width folded with the experimental resolution) corresponds to a natural width of only 30 MeV. Such a narrow width would be very unusual for a normal three-quark nucleon resonance with a mass of W1680 MeV. There is a possibly correlated, although very week effect, in McNicoll:2010qk where a narrow dip is observed at the same incident photon energy. An observation has also been reported for Compton scattering Kuznetsov:2010as . A measurement of the beam asymmetry for Compton scattering off protons suggested even two narrow structures with masses near 1680 and 1.720 MeV Kuznetsov:2015nla .
We have thus the akward situation that a resonance was predicted at about 1680 MeV in the soliton model, and a bump-like structure with exactly the right properties was found in experiments. However, there are serious doubts that this bump is related to the predicted pentaquark state. Here, one should not forget that not each bump observed in some excitation function is evidence for a resonance. There can be other effects, for example threshold cusps. In fact, it has already been tried to model this bump with various approaches. Apart from intrinsically narrow states Arndt:2003ga ; Choi:2006 ; Fix:2007 ; Shrestha:2012 ; Anisovich:2008wd , different coupled-channel and interference effects of known nucleon resonances have been discussed in the literature. The Gießen group claimed that the narrow peak in the photoproduction on the neutron can be explained as and coupled-channel effect Shklyar:2006xw ; Shyam and Scholten use interference effects between the , , and resonances to describe the peak Shyam:2008fr , Döring and Nakayama ascribe the peak to effects from strangeness threshold openings Doering:2009qr . The Bonn-Gatchina group demonstrated that the narrow peak can be explained naturally by interference effects in the wave Anisovich:2008wd , a conclusion which was confirmed independently - even though three years later - by Zhong and Zhao Zhong:2011ti .
Here, we come back to the idea first put forward in Anisovich:2008wd where two different scenarios for the bump structure in the CBELSA data Jaegle:2008ux where discussed. In the first scenario, the two resonances with spin-parity - and - and the interference between them was studied; this ansatz gave a good fit to the data. In the second scenario, a narrow resonance at 1685 MeV and with photo-coupling and decay branching ratio as predicted in Diakonov:1997mm ; Polyakov:2003dx ; N_1680 ; Azimov:2005 was introduced; this model gave a fit of equivalent quality. Thus the existence of was not supported but could not be ruled out. This situation has now completely changed with the new, very precise data measured by the Crystal Ball/TAPS experiment at MAMI Werthmuller:2014 ; Werthmuller:2013rba . In this paper we compare fits to the new data with the two scenarios discussed above and find a much better description without introduction of the resonance, which makes the interpretation of the bump-like structure as resonance improbable.
In the experimental publications describing the new data Werthmuller:2014 ; Werthmuller:2013rba , the same strongly simplified model as in Jaegle:2008ux ; Jaegle:2011sw was used. The model consists of a superposition of three Breit-Wigner functions without interference terms. the Breit-Wigner functions represent i) the narrow structure, ii) the standing for the full partial wave, and iii) the background contributions. The model served to extract phenomenological estimates for position and width of the observed bump.
It is obvious that a much refined analysis of the data is necessary and this is possible within the Bonn-Gatchina coupled channel approach, which was recently updated for reactions off neutrons Anisovich:2013jya . This paper discusses in detail new fits to the data within different scenarios and their implication to the nature of the observed structure. A comment-like short version of part of this analysis is already available on the arXiv Anisovich:2014hga .
The paper is organized as follows. In section 2 we summarize the experimental data used in this paper. Subsequently (section 3), we present some simulations; the aim is to introduce to the reader the patterns which may emerge from known input into a partial wave analysis. In section 4 we present our fits to the data imposing or not imposing the presence of a narrow resonance in the wave. A short summary is given at the end.
2 Data used in this analysis
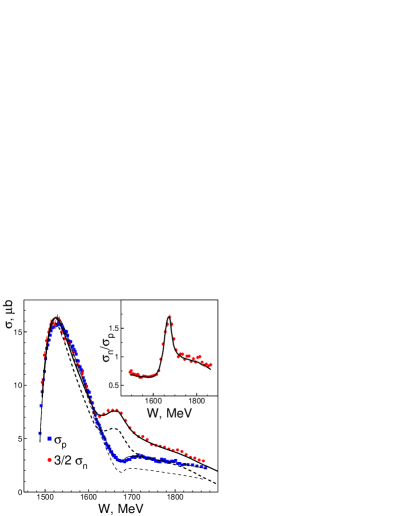
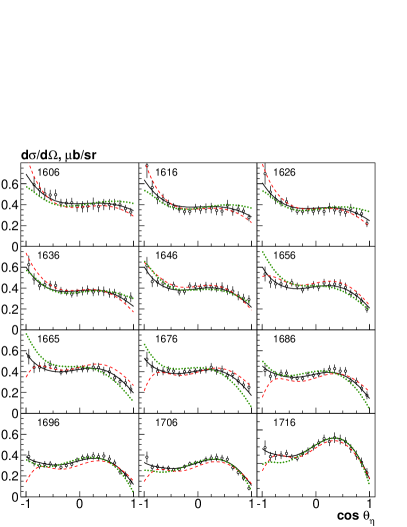
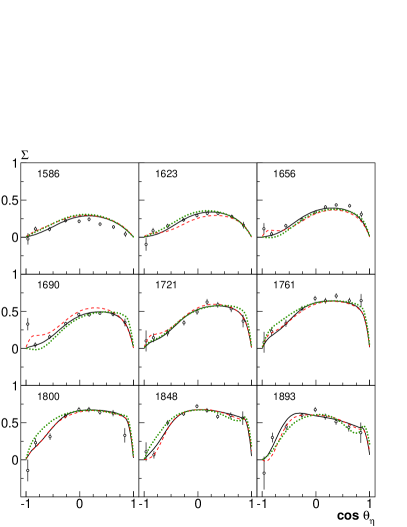
The main new data used in this paper are the differential cross section from MAMI Werthmuller:2014 ; Werthmuller:2013rba . The data – shown in Fig. 1 – were taken with a deuteron target but with full event reconstruction. Therefore these data do not suffer from the Fermi motion which usually smears out narrow structures in the cross section. The new data obtained also at MAMI with a 3He target Werthmuller:2013rba ; Witthauer:2013 are consistent with the deuteron data apart from the absolute scale which is influenced by FSI. They were therefore not included into the fits. In addition to these data we use GRAAL data on the beam asymmetry for Fantini:2008zz . The precision data from MAMI on McNicoll:2010qk are discussed to clarify the underlying physical processes. The shallow dip at 1680 MeV in the cross section reported in McNicoll:2010qk was described by introducing or by assuming that there is a large coupling to the wave Anisovich:2013sva . For pion production, the data on and on listed in Table 1 of Anisovich:2013jya and the recent data from MAMI Dieterle:2014blj on were used.
In all fits presented here, masses, widths and coupling constants for the decay of nucleon resonances are fixed except those for helicity amplitudes of resonances and those for and -channel exchange amplitudes. The fixed values are taken from our fits to a large body of elastic scattering and pion and photo-induced inelastic reactions (see Anisovich:2011fc ; Anisovich:2013vpa for references to the data included).
3 Simulations
Before we present the results of the partial wave analysis, we present some simulations which demonstrate what to expect given a particular hypothesis. The simulations are close to the experimental observations but the underlying model is simpler and focuses on specific aspects of the reaction.
3.1 Simulation of the narrow structure with and states
First we study the interference between a dominant wave and a narrow resonance in the wave. A typical example is shown in Fig. 2. Two contributions are present: provides a strong wave at low energies, a narrow resonance with a mass of 1680 MeV forms the second peak in the total cross section.
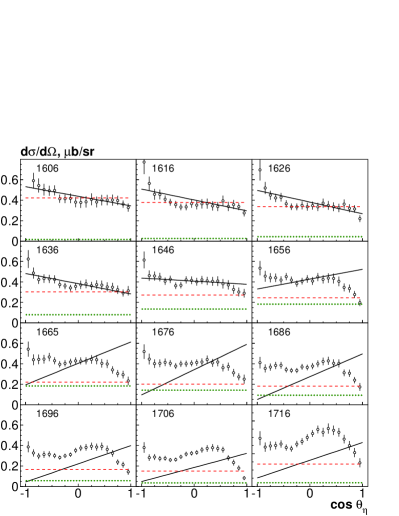
Without interference, both partial waves produce uniform angular distributions, see the dashed (red) and dotted (green) curves in Fig. 3. The interference between the two waves generates a linear angular distribution; its slope depends on the phase between the and waves. Overall, the area below the solid line is larger than the area below the dashed line: the narrow resonance brings in additional intensity. However, in most energy bins there are angular regions where the solid line is below the dashed one. These are regions of strong destructive interference.
The excitation functions at fixed angles are shown in Fig 4. The distributions show either a peak at the mass of the resonance or a diffractive pattern. We will see that the data are inconsistent with these assumptions. Note that the total cross section can be calculated from the differential cross section and from the excitation function by calculating the mean of all bins and multiplying with .
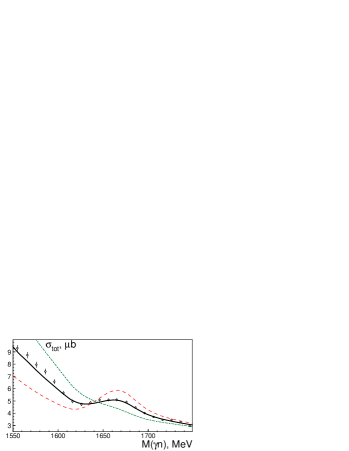
3.2 Simulation of the interference pattern
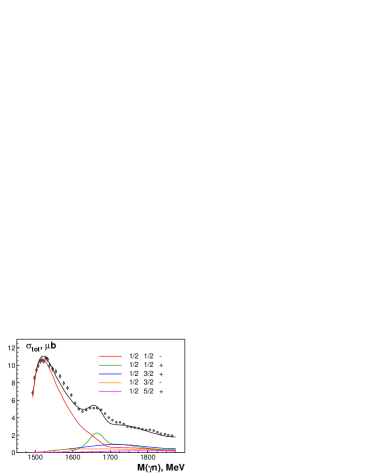
Figure 5 shows a simulation of the effect of the interference between the two resonances. The solid curve represents our best fit (as discussed below). The wave is represented by a K-matrix with three poles and smooth background Anisovich:2008wd (which contributes less than 10% to the cross section). Then we have multiplied the helicity amplitude of with a factor 2 or (-1). This has a very significant impact on the predicted cross section. When the helicity amplitude is increased (from to GeV-1/2), the peak structure grows significantly while only a small effect remains visible when the sign of the helicity amplitude is changed.
3.3 Simulation of a cusp
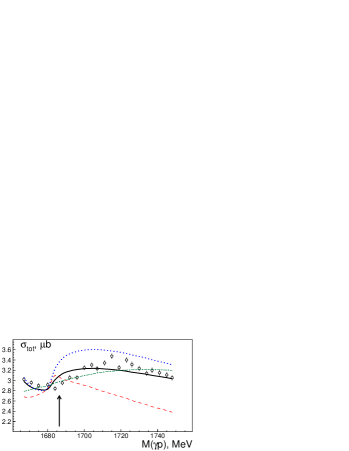
We show the effect of the opening of a new channel using data on . For this reaction a small dip in the total cross section at about 1.68 GeV was reported McNicoll:2010qk . The structure was soon assigned to the narrow nucleon resonance Kuznetsov:2011pe . A detailed study showed that the structure can be described well when the nucleon resonance with spin-parity is added to the list of resonances used in the BnGa partial wave analysis Anisovich:2013sva . However, an equally good fit was obtained when taking into account the opening of the reaction at 1720 MeV.
At the time when the study Anisovich:2013sva was made, data on photoproduction of mesons were not yet included in the BnGa analysis. With such data included, it turned out that the coupling of the partial wave would need to be considerably larger than the data on suggest. Hence we decided to study the effect of the opening of the reaction . In a recent analysis, we reported an ambiguity in the signs of coupling constants Anisovich:2013vpa . The new solution (BnGa2013-02) had a much more significant contribution than the solution (BnGa2011-02M), see Fig. 12 of Anisovich:2013vpa and is in an excellent agreement with the solution found by Rönchen et al. Ronchen:2012eg . Based on the new solution, the total cross section for should exhibit a clear structure at the threshold which is shown in Fig. 6. This is the case, indeed. The figure shows the expected distribution (solid curve) and curves which are predicted for the case of vanishing coupling, for a coupling multiplied by a factor 2, and for a factor (-1). The solid line does not match the data points exactly but the effect of the threshold is clearly seen. Note that the errors correspond to statistical errors only. The importance of the coupling for the description of structure around 1700 MeV wave was stressed by M. Döring (see Doring:2012zz and references therein).
4 Partial wave analysis of the data
We start our analysis from the solutions reported in Anisovich:2013jya . These solutions were obtained by fitting almost the full data base on , , and on .
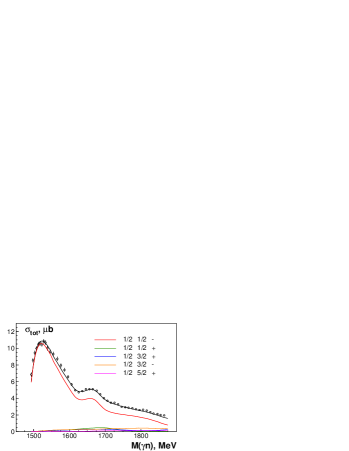
4.1 Fits with no narrow nucleon resonance


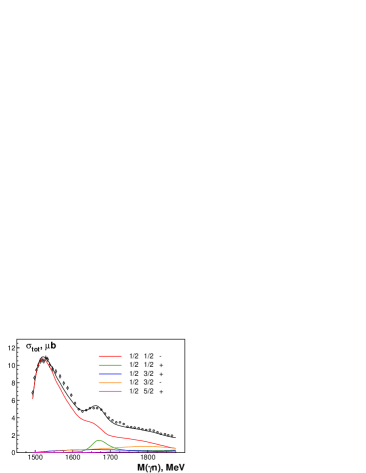
First, we fitted the data with conventional nucleon resonances only. Figure 7 shows the total cross section with the fit and the most significant partial wave contributions. Clearly, the wave is dominant; the fit finds small contributions from the , , , and waves. In the fit, we use statistical and systematic errors added quadratically. The fit returns values per data point which are often smaller than . This is not surprising since several sources of systematic uncertainty vary slowly with energy or are constant. Using the statistical errors only, typical values per data point are slightly above 3, indicating the need for error contributions beyond the statistical errors. The conclusions of the paper are not affected when the systematic errors are included or neglected.
 |
 |
 |
 |
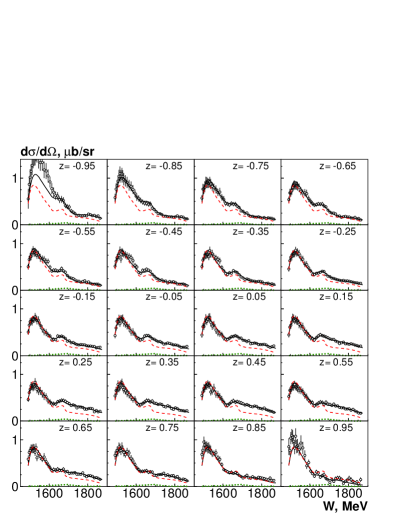
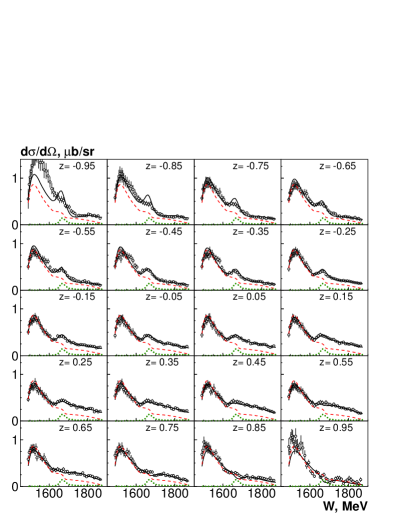
The quality of the fit can be judged by inspecting Figs. 8 and 9. A of 0.91 per data point was achieved. A large fraction of the stems from the most backward production angle (). In Fig. 8, a significant excess of data compared to the fit is seen in this angular range at low energies ( MeV).
The angular distributions (Fig. 9) suggest that this excess might be artificial. In this mass range, most backward data points seem anomalously high. The detection efficiency for these points (see Fig. 13 in Werthmuller:2014 ) is much lower than for the second point in the angular distributions and the systematic uncertainty is larger. This small excess also explains the small discrepancy between data and fit in the total cross section around 1580 MeV (Figs. 1, 5, and 7). We conclude that an excellent fit to the data Werthmuller:2014 ; Werthmuller:2013rba can be achieved without introducing a narrow resonance . In the 1610 - 1710 MeV mass region, the per data point is 0.48.
4.2 Fits imposing a narrow nucleon resonance
In the next step we investigated the scenario with a narrow resonance interfering with the partial wave. We added a resonance in the 1680 MeV mass region. A fit with free width and real coupling converged to a solution with a very broad resonance (more than 200 MeV) and a very weak coupling. The improvement in was negligible.
We then imposed contributions from a resonance with properties corresponding to the phenomenologic fits in Werthmuller:2013rba : mass MeV, width MeV, and [GeV 10-3] = [GeV 10-3]. For we assumed, alternatively, to have a positive or a negative sign. (When complex values were admitted, the overall improved slightly but the restricted to the 1620 - 1720 MeV region was worse.)
| Fit | Mass | Width | Phase | |||||
|---|---|---|---|---|---|---|---|---|
| stat. + syst. errors | stat. errors only | |||||||
| - | - | - | - | 0.48 | 1.81 | 3.10 | 2.10 | |
| 1671 | 35 | -12 | 1.34 | 2.80 | 9.35 | 2.92 | ||
| 1669 | 35 | +12 | 1.47 | 2.71 | 7.66 | 3.02 | ||
| 1671 | 35 | -12 | 1.50 | 2.50 | 9.33 | 2.90 | ||
| 1674 | 35 | 5 | 0.55 | 1.98 | 3.40 | 2.50 | ||
| 1671 | 35 | -3 | 0.54 | 1.95 | 3.30 | 2.55 | ||
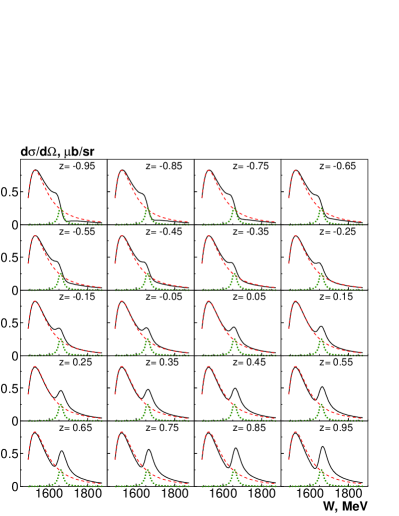
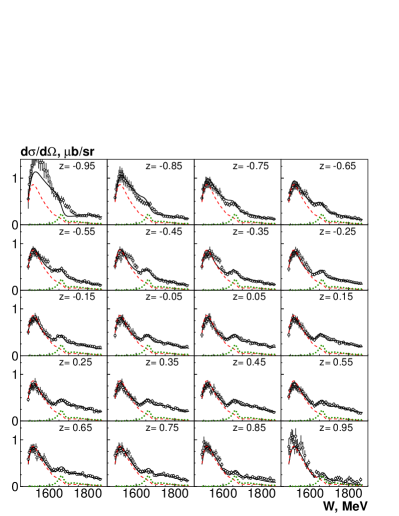
The total cross sections and the excitation functions in different bins of the production angle for the solutions with positive and negative product couplings are shown in Fig. 10.
The difference between the two solutions is seen very well. The solution with shows a strong peak at 1685 MeV for backward mesons, while the solution with exhibits a diffractive structure. For forward , the opposite holds true. The narrow resonance produces an asymmetry which is not supported in the data. For this asymmetry is partly interpreted in the fit by an increase in the contribution from the partial wave. The narrow interferes with the broad , destructively in Fig. 10, left panel, and constructively in Fig. 10, right panel. Interference with other waves cannot be observed after integration over the full angular distribution.
The data clearly disfavor the scenario with a narrow resonance. The resulting interference with the wave produces the expected forward - backward asymmetry in the angular distributions, which is not reflected in the experimental data. In a further step we have determined upper limits for the quantity . We find that the description of the differential cross section is still compatible with the data for .
4.3 Comparison of the quality of the two fits
In Table 1 we compare the quality of various fits. The best fit is achieved when no narrow is imposed. In the table we give the per data point for the differential cross section Werthmuller:2013rba and for the beam asymmetry Fantini:2008zz . The mass range for which the is calculated is restricted to MeV, the range which is most relevant for the existence of . Fits are performed using the statistical errors only and the statistical and systematic error added quadratically.
The fit in which no narrow is imposed gives the best and is our favored fit. It is shown in Figs. 11 as solid curve. The differential cross sections are perfectly described; the beam asymmetry at 1586 MeV shows a few points which are missed by the fit but in the next energy bin, fit and data are already fully consistent. In contrast to these findings, the fit with enforced contributions from a narrow exhibits significant deviations from data. In these fits, the mass is constrained by MeV, the width by MeV while the product branching ratio is fixed to GeV 10-3. Both solutions (with positive and negative ) provide a strong backward-forward asymmetry in the angular distributions which is not supported by the data. To compensate this asymmetry the fit increased the contribution from the partial wave. However, it leads to a deterioration for the description of the GRAAL beam asymmetry data. The differential cross section in the mass region 1600 - 1720 MeV and the GRAAL beam asymmetry data are compared with different fits in Fig. 11. The fits return the masses listed in Table 1 while the width goes to the boundary value. In one of the fits (not shown), was defined as a complex number with GeV 10-3. The fit gave a marginal overall improvement.
Finally, we determine upper limits for contributions. For , first visible deviations between data and fit show up and the total increases by slightly more than 25, corresponding to . Similar discrepancies are observed for . We conclude that – if a narrow exists in the wave – its production and decay branching fractions must obey .
Numerically, the fit converges to helicity amplitudes given in Table 2. Obviously, the two resonances interfere differently. The helicity ratios for the -photoproduction off protons, recent data on the double-polarization variables and from MAMI Akondi:2014ttg and on from ELSA Muller:2015tbd are included.
| T-matrix | GeV-1/2 | T-matrix | - | GeV-1/2 | |||||
| Phase | 105∘ | -211∘ | Phase | 85∘ | 015∘ | ||||
| K-matrix | K-matrix | - | - | ||||||
| SQT | SQT | - | - |
For the proton the helicity couplings of both states have like sign, for the neutron opposite sign. However, the hadronic phase involved in the decay of the two states (with respect to pion production) is predicted to be positive for the and negative for the Capstick:1993kb ; experimentally, the transition residue has a phase of for and for Anisovich:2011fc ; their relative phase is hence close to the predicted . Hence the resulting interference is destructive for the reaction and constructive for . It was pointed out in Boika:2014aha that the helicity amplitude is at variance with model predictions (see, e.g., Anisovich:2013jya for references to predictions), and in particular that the positive sign of the helicity amplitude is unexpected. It was shown that the value implies that the must have a large component.
This statement holds for the T-matrix coupling constants which give the helicity amplitudes at the pole position of the “dressed” resonance. These are complex numbers. In Table 2 we also list the K-matrix helicity amplitudes. The K-matrix pole characterizes the position of the pole when all decay modes are switched off. Thus, the K-matrix poles can be interpreted as pole position of the “undressed” resonance. In the neighborhood of important thresholds - in this case of the threshold - T-matrix and K-matrix coupling constants can differ substantially. The helicity amplitudes of the “undressed” resonance are real numbers. The “undressed” helicity amplitudes are in good qualitative agreement with the predictions of the Single-Quark-Transition model Burkert:2002zz and do not necessitate a large component in the wave function.
4.4 Interference in the wave in
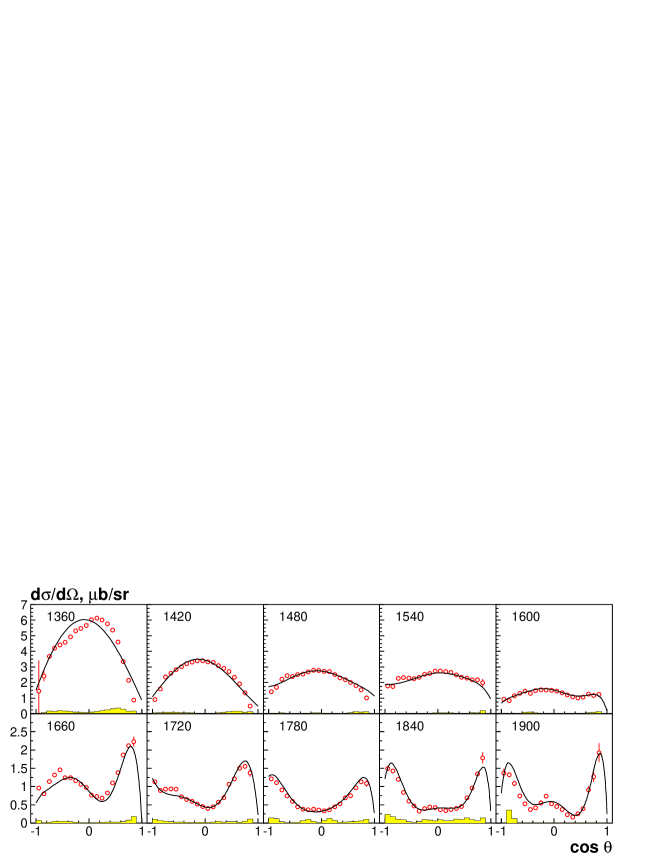
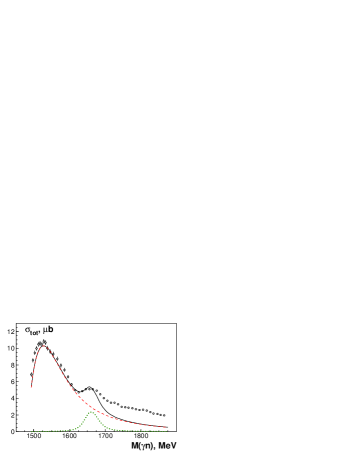
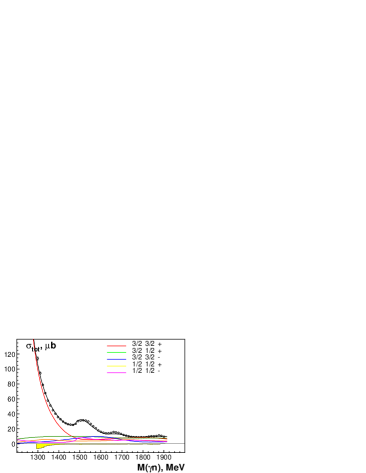
We now ask if a trace of the controversially discussed can be found in the reaction . In this case, the final state consists of a proton, a neutron, and a pion (instead of an ). The data are much stronger influenced by final state interactions than -photoproduction Dieterle:2014blj . With this warning we show in Fig. 12 the differential cross section and in Fig. 13 the total cross section for measured with the Crystal Ball/TAPS calorimeter at the MAMI accelerator Dieterle:2014blj . At low energy, the reaction is dominated by production; its tail exceeds all other contributions up to an invariant mass of 1450 MeV. The peak in the second resonance region is mainly assigned to , the small peak below 1700 MeV to . The figure also displays the contribution of the wave to the total cross section. The contribution is small and shows the opening of the threshold. In the mass region of interest (at 1680 MeV) the contribution shows no significant feature.
4.5 in Compton scattering
A trace of may have been found in the total cross section Kuznetsov:2010as and in the beam asymmetry for Kuznetsov:2015nla . We do not see how the two phenomena could possibly be related to the interference pattern in the discussed in this paper.
5 Discussion and Summary
We have scrutinized the evidence for the existence of a narrow resonance at 1685 MeV. A structure at this mass was reported from different reactions: i) a very significant bump at this mass in the total cross section was observed in three experiments, at GRAAL Kuznetsov:2006kt , ELSA Jaegle:2008ux ; Jaegle:2011sw , and MAMI Werthmuller:2014 ; Werthmuller:2013rba ; ii) the reaction showed a small anomaly at 1685 MeV McNicoll:2010qk ; and iii) an excess of events at about this mass was observed in Compton scattering Kuznetsov:2010as . The beam asymmetry for Kuznetsov:2015nla reported two structures, one at 1680 MeV. Intriguingly, the observed properties of the structure - when interpreted as a resonance - agreed very well with predictions of the soliton model for the non-strange member of a antidecuplet of pentaquark states.
i) The new and very precise data from MAMI enabled us to a much more solid partial-wave analysis of the reaction. Our fit results show that the bump in the total cross section and also the behavior of the angular distributions can be understood quantitatively as interference between the two well-known resonances in the wave, the and the states. This fit requires, however, that the sign of the electromagnetic helicity coupling of the is inverted for the neutron with respect to the current PDG Beringer:1900zz entry and also with respect to an early analysis in the framework of the BnGa model Anisovich:2008wd (but in agreement with a later BnGa analysis Anisovich:2013jya ). When a narrow resonance was enforced in the model, the quality of the fit deteriorated significantly. Consequently, there is no evidence for such a state from . It is worthwhile to mention that none of the papers reporting evidence for the structure took the interference between the two resonances into account when fitting the data. The and helicity couplings of determined here imply, however, that the resonance should have a large component in its wave function Boika:2014aha . This conclusion is avoided when the K-matrix poles are interpreted as “undressed” resonance and the K-matrix couplings are confronted with models. The “dressed” helicity amplitudes are not in conflict with model calculations.
ii) The angular distributions show that the bump in the total cross section is an S-wave phenomenon; it is not a P-wave enhancement.
iii) The anomaly at 1685 MeV in the total cross section of the reaction reported in McNicoll:2010qk could be traced quantitatively to the opening of the threshold. Since data on are included in the Bonn-Gatchina partial wave analysis, there is no free parameter available to fit the shape of the anomaly in the cross section. The small size of this anomaly rules out the possibility that the threshold might be responsible for the narrow bump observed in the total cross section.
iv) The small excess in the number of events in Compton scattering Kuznetsov:2010as at 1680 MeV. A study of the beam asymmetry for Compton scattering off protons reported two narrow structures with masses near 1680 and 1.720 MeV Kuznetsov:2015nla . Their origin needs further clarification.
We would like to thank M. Dieterle for providing the data on in numerical form. We acknowledge support from the Deutsche Forschungsgemeinschaft (within the SFB/TR16), the Schweizerische Nationalfonds, and the Russian Foundation for Basic Research.
References
- (1) B. Krusche, Eur. Phys. J. Special Topics 198, 199 (2011).
- (2) V. Kuznetsov et al., Phys. Lett. B 647, 23 (2007).
- (3) I. Jaegle et al. [CBELSA/TAPS Collaboration], Phys. Rev. Lett. 100, 252002 (2008).
- (4) I. Jaegle et al., Eur. Phys. J. A 47, 89 (2011).
- (5) K. A. Olive et al. [Particle Data Group Collaboration], Chin. Phys. C 38, 090001 (2014).
- (6) D. Diakonov, V. Petrov, and M. V. Polyakov, Z. Phys. A 359, 305 (1997).
- (7) M. V. Polyakov and A. Rathke, Eur. Phys. J. A 18, 691 (2003).
- (8) V. Kuznetsov and M. V. Polyakov, JETP Lett. 88, 347 (2008).
- (9) R.A. Arndt et al., Phys Rev. C 69, 035208 (2004).
- (10) D. Werthmüller et al., Phys. Rev. C 90, 015205 (2014).
- (11) Y.I. Azimov et al., Eur. Phys. J. A 25 325 (2005).
- (12) See V. D. Burkert, Int. J. Mod. Phys. A 21, 1764 (2006).
- (13) K. H. Hicks, Eur. Phys. J. H 37, 1 (2012).
- (14) T. Liu, Y. Mao and B. Q. Ma, Int. J. Mod. Phys. A 29, no. 13, 1430020 (2014).
- (15) T. Nakano et al. [LEPS Collaboration], Phys. Rev. C 79, 025210 (2009)
- (16) M. J. Amaryan, G. Gavalian, C. Nepali, M. V. Polyakov, Y. Azimov, W. J. Briscoe, G. E. Dodge and C. E. Hyde et al., Phys. Rev. C 85, 035209 (2012)
- (17) M. Anghinolfi, J. Ball, N. A. Baltzell, M. Battaglieri, I. Bedlinskiy, M. Bellis, A. S. Biselli and C. Bookwalter et al., Phys. Rev. C 86, 069801 (2012).
- (18) V. V. Barmin et al. [DIANA Collaboration], Phys. Rev. C 89, 045204 (2014).
- (19) D. Werthmüller et al. [A2 Collaboration], Phys. Rev. Lett. 111, 232001 (2013).
- (20) L. Witthauer et al.,; Eur. Phys. J. A 47, 89 (2013).
- (21) E. F. McNicoll et al. [Crystal Ball at MAMI Collaboration], Phys. Rev. C 82, 035208 (2010) [Erratum-ibid. C 84, 029901 (2011).
- (22) V. Kuznetsov et al., Phys. Rev. C 83, 022201 (2011).
- (23) V. Kuznetsov et al., Phys. Rev. C 91, no. 4, 042201 (2015).
- (24) Ki-Seok Choi et al., Phys. Lett. B 636 253 (2006) 253.
- (25) A. Fix, L. Tiator, and M.V. Polyakov, Eur. Phys. J. A 32 311 (2007).
- (26) M. Shrestha and D.M. Manley, Phys. Rev. C 86 045204 (2012), idem 86 055203 (2012).
- (27) A. V. Anisovich et al., Eur. Phys. J. A 41, 13 (2009).
- (28) V. Shklyar, H. Lenske, and U. Mosel, Phys. Lett. B 650 172 (2007).
- (29) R. Shyam and O. Scholten, Phys. Rev. C 78 065201 (2008).
- (30) M. Döring and K. Nakayama, Phys. Lett. B 683 145 (2010).
- (31) X. -H. Zhong and Q. Zhao, Phys. Rev. C 84, 045207 (2011).
- (32) A. V. Anisovich et al., Eur. Phys. J. A 49, 67 (2013).
- (33) A. V. Anisovich, E. Klempt, V. A. Nikonov, A. V. Sarantsev and U. Thoma, “Comment on ”Narrow Structure in the Excitation Function of Photoproduction off the Neutron”,” arXiv:1402.7164 [nucl-ex].
- (34) M. Dieterle et al., Phys. Rev. Lett. 112, 142001 (2014).
- (35) A. V. Anisovich et al., Eur. Phys. J. A 48, 15 (2012).
- (36) A. V. Anisovich et al., Eur. Phys. J. A 49, 158 (2013).
- (37) A. V. Anisovich et al., Phys. Lett. B 719, 89 (2013).
- (38) V. Kuznetsov, M. V. Polyakov, and M. Thurmann, JETP Lett. 94, 503 (2011).
- (39) D. Rönchen et al., Eur. Phys. J. A 49, 44 (2013).
- (40) M. Döring, AIP Conf. Proc. 1432, 297 (2012).
- (41) A. Fantini et al., Phys. Rev. C 78, 015203 (2008).
- (42) C. S. Akondi et al. [A2 at MAMI Collaboration], Phys. Rev. Lett. 113, 102001 (2014).
- (43) J. Müller et al. [CBELSA/TAPS Collaboration], in preparation.
- (44) S. Capstick and W. Roberts, Phys. Rev. D 49 (1994) 4570.
- (45) T. Boika, V. Kuznetsov and M. V. Polyakov, arXiv:1411.4375 [nucl-th].
- (46) Y. Wada, K. Egawa, A. Imanishi, T. Ishii, S. Kato, K. Ukai, F. Naito and H. Nara et al., Nucl. Phys. B 247, 313 (1984).
- (47) V. D. Burkert, R. De Vita, M. Battaglieri, M. Ripani and V. Mokeev, Phys. Rev. C 67, 035204 (2003)