Evidence for enhanced persistent emission during sub-Eddington thermonuclear bursts
Abstract
In a recent paper, we found evidence for an increase in the accretion rate during photospheric radius expansion bursts, quantified by a variable normalization factor on the pre-burst persistent emission. Here we follow this result up on a much larger sample of 1759 type I X-ray bursts from 56 sources. We show that the variable persistent flux method provides improvements in the quality of spectral fits for type I bursts, whether or not they reach the Eddington luminosity. The new approach has an estimated Bayes factor of 64 improvement over the standard method, and we recommend the procedure be adopted as standard for analysing type I bursts. We show evidence that the remaining discrepancies to a formally consistent spectral model are due to the burst component deviating significantly from a blackbody, rather than variations in the spectral shape of the persistent emission component. In bursts that do not show radius expansion, the persistent emission enhancement does not exceed 37% of the Eddington flux. We use this observation to constrain the Eddington flux of sources for which has not been directly measured.
1. Introduction
Type I X-ray bursts, discovered in the 1970s (Grindlay et al., 1976; Belian et al., 1976), arise from thermonuclear runaways in accreted H/He material on the surface of a neutron star (e.g., Woosley & Taam 1976; Strohmayer & Bildsten 2006). Gas flowing from a low-mass stellar companion accumulates on the surface of the neutron star (e.g., Woosley & Taam 1976; Joss 1977) . There it undergoes hydrostatic heating and compression, triggering unstable nuclear burning when the temperature and pressure are high enough (e.g., Fujimoto et al. 1981; Strohmayer & Bildsten 2006). These events are observed as a sudden increase in the neutron star’s X-ray luminosity, to many times the persistent level (see reviews by Lewin & Joss 1981; Lewin et al. 1993). Typical bursts exhibit rise times of 1–10 s, durations of a few tens of seconds to a few minutes (e.g., Galloway et al. 2008), and emit a total energy of – erg.
Type I bursts provide a probe into the conditions on the surface of the neutron star and yield insights into its internal structure (Lattimer & Prakash, 2007). Performing such measurements requires an accurate determination of the flux throughout the burst. This in turn necessitates a good understanding of the X-ray spectra since bolometric flux cannot be measured directly from photon count (Blissett & Cruise, 1979), and we must also know how to separate the flux from the expanding atmosphere from that arising from other sites in the neutron star system. One such contribution is the accretion disc itself. It emits X-rays through the conversion of gravitational potential energy of the inspiralling gas. This emission is present before the burst, and has traditionally been assumed to remain constant (both in spectral shape and in intensity) throughout the burst (e.g., van Paradijs & Lewin 1986; Lewin et al. 1993; Kuulkers et al. 2003; Galloway et al. 2008).
Muno et al. (2000) and Strohmayer & Brown (2002) allowed for the persistent emission to be suppressed entirely, by subtracting the instrumental background only, but did not find that the spectral fits were improved by doing so. In a study of neutron star radii derived from cooling tail spectra, Güver et al. (2012) noted the possibility of variations in the persistent emission spectrum and excluded bursts whose pre-burst persistent flux was more than 10% of the Eddington flux of that source, so that the contribution from persistent emission is always small. in’t Zand et al. (2013) studied a PRE burst from SAX J1808.43658 using combined Chandra and RXTE data and found that an observed excess of photons at both low and high energies can be well described by allowing a 20-fold increase of the pre-burst persistent emission. This approach was applied to 332 PRE bursts observed with RXTE by Worpel et al. (2013; hereafter WGP13), where we found that allowing the persistent emission to vary in intensity during a burst improves the spectral fits, and that the persistent emission usually increases temporarily to several times its pre-burst level.
Since the intensity of the persistent emission is expected to increase with increasing accretion rate, WGP13 interpreted this effect as a temporary accretion enhancement, possibly the result of the disk losing angular momentum via radiation drag. Other interpretations are possible; in’t Zand et al. (2013) argue for reprocessing of the burst spectrum in the accretion disc.
The ”variable persistent flux” approach has since been applied successfully by other studies (e.g., in’t Zand et al. 2013; Keek et al. 2014; Peille et al. 2014), and it is becoming clearer that bursts affect the accretion disc and can be used to probe accretion physics. In an investigation of a long duration burst from 4U 1636536, Keek et al. (2014) found that the persistent emission was enhanced by a factor of and also inferred a significant modification of the inner accretion disc. A depletion of the accretion disc through radiation drag during a burst was predicted by Walker (1992), who found in numerical simulations that the accretion rate after the burst can decline temporarily to half the pre-burst level. Peille et al. (2014) performed a study of quasi-periodic oscillations from 4U 1636536 and 4U 1608522, and found that these oscillations were suppressed for several tens of seconds after the burst. They attribute this phenomenon to a depletion of the inner accretion disc, though its fast recovery (5-10 times faster than the viscous time) remains a mystery. Clearly a greater observational and theoretical understanding of the behaviour of accretion onto type I bursters is required.
Disentangling the burst component of the spectrum from the persistent component is difficult, as the various components are usually spectrally degenerate. Furthermore, we do not have spatial resolution and therefore cannot attribute different spectral components to different sites in the neutron star system. This problem will be further complicated if, as we expect, both the persistent and burst components can vary in spectral shape during a burst. Indeed, it has long been known that the spectral shape of the persistent emission, as well as its intensity, is a function of accretion rate (Hasinger & van der Klis 1989; see also Lyu et al. 2014). There are, however, suggestions that between bursts the accretion spectrum remains constant in shape on timescales longer than those of a burst, though its intensity may vary (e.g., Thompson et al. 2005; Bagnoli et al. 2013; Linares et al. 2014). During a burst it is, of course, much more difficult to detect changes in the accretion spectral shape. A sudden loss of high energy ( keV) photons has been detected from several sources, but this effect has been attributed to rapid cooling of the corona and is not related to accretion rate (Maccarone & Coppi, 2003; Ji et al., 2013; Chen et al., 2013). Changes in the shape and intensity of the persistent emission during a very long (20,000s) burst from 4U 1636536 were reported by Keek et al. (2014), but variations on these timescales can happen in the absence of bursts, and the bursts we consider in this paper are very much shorter.
PRE bursts change the structure of the neutron star photosphere, and this is likely to cause the spectrum of the photosphere to deviate from its usual near-blackbody shape. Such changes are unrelated to the accretion spectrum. As pointed out by WGP13, these will confound spectral analyses of persistent emission during a burst. Such complications can be removed by considering non-PRE bursts, but care must be taken to account for lower sensitivity due to their intrinsically lower flux.
In this paper we investigate the relationship between accretion and type I bursts. We apply the fitting method of WGP13 to every type I burst detected by RXTE. In addition, we investigate the variability of the accretion spectra immediately before and after bursts, to determine whether our spectral fitting procedure can be confounded by rapid changes in the accretion spectrum. In §5 we develop a method for obtaining a lower bound on the Eddington flux for sources that have not yet been observed to undergo PRE bursts.
2. Data analysis
We used observational data from the Rossi X-Ray Timing Explorer (RXTE), publicly available through the High-Energy Astrophysics Science Archive Research Centre (HEASARC)111See http://heasarc.gsfc.nasa.gov. The observations date from shortly after the satellite’s launch on December 30, 1995 to the end of the RXTE mission on January 3, 2012. Our sample of type I bursts is based on the burst catalogue of (Galloway et al. 2008; hereafter G08), with the addition of 880 type I bursts detected after the publication of that paper. The entire RXTE burst catalog forms part of the Multi-INstrument Burst Archive (MINBAR)222 see http://burst.sci.monash.edu/minbar.
We classified type I bursts as either belonging to the photospheric radius expansion (PRE) class of bursts, or not, according to the criteria for radius expansion described in §2.3 of G08. In brief, these criteria define radius expansion as an increase of the surface area of the photosphere together with a decrease in its temperature. A small number of bursts fulfil some, but not all, of the criteria and are classified as ”marginal” PRE bursts.
Our data reduction procedures are the same as those in §2 of WGP13, unless otherwise stated, and we refer the reader to that work for further details. To estimate and remove the instrumental background we used the full-mission, “bright” source (¿40 counts s-1) models released 2006 August 6 with the pcabackest tool. Table 2 lists interstellar absorption column densities for all burst sources and the references from which these were drawn; the table includes several sources that were not investigated in WGP13 because they have no PRE bursts in the MINBAR catalog.
| Source | Non-PRE Bursts | PRE bursts | SWFCaaBeppoSAX Wide-Field Camera | SBCbbSupplemental Burst Catalog (see table 6) | Reference | ||
|---|---|---|---|---|---|---|---|
| cm-2 | erg s -1 cm-2 | ||||||
| 4U 1746-37 | 22 | 3 | 0 | 2 | 0.3 | 1 | 5.8 1.4 |
| MXB 1659-298 | 11 | 12 | 0 | 0 | 0.2 | 2 | 17.0 4.0 |
| Aql X-1 | 52 | 12 | 0 | 0 | 0.4 | 3 | 99.6 21.3 |
| SAX J1810.8-2609 | 4 | 1 | 1 | 0 | 0.3 | 4 | 111.2 2.5 |
| IGR J17480-2446 | 277 | 0 | 0 | 0 | 0.5 | 1 | ccNo PRE burst has been observed from this source |
| Cyg X-2 | 34 | 7 | 0 | 0 | 0.1 | 5 | 13.1 2.1 |
| GS 1826-24 | 67 | 0 | 0 | 0 | 0.4 | 6 | |
| XTE J1709-267 | 2 | 0 | 0 | 0 | 0.4 | 7 | |
| 4U 1820-30 | 0 | 16 | 34 | 7 | 0.2 | 1 | 57.1 7.7 |
| SAX 1808.4-3658 | 1 | 8 | 2 | 0 | 0.1 | 8 | 230.1 13.2 |
| GX 17+2 | 5 | 2 | 0 | 4 | 1.9 | 9 | 13.3 2.5 |
| Rapid Burster | 19 | 0 | 0 | 0 | 1.7 | 10 | |
| IGR J17473-2721 | 2 | 0 | 0 | 0 | 3.8 | 11 | 113.5 12.1 |
| Cir X-1 | 13 | 0 | 0 | 0 | 0.7 | 12 | |
| HETE J1900.1-2455 | 0 | 7 | 0 | 0 | 0.2 | 13 | 123.9 10.6 |
| 4U 2129+12 | 5 | 1 | 1 | 1 | 0.0 | 1 | 40.8 1.6 |
| 1M 0836-425 | 17 | 0 | 0 | 0 | 2.2 | 14 | |
| 4U 1735-444 | 7 | 10 | 0 | 0 | 0.1 | 15 | 34.2 5.6 |
| 1A 1744-361 | 3 | 0 | 0 | 0 | 4.5 | 16 | |
| 4U 1722-30 | 0 | 3 | 23 | 1 | 0.8 | 1 | 61.7 12.4 |
| GX 3+1 | 1 | 2 | 0 | 1 | 1.6 | 17 | 59.9 0.9 |
| EXO 1745-248 | 15 | 2 | 0 | 0 | 3.8 | 1 | 69.0 0.2 |
| XTE J1739-285 | 6 | 0 | 0 | 0 | 2.0 | 18 | |
| 2S 0918-549 | 1 | 2 | 3 | 0 | 0.3 | 19 | 119.2 12.4 |
| Ser X-1 | 11 | 6 | 0 | 0 | 0.4 | 5 | 29.4 7.1 |
| GRS 1741.9-2853 | 1 | 4 | 1 | 0 | 11.3 | 20 | 35.3 10.9 |
| 2E 1742.9-2929 | 65 | 1 | 0 | 0 | 1.2 | 18 | 37.8 1.4 |
| 4U 1728-34 | 30 | 64 | 0 | 0 | 2.6 | 21 | 95.0 8.4 |
| XB 1832-330 | 0 | 1 | 0 | 0 | 0.1 | 1 | 33.7 4.4 |
| IGR J17511-3057 | 7 | 0 | 0 | 0 | 0.6 | 22 | |
| 4U 1608-522 | 28 | 18 | 5 | 0 | 0.9 | 23 | 167.2 26.0 |
| GRS 1747-312 | 1 | 1 | 0 | 0 | 1.4 | 1 | 13.4 4.4 |
| XTE 1814-338 | 27 | 0 | 0 | 0 | 0.2 | 18 | |
| XTE J1723-376 | 2 | 0 | 0 | 0 | 7.9 | 18 | |
| 4U 1254-69 | 3 | 0 | 0 | 0 | 0.3 | 24 | |
| 4U 1702-429 | 43 | 5 | 3 | 0 | 1.9 | 18 | 87.7 4.5 |
| SAX J1750.8-2900 | 3 | 2 | 1 | 0 | 0.9 | 18 | 54.1 2.1 |
| XTE J1701-462 | 1 | 2 | 0 | 0 | 2.0 | 25 | 43.4 1.4 |
| XTE J1810-189 | 3 | 1 | 0 | 0 | 4.2 | 26 | 54.2 1.8 |
| EXO 0748-676 | 143 | 5 | 0 | 0 | 0.8 | 27 | 46.5 4.6 |
| 4U 1916-053 | 1 | 12 | 0 | 0 | 0.3 | 28 | 30.6 3.6 |
| XTE 2123-058 | 3 | 0 | 0 | 0 | 0.1 | 29 | |
| XTE 1759-220 | 5 | 3 | 0 | 0 | 2.8 | 18 | 15.7 0.8 |
| 4U 1636-536 | 269 | 76 | 2 | 0 | 0.2 | 5 | 72.6 9.1 |
| IGR 17191-2821 | 5 | 0 | 0 | 0 | 0.3 | 30 | |
| SLX 1744-300 | 10 | 0 | 3 | 0 | 4.5 | 31 | 13.9 3.1 |
| SAX J1748.9-2021 | 16 | 11 | 0 | 0 | 0.5 | 1 | 38.0 6.0 |
| 4U 1323-62 | 35 | 0 | 0 | 0 | 2.4 | 32 | |
| KS 1731-260 | 21 | 4 | 3 | 0 | 1.3 | 33 | 48.6 5.6 |
| XTE J1710-281 | 37 | 3 | 0 | 0 | 0.4 | 34 | 7.1 1.5 |
| IGR J17498-2921 | 0 | 1 | 0 | 0 | 1.2 | 18 | 51.6 1.6 |
| SAX J1747.0-2853 | 6 | 10 | 2 | 0 | 8.8 | 35 | 52.5 7.1 |
| SLX 1735-269 | 1 | 0 | 0 | 3 | 0.1 | 36 | 49.4 3.9 |
| 4U 1705-44 | 77 | 4 | 0 | 0 | 1.9 | 37 | 41.0 3.8 |
| 4U 0513-40 | 11 | 4 | 3 | 0 | 0.0 | 1 | 14.5 3.5 |
| SAX J1806.5-2215 | 4 | 0 | 0 | 0 | 1.0 | 18 |
References. — 1. Kuulkers et al. (2003); 2. Oosterbroek et al. (2001b); 3. Campana & Stella (2003); 4. Natalucci et al. (2000); 5. Asai et al. (2000); 6. in ’t Zand et al. (1999); 7. Jonker et al. (2003); 8. Wang et al. (2001); 9. Farinelli et al. (2007); 10. Frogel et al. (1995); 11. Altamirano et al. (2008); 12. Iaria et al. (2005); 13. Campana (2005); 14. Belloni et al. (1993); 15. Augusteijn et al. (1998); 16. Gavriil et al. (2012); 17. Oosterbroek et al. (2001a); 18. J. in ’t Zand 2014, private communication; 19. Juett et al. (2001); 20. Sakano et al. (2002); 21. D’Aí et al. (2006); 22. Papitto et al. (2010); 23. Keek et al. (2008); 24. Boirin & Parmar (2003); 25. Lin et al. (2009); 26. Krimm et al. (2008); 27. Homan et al. (2003); 28. Church et al. (1998); 29. Hynes et al. (2001); 30. Klein-Wolt et al. (2007); 31. Mori et al. (2005); 32. Church et al. (2005); 33. Cackett et al. (2006); 34. Younes et al. (2009); 35. Werner et al. (2004); 36. David et al. (1997); 37. Piraino et al. (2007)
2.1. Burst selection
We restrict our sample of type I bursts to exclude events that are unsuitable for analysis. We discarded 57 bursts for which no Standard-2 data was available, preventing estimation of the instrumental background. Some burst sources lie in crowded fields containing other LMXBs within the RXTE field of view. If the other source(s) were active at the time of observation, then their persistent emission would be confused with that of the burst source and it would be impossible to separate the persistent emission of the burst source from that of the other source(s). Such bursts need to be excluded from consideration. Our procedure for removing source-confused bursts is the same as WGP13 §4.1. A total of 168 bursts were excluded as being source confused. Our catalog also contains 16 type I bursts from the Rapid Burster taken during offset pointings to avoid confusion with the nearby 4U 172834. We also excluded 35 bursts whose radius expansion status was unclassifiable due to data gaps or very low flux, and 58 bursts classified as ”marginal” (i.e. satisfying only some of the criteria of §2.3 in G08).
2.2. Characterizing the persistent emission
As in the previous studies G08 and WGP13 we adopted the integrated X-ray flux for a 16-second interval prior to the start of each burst as the persistent emission. This spectrum includes a time-dependent contribution estimated as in WGP13. Subsequent model fits to each persistent (and burst) spectrum used the corresponding model spectrum estimated for that burst as background.
For each burst we fit the persistent emission with a set of nine alternative models in turn. These are summarized in Table 2, and are the same six persistent models as in WGP13, with the addition of wabs*disko, wabs*diskm, and wabs*(CompTT+gaussian). The first two of these include accretion rate explicitly as a variable parameter, making it possible to investigate the relationship between the normalization factor and . The latter was used by Peille et al. (2014) and we include it for completeness. We then selected the fit that gave the best (i.e. lowest) to represent the persistent spectrum for that burst. As shown in Figure 1, this suite of models provide statistically adequate fits so we regard these persistent models acceptable in the analysis of the bursts themselves.
There is no difference in the distributions of best-fitting persistent models between the PRE and non-PRE bursts. We assigned each model a distinct numerical label and performed a Kolmogorov-Smirnov test on the resulting distributions, with and a 95% probability that both are consistent with having been drawn from the same distribution.
A gas pressure dominated accretion disc (wabs*diskm) is not the preferred model for any persistent emission spectrum, indicating that this is not a good description of accretion discs in LMXB systems. Instead, we expect the disc to be radiation dominated, and possibly showing hard emission.
| XSPEC model | Number | Notes |
|---|---|---|
| of spectra | ||
| wabs*diskoaaSee Stella & Rosner (1984) | 160 | |
| wabs*diskmaaSee Stella & Rosner (1984) | 0 | |
| wabs*(bbodyrad+powerlaw) | 425 | nH fixed to literature values |
| wabs*(bbodyrad+powerlaw+gaussian) | 271 | nH fixed, Gaussian energy set to 6.4keV |
| wabs*(compTTbbSee Titarchuk (1994)) | 39 | nH allowed to vary |
| wabs*(bbodyrad+powerlaw) | 46 | nH allowed to vary |
| wabs*(gauss+bremss) | 321 | all parameters variableccAll parameters are variable for the generation of persistent emission models. Their values are subsequently frozen for the burst spectral fits in §2.3 |
| wabs*(bbodyrad+diskbbddSee XSpec manual (http://heasarc.gsfc.nasa.gov/xanadu/xspec/manual/manual.html) and references therein) | 183 | all parameters variableccAll parameters are variable for the generation of persistent emission models. Their values are subsequently frozen for the burst spectral fits in §2.3 |
| wabs*(compTT+gaussian)eeSee Peille et al. (2014) | 314 | nH fixed, Gaussian energy set to 6.4keV |
| Total usable spectra | 1759 | |
| Rejected due to source confusion | 168 | Other active sources in field |
| Background data missing or unusable | 57 | |
| No good persistent model fit | 6 | Minimum |
| Marginal radius expansion | 58 | |
| Radius expansion status unclassified | 35 |
For 6 bursts, no persistent emission model could be fit with . These bursts were excluded from further consideration.
2.3. Fitting procedure
As in WGP13 we first fit every burst spectrum with the standard approach: a blackbody spectrum, corrected for interstellar absorption using the appropriate hydrogen column density for the burst source (see Table 2). We use the recorded pre-burst emission, including the instrumental background, as the background for these initial fits. See G08 for further details regarding this fitting method. The standard fits provide a comparison model and spectral parameters, as well as sensible spectral parameters to seed the variable persistent emission fits.
We then re-fit all the burst spectra, replacing the background with the instrumental background, and adding a variable persistent emission component appropriate for that burst (§2.2). That is, we modelled the total spectrum as
| (1) |
where is the fitted spectrum as a function of energy , is the absorption correction due to interstellar hydrogen (see values listed in Table 2), is a blackbody spectrum with temperature and normalization , and is the instrumental background. is a model for the pre-burst persistent emission that also includes absorption, though for some persistent models we do not retain the same – this is a means to adjust the low energy end of the accretion spectrum and should not be interpreted as saying anything physical about the hydrogen column density. The accretion enhancement is quantified with the normalization factor. We have fit a total of 160,017 spectra.
3. Results
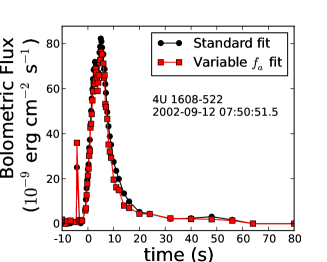
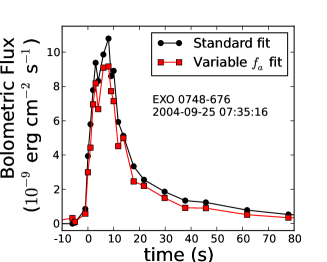
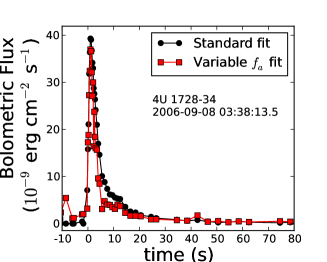
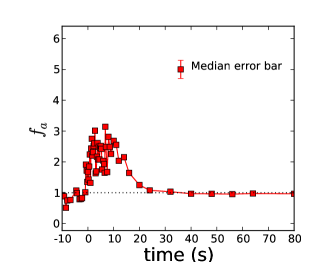
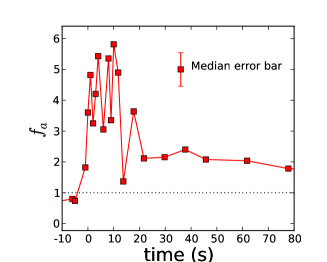
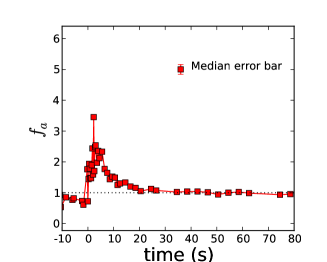
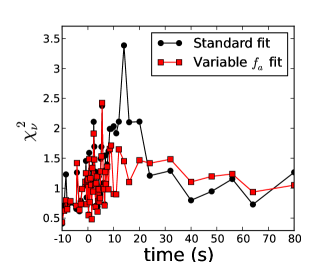
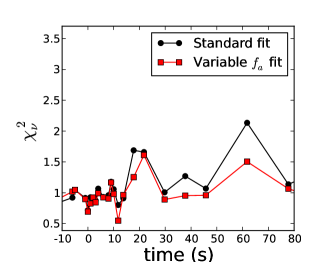
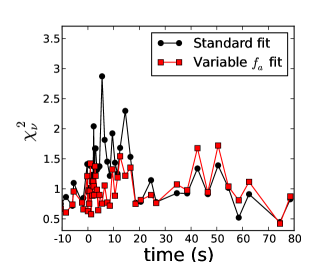
Profiles of fit parameters, using both methods, for three example bursts are shown in Figure 2. We have selected bursts from three different sources to illustrate the results. These plots clearly show that is enhanced to several times the pre-burst level, as found for radius expansion bursts by WGP13. This result is typical for all the bursts in our analysis. The for spectra preceding the burst appear to be slightly lower than unity, but this is an artefact of fitting these spectra with a model that includes a burst component which in reality is absent before the onset of nuclear burning. This causes some of the persistent flux to be misidentified as burst emission. Fitting the pre-burst spectra with just a normalization-variable persistent model gives results consistent with unity.
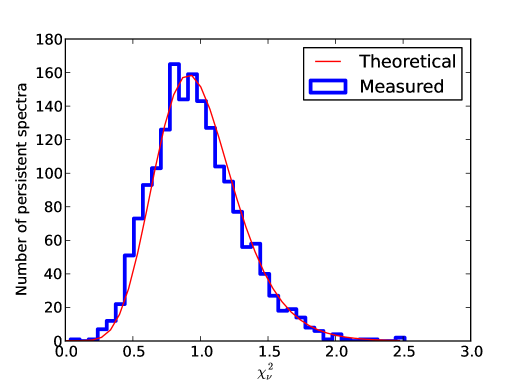
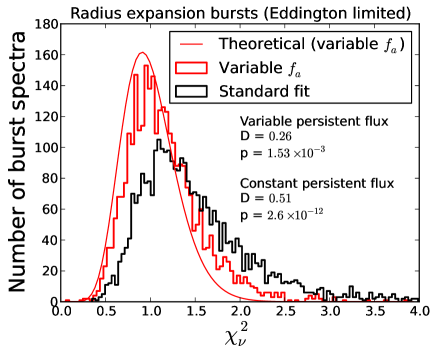
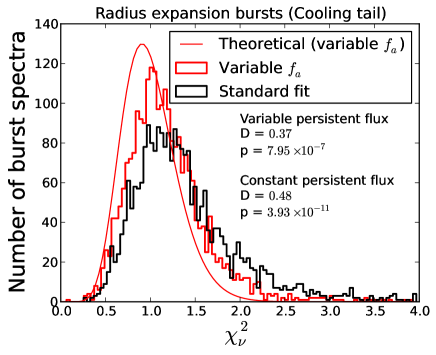
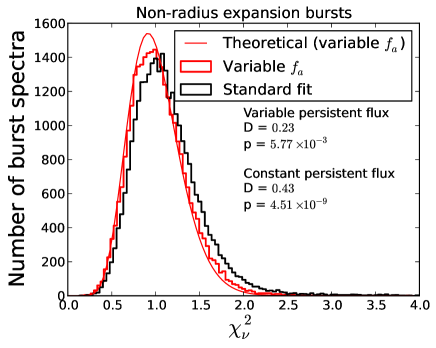
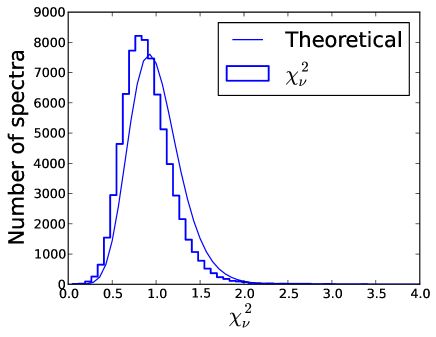
In Figure 3 we show the distributions of for the variable persistent normalization fits and the standard approach fits, compared with a theoretical distribution of for a model that adequately describes the data. Fits from both PRE bursts and non-PRE bursts are shown. We performed Kolmogorov-Smirnov tests on the measured distributions of against the theoretical. and values are listed on Figure 3, with the variable fits listed first. These results confirm what is visually evident in the Figure: the variable persistent normalization fits significantly improve the quality of the spectral fits for both radius expansion and non radius-expansion bursts. The spectral fits for PRE bursts are generally poorer than non-PRE bursts for both fitting methods and, although the variable persistent normalization method improves the distribution of , the deviation from a model that is statistically consistent with the data is still present. It is clear that radius expansion introduces a significant spectral effect on top of the variations induced by enhanced persistent emission. The second and third panels show that cooling tail spectra of PRE bursts are more poorly fit than spectra from non-PRE bursts. This may imply that PRE affects the disc and/or photosphere in a manner that persists for some time after the photosphere has returned to the surface of the star.
We assessed the relative improvement of the variable persistent flux treatment over the standard analysis by estimating the Bayes factor, as follows. We interpret the probabilities calculated from the K-S statistics as the global likelihood for each model, i.e. where is the set of values corresponding to the model fits, represents each fitting approach (model), and the priors. Even if this interpretation is not strictly correct, we expect that the K-S probability is proportional to the actual likelihood, so that the ratio of probabilities is a good estimate of the ratio of likelihoods. Following Gregory (2005), the other contribution to the Bayes factor calculation is the penalty imposed by the additional degree of freedom introduced with the variable persistent flux factor . Since the standard approach is a special case of the variable persistent flux approach (with fixed implicitly at 1), we compare the effective uncertainty for the former approach (arising from the Gaussian statistics on the pre-burst persistent spectra) with the prior for the latter approach, which is flat between . The median total counts in all the pre-burst spectra is approximately 9,000 counts, and so we adopt counts, giving a characteristic width of the prior in the standard approach of . The overall estimate of the Bayes factor is then
| (2) |
Thus, even taking into account the additional degree of freedom introduced by allowing the normalisation of the persistent flux to vary, we conclude that the variable persistent flux improves on the standard approach with a Bayes factor of 64.
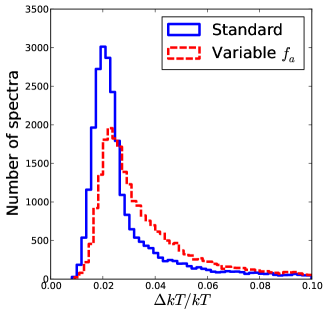
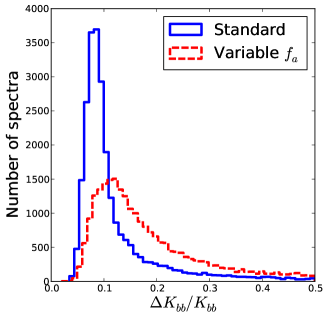
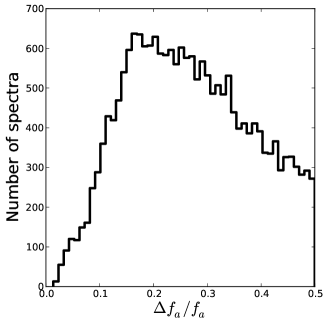
The addition of a third variable parameter to the model can have an adverse effect on the uncertainties in the fit parameters. In Figure 4 we compare the uncertainties in fit parameters between the two approaches. It is clear that introducing has a slight adverse effect on the uncertainty in the blackbody temperature. The uncertainties in blackbody temperature are, on average, 25% larger for the variable persistent flux method. The uncertainty in the blackbody normalization on average increases by 49%, to about 18% of the measured value. The uncertainty in is on average 27% of the measured value. The poor constraints on and blackbody normalization are likely due to the spectral similarity of the two components. Recently Barrière et al. (2014) showed a severe example of this problem in using the variable persistent flux method in a NuSTAR observation of GRS 1741.92853, in which the factor was not constrained at all. As they point out, the problem occurs when the pre-burst persistent emission is faint, and when it closely resembles the burst component in spectral shape.
WGP13 found, for PRE bursts, only a weak correlation between and burst flux. They found that, although most of the high values occurred during radius expansion, there was nonetheless great variability in when the burst flux was relatively constant. We have repeated this analysis for non-PRE bursts. We have taken all spectra for each burst between the beginning of the burst and the point at which burst flux declines below 10% of its peak value, and performed Kendall rank correlations on burst flux against for each burst. We found positive correlations in 1000 out of 1419 non-PRE bursts, of which 919 are at greater than 3 significance. Performing the same test on the cooling tails of PRE bursts, we found positive correlations in 299 out of 316. Of these, 286 were at greater than 3 significance. These numbers demonstrate that there is a more direct relationship between burst flux and for non-PRE bursts than for PRE bursts.
WGP13 found that, in PRE bursts, the variations in measured cannot be attributed to counting statistics. We repeated this test for all non-PRE bursts in our catalog. For all spectra obtained during non-PRE bursts we generated 100 simulated spectra using the standard approach spectral parameters, and incorporating counting statistics typical of the detector. We then fit these simulated spectra with the variable persistent normalization method, obtaining a standard deviation of measurements arising from counting statistics in the absence of any variation of persistent flux. We found real measurements greater than unity to significance in 214 of 62783. In the absence of a real effect we would expect at most one such case arising by chance. This experiment shows that enhanced persistent emission is present in non-PRE bursts as well.
Since PRE bursts are by nature brighter than non-PRE bursts, it is possible that the difference in between the two classes is simply due to superior signal-to-noise in the brighter bursts. To investigate this we took a subset of spectra from both PRE and non-PRE bursts, with bolometric fluxes between and erg s-1 cm-2 and blackbody temperatures between 2.0 and 2.5 keV, these quantities being measured with the standard approach. There were 331 spectra from PRE bursts and 655 spectra from non-PRE bursts in this segment of the parameter space. These had mean of and for non-PRE and PRE bursts respectively, and a K-S test indicated a probability of that these are drawn from the same distribution. This shows that the poorer spectral fits generally observed in PRE bursts are not due to better signal-to-noise in the bright bursts.
4. Is the persistent emission spectral shape constant?
Our approach of treating the persistent emission as a contribution of fixed shape depends upon the assumption that its shape does not change, at least not on timescales of the order of the burst duration, or to a degree sufficient to affect our spectral fits. WGP13 did not investigate this matter directly, but their finding that generally returns to its pre-burst level, with good , suggests that this assumption is not unreasonable. Similarly, Keek et al. (2014) and Peille et al. (2014) also report that the persistent emission returns to its original level soon after the burst. Thompson et al. (2005) and Bagnoli et al. (2013) have found that the persistent emissions of 4U 182624 and the Rapid Burster respectively are remarkably stable over kilosecond timescales between bursts. Linares et al. (2014) found variability over 10 minute periods in the intensity of the persistent emission of IGR J182452452, with no change in the shape of the persistent emission. Dipping systems, such as EXO 0748676 and X 1658298, show somewhat more variability (Sidoli et al., 2005; Oosterbroek et al., 2001b) on 1 m timescales, and the spectrum becomes harder during dips, as indicated by hardness ratios. However, the dips are due to obscuration in these high-inclination systems. Outside of dipping intervals, the hardness ratios are effectively constant. It is therefore likely that no change in the shape or intensity of the persistent emission is to be expected in the absence of burst luminosity on minute to hour timescales.
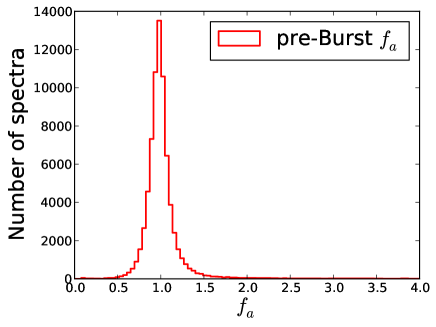
On shorter timescales, the pre-burst light curve is remarkably flat preceding bursts for 4U 1636536 (Nath et al., 2002), the Rapid Burster (Bagnoli et al., 2013), and 4U 160852 (Peille et al., 2014), and is also flat over a large range of accretion rates in IGR J174802446 (Motta et al., 2011). These works suggest that short-term intensity variations are not prevalent in the persistent emission preceding bursts. To gain further confidence that the persistent emission shape and intensity are not significantly variable on shorter timescales than minutes or hours, in the absence of a burst, we took every 0.25s pre-burst spectrum from every burst and fit it with just times the persistent model for that burst, i.e., no thermonuclear burst emission. The distributions of and are shown in Figure 5. This data typically covers a few tens of seconds prior to every burst. It is plain to see that is distributed tightly around unity, indicating that the persistent emission generally does not vary greatly in intensity on timescales of 1 s or less. The distribution also implies that the shape of the persistent emission is not changing appreciably, although of course the short exposure times and associated low photon counts make detecting such changes difficult.
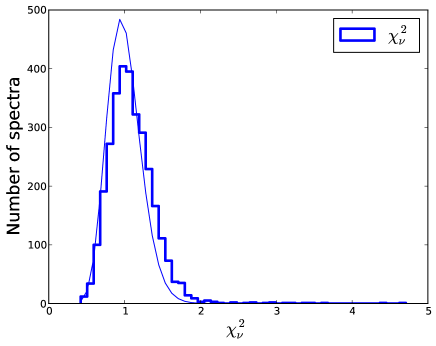
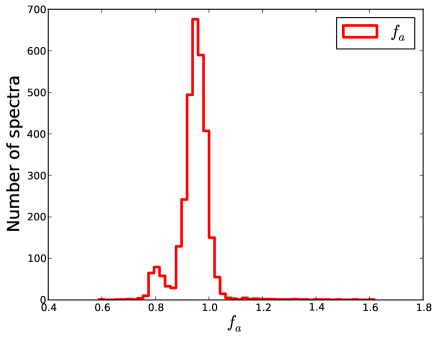
To test for more subtle spectral shape changes, we increased the exposure time to obtain better signal-to-noise. For the three bursts studied in Figure 2, and the fifteen bursts investigated by Peille et al. (2014) (see their Table 1), we inspected the RXTE Standard-2 data covering the entire observation. These are spectra binned into 16s intervals. We fit each of these spectra with the persistent model for that burst, with all parameters frozen, and normalization allowed to vary. We considered only spectra recorded within an hour before or after the burst but excluding those during the burst, to avoid contamination by the burst emission. That is, we excluded spectra recorded between the beginning of the burst (burst flux has reached 1/4 of the peak burst flux) and the end of the PCA data of the G08 catalog. This data typically covers a few minutes to an hour before and after the burst. We also excluded an eclipse of EXO 0748676 beginning at 2004-09-25 07:20:29, 15 minutes before the burst, when no flux was observed from the neutron star (see also Homan et al. 2003), and spectra occurring after a data gap towards the end of an observation of 4U 1636536 that began at 2001-09-05 04:56:51. We analyzed the distribution of and . These are plotted in Figure 6, showing that almost all of values measured this way are clustered tightly around . There is a smaller peak at around , dominated by two bursts, but visual inspection of their curves show their values to stay approximately constant throughout the observation.
The steadiness of both and over time suggests that the persistent emission does not change greatly in either shape or intensity on time scales up to an hour before and after a type I burst.
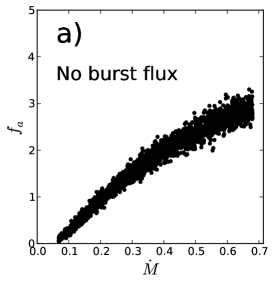
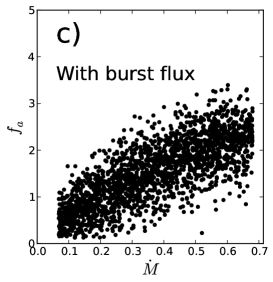
Finally, we investigated the extent to which we can detect changes in the accretion spectral shape if they really are present, assuming that a change in the intensity of the persistent emission reflects a change in the accretion rate. This is particularly necessary near the burst peak, since this is where the persistent emission spectral shape is most uncertain; we have already found that it returns to its original shape deep in the cooling tail. We selected a non-PRE burst from 4U 1636536 that uses the disko model (Stella & Rosner, 1984), recorded 2005 Apr 4, 10:48:43. For this burst PCUs 0 and 2 on RXTE were active. This model contains explicitly as a variable parameter and incorporates physically-motivated changes in the spectral shape. This model is assumed to be in equilibrium for this burst and does not take into account changes in its structure induced by a burst; there are as yet no theoretical spectra of a disk modified in this way, and we expect that the associated spectral shape will deviate from a blackbody to a similar degree, though not perhaps in the same manner.
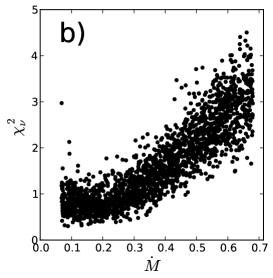
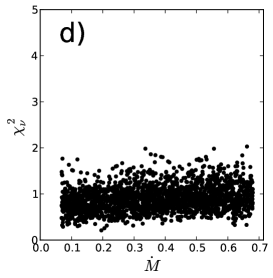
The best fit accretion rate was 0.205 and the peak was 3.3. The normalization of this persistent model was , where is the inclination and is the distance in units of 10 kpc. At an assumed distance of 6 kpc (Galloway et al., 2006), this gives an inclination of 72∘, in agreement with Pandel et al. (2008) and Casares et al. (2006), who also infer a high inclination (greater than , and respectively) for this system. The normalization was kept frozen in the subsequent analysis. We generated 2,000 simulated spectra, folded through a PCA response appropriate to the observed burst, of the wabs*disko model with taking random values between 0.067 and 0.667. We then fitted those simulated spectra with times the original persistent model. The measured and are given in Figure 7, left two panels. In the absence of burst emission we can clearly detect a change in spectral shape via the increase in with increasing as well as an increase in the intensity of the persistent emission. We then repeated the process, this time including a blackbody with temperature 2.0 keV and normalization representing a sphere with radius 10 km at a distance of 6 kpc (i.e., the surface of 4U 1636536). This we fit with the usual variable persistent flux approach (right two panels). It is evident that, although we can still detect enhanced persistent emission through an increased , we have lost the ability to detect a change in its spectral shape. This experiment gives us confidence that our approach of simply varying the normalization of the persistent emission will introduce no detectable systematic effects.
This analysis is not sensitive to changes in the persistent spectrum outside the 2.5-20 keV energy range we consider in this paper. in’t Zand et al. (2013) combined data from Chandra, which is sensitive at energies below 2keV, with RXTE data for a radius expansion burst from SAX J1808.43658. They obtained similar values as WGP13 did studying the same burst with only RXTE data, suggesting that changes in the persistent spectrum below 2.5keV are negligible. At high energies, there is evidence that the hard X-ray (¿30 keV) flux decreases during a burst, in apparent conflict with our result (Chen et al., 2013; Ji et al., 2013, 2014a, 2014b). However, this phenomenon is attributed to the rapid cooling of the accretion disc corona, which contributes the majority of the very hard X-rays. An increase in 2.5-20keV flux attributed to accretion rate change does not conflict with a simultaneous quenching of high energy photons through the cooling of the corona.
5. Eddington fluxes from non-PRE bursts
For neutron stars for which no radius expansion bursts have been observed, the only lower bound on their Eddington fluxes are the peak fluxes of their brightest bursts. A better knowledge of their Eddington fluxes would be of observational utility, as many of these sources show interesting properties: the prolific burster GS 1826-24 exhibits very regular bursts that are in close agreement with numerical models of X-ray bursts (e.g., Heger et al. 2007; Galloway & Lampe 2012). The 11 Hz pulsar IGR 174802446 is the most slowly rotating source that shows burst oscillations (Cavecchi et al., 2011), making that source an important test of burst oscillation models. Neither source has a single reported PRE burst. The Rapid Burster (MXB 1730-335) is our major source of knowledge about type II bursts, and has one reported PRE burst (Sala et al., 2012). This event, however, was detected by the Swift X-ray instrument and the measurement was not sensitive enough to constrain the Eddington flux to better than about 50% (see their Fig. 2).
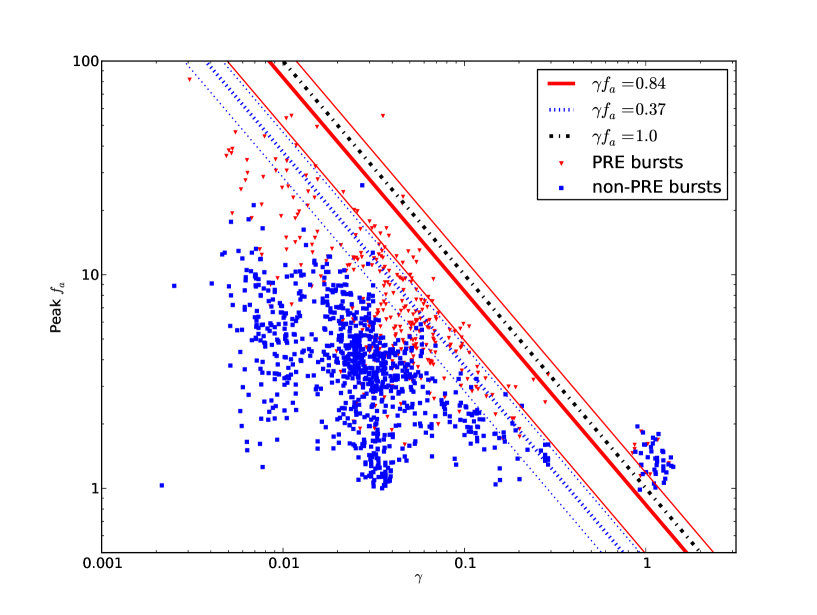
An interesting observation is that all the results of WGP13 fall below the line , where is the pre-burst accretion flux as a fraction of the Eddington flux, consistent with predictions of Burger & Katz (1983) and Miller & Lamb (1996); both works suggest that the Eddington accretion rate is a natural upper limit to . This observation raises the possibility of obtaining a lower bound on the Eddington flux for a given source, that is, , where is the bolometric flux of the pre-burst persistent emission.
In Figure 8 we show peak against for every type I burst detected by RXTE. For the non-PRE bursts appear to be bounded above by , where appears to be somewhat less than 0.5. This would give a lower limit on the Eddington flux roughly twice as constraining as the most conservative estimate . Determining requires knowing ; our method for determining the Eddington fluxes for PRE bursters is given in the Appendix.
We now describe a method by which we estimate the upper bound of that is reproducible and more objective than estimating by eye. We treat the measured values as normal distributions centered around their measured values, with standard deviations equal to the uncertainty in the , times . This normal distribution is given by
| (3) |
The fraction of this distribution lying above is
| (4) |
and so the total over all data points is
| (5) |
where is the number of data points.
The question is how to find . First we make a guess as to the value of and calculate an from this and the data points . Then we take a set of data points with random values between 0 and . We assign to each an uncertainty of , that is, a random point is given a measured uncertainty. This assumes the real data points are evenly distributed with uncertainties independent of their values, but the procedure can be modified to suit other assumptions. From this random set we calculate an expected total area () that can be compared to the real one (). If, for instance, then our guess for was too high and we try again with a lower . Once the s converge, we take this value to be . Making many realizations of the random set, we can get an expected . However, to avoid the analysis assigning too much weight to outliers, we take many bootstrap subsamples of the original data set and take the overall to be the average of those from the bootstrap samples; it also gives us uncertainties on .
Applying this procedure, we get for the PRE bursts and for the non-PRE bursts. We note that the relation is a phenomenological one and does not depend on any physical interpretation, though it is consistent with the requirement that the accretion luminosity not exceed Eddington. To test whether our new method gives a more stringent lower bound than the peak burst flux, we compared the two methods for every source for which ten or more non-PRE bursts have been observed, but excluding the rapid accretors Cyg X2 and GX+172. We also exclude SLX 1744300, as that source is difficult to distinguish from the nearby () SLX 1744299 (Skinner et al., 1990). We first apply the method to sources for which the Eddington flux is known, to make sure the new method never overestimates the Eddington flux. In 2 of 16 sources, the new method gave a greater lower bound than the brightest non-PRE burst, and in no case did the new method overestimate the Eddington flux beyond observational uncertainties. These results are shown in Figure 9.
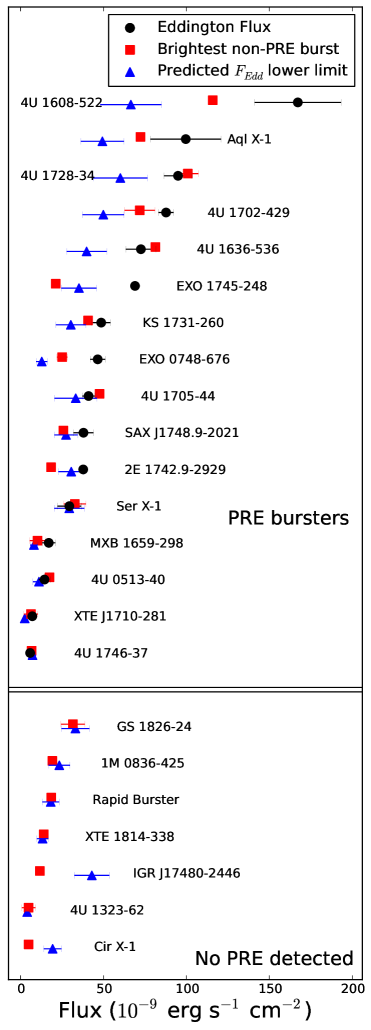
Applying the new method (with since is unknown) to sources with unknown Eddington flux, we get a better bound than the non-PRE bursts for the sources Cir X1 and IGR 174802446, with greater than and erg s-1 cm-2 respectively. IGR 174802446 is located in the globular cluster Terzan 5, with a known distance of about 5.5 kpc (e.g.,Papitto et al. 2011), and a hydrogen accreting neutron star with 1.4 would have an Eddington flux of 57 erg s-1 cm-2. Cir X1 is believed to be 7.8-10.5 kpc distant (Jonker & Nelemans, 2004). Our result suggests it is probably at the nearer end of that range, since the more distant value would give an Eddington flux of 16 erg s-1 cm-2 for a canonical neutron star, slightly higher than our estimate. We also get a marginally more constraining Eddington flux for 1M 0836425 of erg s-1 cm-2.
6. Conclusion
We have extended the variable persistent flux method developed by Worpel et al. (2013) and in’t Zand et al. (2013) to all type I bursts observed by RXTE. Our method gives superior spectral fits to type I burst spectra, whether these are radius expansion bursts or not. Our detailed conclusions are as follows:
i) The variable persistent normalization approach developed in WGP13 applies as well to non-PRE bursts as it does to radius expansion bursts. The quality of spectral fits generally improves, and the intensity of the persistent emission usually increases during a burst, typically by a factor of 3-4.
ii) The addition of a third variable parameter increases the uncertainties in the fit parameters. In particular there is a degeneracy between and blackbody burst component normalization, likely due to the indistinctness of the two spectral components.
iii) Photospheric radius expansion adds a confounding spectral effect, likely caused by the changing structure of the photosphere. When this is corrected for, by considering only non-PRE bursts, the spectral fits are much improved, to a Bayes factor of 64.
iv) Any remaining discrepancy from a blackbody plus variable persistent normalization model is likely to be due to a slight non-blackbody character to the burst emission, rather than spectral shape changes in the persistent emission. This is because changes in the shape of the persistent emission are not detectable in the presence of an additional burst component with the quality of the data currently available. Investigations into the response of the accretion spectrum to a burst transient are desirable, but must await more sensitive instruments such as the Large Observatory for X-ray Timing (Feroci et al., 2012).
v) We have found no evidence that the persistent emission spectrum changes shape on timescales of up to an hour before or after a burst, and no major changes in its normalization.
vi) For sources that have never shown a radius expansion burst, we can obtain a lower bound on their Eddington luminosity from the observation that the persistent emission enhancement for non-PRE bursts seldom exceeds a certain fraction (about 37%) of the Eddington flux. For three sources, this new lower bound was found to be a better constraint than the peak fluxes of the brightest (non-PRE) bursts for those sources.
We recommend that varying the normalization of the presistent flux be adopted as standard for analysing type I bursts, though care must be taken to account for the increased uncertainties in the fit parameters caused by the introduction of a third parameter.
Appendix
| Source | Burst Time | Instrument | Flux | Reference |
|---|---|---|---|---|
| (MJD) | () | |||
| GX 17+2 | 44749.0 | Hakucho | 9.3 1.0 | 1 |
| GX 17+2 | 44749.5 | Hakucho | 12.2 1.1 | 1 |
| GX 17+2 | 45194.8 | Hakucho | 10.1 1.1 | 1 |
| GX 17+2 | 45197.6 | Hakucho | 12.8 1.0 | 1 |
| 4U 2129+12 | 47454.7 | Ginga | 40.0 | 2 |
| SLX 1735-269 | 52897.7 | JEM-X | 57.6 9.6 | 3 |
| SLX 1735-269 | 53108.0 | IBIS/INTEGRAL | 64.0 | 4 |
| SLX 1735-269 | 56267.2 | MAXI/GSC | 48.0 3.0 | 5 |
| GX 3+1 | 53248.8 | JEM-X | 53.4 | 6 |
| 4U 1722-30 | 42666.0 | OSO-8 | 60.0 | 7 |
| 4U 1746-37 | 46317.0 | EXOSAT | 10.0 1.0 | 8 |
| 4U 1746-37 | 46318.0 | EXOSAT | 9.0 1.0 | 8 |
| 4U 1820-303 | 42550.0 | SAS-3/RMC | 39.0 2.0 | 9 |
| 4U 1820-303 | 42940.0 | SAS-3/RMC | 53.0 4.2 | 9 |
| 4U 1820-303 | 42941.0 | SAS-3/RMC | 41.0 4.5 | 9 |
| 4U 1820-303 | 42942.0 | SAS-3/RMC | 46.0 3.7 | 9 |
| 4U 1820-303 | 42942.0 | SAS-3/RMC | 43.0 3.9 | 9 |
| 4U 1820-303 | 42944.0 | SAS-3/RMC | 42.0 2.9 | 9 |
| 4U 1820-303 | 46296.0 | EXOSAT | 52.8 1.9 | 10 |
Table 2 lists Eddington fluxes for all sources from which at least one PRE burst has been observed by RXTE’s PCA or WFC instruments. This data is supplemented by a small number of PRE bursts recorded by other X-ray satellites. These are mostly medium to long duration bursts and are listed in Table 6. This sample is heterogeneous, but represents our only knowledge of the Eddington flux of the source SLX 1735269, where only non-PRE bursts were observed by RXTE and improves our estimates of the Eddington fluxes of the other sources listed.
The Eddington fluxes for each source are calculated in the same way as in Appendix A of WGP13. Where no uncertainty on a flux measurement is given in the literature, we have conservatively assumed it is 25% of the flux measurement. The addition of the supplemental bursts did not significantly change any of the Eddington fluxes listed in WGP13.
The number of PRE and non-PRE bursts listed in Table 2 represent the bursts which made it into our final analysis; bursts discarded for source confusion or the inability to fit a persistent emission model are not counted. These are still suitable to estimate the Eddington flux of the source. For example, IGR 17473-2721 has three PRE bursts in the complete RXTE catalog and therefore has a known – but all three of these bursts are source confused so they are not investigated in this work or listed in Table 2.
Acknowledgements
H.W. has been supported by an APA postgraduate research scholarship. D.J.P. is the recipient of an Australian Research Council Future Fellowship (project FT130100034). This research utilizes preliminary analysis results from the Multi-INstrument Burst ARchive (MINBAR)333see burst.sci.monash.edu/minbar , which is supported under the Australian Academy of Science’s Scientific Visits to Europe program, and the Australian Research Council’s Discovery Projects and Future Fellowship funding schemes. This paper uses results provided by the ASM/RXTE teams at MIT and at the RXTE SOF and GOF at NASA’s GSFC. This research made use of Astropy, a community-developed core Python package for Astronomy (Astropy Collaboration, 2013). This research has made use of data obtained through the High Energy Astrophysics Science Archive Research Center Online Service, provided by the NASA/Goddard Space Flight Center. We are grateful to the International Space Science Institute (ISSI) in Bern for the support of an International Team on Type I X-ray Bursts. We thank the anonymous referee, whose comments significantly improved the paper.
References
- Altamirano et al. (2008) Altamirano, D., Galloway, D. K., Chenevez, J., in’t Zand, J., Kuulkers, E., Degenaar, N., Del Monte, E., Feroci, M., Costa, E., Evangelista, Y., Falanga, M., Markwardt, C., Wijnands, R., & Van Der Klis, M. 2008, The Astronomer’s Telegram, 1651, 1
- Asai et al. (2000) Asai, K., Dotani, T., Nagase, F., & Mitsuda, K. 2000, ApJS, 131, 571
- Astropy Collaboration et al. (2013) Astropy Collaboration, Robitaille, T. P., Tollerud, E. J., Greenfield, P., Droettboom, M., Bray, E., Aldcroft, T., Davis, M., Ginsburg, A., Price-Whelan, A. M., Kerzendorf, W. E., Conley, A., Crighton, N., Barbary, K., Muna, D., Ferguson, H., Grollier, F., Parikh, M. M., Nair, P. H., Unther, H. M., Deil, C., Woillez, J., Conseil, S., Kramer, R., Turner, J. E. H., Singer, L., Fox, R., Weaver, B. A., Zabalza, V., Edwards, Z. I., Azalee Bostroem, K., Burke, D. J., Casey, A. R., Crawford, S. M., Dencheva, N., Ely, J., Jenness, T., Labrie, K., Lim, P. L., Pierfederici, F., Pontzen, A., Ptak, A., Refsdal, B., Servillat, M., & Streicher, O. 2013, A&A, 558, A33
- Augusteijn et al. (1998) Augusteijn, T., van der Hooft, F., de Jong, J. A., van Kerkwijk, M. H., & van Paradijs, J. 1998, A&A, 332, 561
- Bagnoli et al. (2013) Bagnoli, T., in’t Zand, J. J. M., Galloway, D. K., & Watts, A. L. 2013, MNRAS, 431, 1947
- Barrière et al. (2014) Barrière, N. M., Krivonos, R., Tomsick, J. A., Bachetti, M., Boggs, S. E., Chakrabarty, D., Christensen, F. E., Craig, W. W., Hailey, C. J., Harrison, F. A., Hong, J., Mori, K., Stern, D., & Zhang, W. W. 2014, ArXiv e-prints
- Belian et al. (1976) Belian, R. D., Conner, J. P., & Evans, W. D. 1976, ApJ, 206, L135
- Belloni et al. (1993) Belloni, T., Hasinger, G., Pietsch, W., Mereghetti, S., Bignami, G. F., & Caraveo, P. 1993, A&A, 271, 487
- Blissett & Cruise (1979) Blissett, R. J. & Cruise, A. M. 1979, MNRAS, 186, 45
- Boirin & Parmar (2003) Boirin, L. & Parmar, A. N. 2003, A&A, 407, 1079
- Burger & Katz (1983) Burger, H. L. & Katz, J. I. 1983, ApJ, 265, 393
- Cackett et al. (2006) Cackett, E. M., Wijnands, R., Linares, M., Miller, J. M., Homan, J., & Lewin, W. H. G. 2006, MNRAS, 372, 479
- Campana (2005) Campana, S. 2005, The Astronomer’s Telegram, 535, 1
- Campana & Stella (2003) Campana, S. & Stella, L. 2003, ApJ, 597, 474
- Casares et al. (2006) Casares, J., Cornelisse, R., Steeghs, D., Charles, P. A., Hynes, R. I., O’Brien, K., & Strohmayer, T. E. 2006, MNRAS, 373, 1235
- Cavecchi et al. (2011) Cavecchi, Y., Patruno, A., Haskell, B., Watts, A. L., Levin, Y., Linares, M., Altamirano, D., Wijnands, R., & van der Klis, M. 2011, ApJ, 740, L8
- Chen et al. (2013) Chen, Y.-P., Zhang, S., Zhang, S.-N., Ji, L., Torres, D. F., Kretschmar, P., Li, J., & Wang, J.-M. 2013, ApJ, 777, L9
- Chenevez et al. (2006) Chenevez, J., Falanga, M., Brandt, S., Farinelli, R., Frontera, F., Goldwurm, A., in’t Zand, J. J. M., Kuulkers, E., & Lund, N. 2006, A&A, 449, L5
- Church et al. (1998) Church, M. J., Parmar, A. N., Balucinska-Church, M., Oosterbroek, T., dal Fiume, D., & Orlandini, M. 1998, A&A, 338, 556
- Church et al. (2005) Church, M. J., Reed, D., Dotani, T., Bałucińska-Church, M., & Smale, A. P. 2005, MNRAS, 359, 1336
- D’Aí et al. (2006) D’Aí, A., di Salvo, T., Iaria, R., Méndez, M., Burderi, L., Lavagetto, G., Lewin, W. H. G., Robba, N. R., Stella, L., & van der Klis, M. 2006, A&A, 448, 817
- Damen et al. (1990) Damen, E., Magnier, E., Lewin, W. H. G., Tan, J., Penninx, W., & van Paradijs, J. 1990, A&A, 237, 103
- David et al. (1997) David, P., Goldwurm, A., Murakami, T., Paul, J., Laurent, P., & Goldoni, P. 1997, A&A, 322, 229
- Farinelli et al. (2007) Farinelli, R., Titarchuk, L., & Frontera, F. 2007, ApJ, 662, 1167
- Feroci et al. (2012) Feroci, M., Stella, L., van der Klis, M., Courvoisier, T. J.-L., Hernanz, M., Hudec, R., Santangelo, A., Walton, D., Zdziarski, A., & et. al. 2012, Experimental Astronomy, 34, 415
- Frogel et al. (1995) Frogel, J. A., Kuchinski, L. E., & Tiede, G. P. 1995, AJ, 109, 1154
- Fujimoto et al. (1981) Fujimoto, M. Y., Hanawa, T., & Miyaji, S. 1981, ApJ, 247, 267
- Galloway & Lampe (2012) Galloway, D. K. & Lampe, N. 2012, ApJ, 747, 75
- Galloway et al. (2008) Galloway, D. K., Muno, M. P., Hartman, J. M., Psaltis, D., & Chakrabarty, D. 2008, ApJS, 179, 360
- Galloway et al. (2006) Galloway, D. K., Psaltis, D., Muno, M. P., & Chakrabarty, D. 2006, ApJ, 639, 1033
- Gavriil et al. (2012) Gavriil, F. P., Strohmayer, T. E., & Bhattacharyya, S. 2012, ApJ, 753, 2
- Gregory (2005) Gregory, P. C. 2005, Bayesian Logical Data Analysis for the Physical Sciences: A Comparative Approach with ‘Mathematica’ Support (Cambridge University Press)
- Grindlay et al. (1976) Grindlay, J., Gursky, H., Schnopper, H., Parsignault, D. R., Heise, J., Brinkman, A. C., & Schrijver, J. 1976, ApJ, 205, L127
- Güver et al. (2012) Güver, T., Psaltis, D., & Özel, F. 2012, ApJ, 747, 76
- Hasinger & van der Klis (1989) Hasinger, G. & van der Klis, M. 1989, A&A, 225, 79
- Heger et al. (2007) Heger, A., Cumming, A., Galloway, D. K., & Woosley, S. E. 2007, ApJ, 671, L141
- Homan et al. (2003) Homan, J., Wijnands, R., & van den Berg, M. 2003, A&A, 412, 799
- Hynes et al. (2001) Hynes, R. I., Charles, P. A., Haswell, C. A., Casares, J., Zurita, C., & Serra-Ricart, M. 2001, MNRAS, 324, 180
- Iaria et al. (2005) Iaria, R., Spanò, M., Di Salvo, T., Robba, N. R., Burderi, L., Fender, R., van der Klis, M., & Frontera, F. 2005, ApJ, 619, 503
- in ’t Zand et al. (1999) in ’t Zand, J. J. M., Heise, J., Kuulkers, E., Bazzano, A., Cocchi, M., & Ubertini, P. 1999, A&A, 347, 891
- in’t Zand et al. (2013) in’t Zand, J. J. M., Galloway, D. K., Marshall, H. L., Ballantyne, D. R., Jonker, P. G., Paerels, F. B. S., Palmer, D. M., Patruno, A., & Weinberg, N. N. 2013, A&A, 553, A83
- Ji et al. (2013) Ji, L., Zhang, S., Chen, Y., Zhang, S.-N., Torres, D. F., Kretschmar, P., Chernyakova, M., Li, J., & Wang, J.-M. 2013, MNRAS, 432, 2773
- Ji et al. (2014a) Ji, L., Zhang, S., Chen, Y., Zhang, S.-N., Torres, D. F., Kretschmar, P., & Li, J. 2014a, ApJ, 782, 40
- Ji et al. (2014b) Ji, L., Zhang, S., Chen, Y.-P., sZhang, S.-N., Kretschmar, P., Wang, J.-M., & Li, J. 2014b, A&A, 564, A20
- Jonker et al. (2003) Jonker, P. G., Méndez, M., Nelemans, G., Wijnands, R., & van der Klis, M. 2003, MNRAS, 341, 823
- Jonker & Nelemans (2004) Jonker, P. G. & Nelemans, G. 2004, MNRAS, 354, 355
- Joss (1977) Joss, P. C. 1977, Nature, 270, 310
- Juett et al. (2001) Juett, A. M., Psaltis, D., & Chakrabarty, D. 2001, ApJ, 560, L59
- Keek et al. (2014) Keek, L., Ballantyne, D. R., Kuulkers, E., & Strohmayer, T. E. 2014, ArXiv e-prints
- Keek et al. (2008) Keek, L., in’t Zand, J. J. M., Kuulkers, E., Cumming, A., Brown, E. F., & Suzuki, M. 2008, A&A, 479, 177
- Klein-Wolt et al. (2007) Klein-Wolt, M., Maitra, D., Wijnands, R., Swank, J. H., Markwardt, C. B., & Bailyn, C. 2007, The Astronomer’s Telegram, 1070, 1
- Krimm et al. (2008) Krimm, H. A., Kennea, J., & Tueller, J. 2008, The Astronomer’s Telegram, 1432, 1
- Kuulkers et al. (2003) Kuulkers, E., den Hartog, P. R., in’t Zand, J. J. M., Verbunt, F. W. M., Harris, W. E., & Cocchi, M. 2003, A&A, 399, 663
- Lattimer & Prakash (2007) Lattimer, J. M. & Prakash, M. 2007, Phys. Rep., 442, 109
- Lewin & Joss (1981) Lewin, W. H. G. & Joss, P. C. 1981, Space Science Reviews, 28, 3
- Lewin et al. (1993) Lewin, W. H. G., van Paradijs, J., & Taam, R. E. 1993, Space Sci. Rev., 62, 223
- Lin et al. (2009) Lin, D., Remillard, R. A., & Homan, J. 2009, ApJ, 696, 1257
- Linares et al. (2014) Linares, M., Bahramian, A., Heinke, C., Wijnands, R., Patruno, A., Altamirano, D., Homan, J., Bogdanov, S., & Pooley, D. 2014, MNRAS, 438, 251
- Lyu et al. (2014) Lyu, M., Mendez, M., Sanna, A., Homan, J., Belloni, T., & Hiemstra, B. 2014, ArXiv e-prints
- Maccarone & Coppi (2003) Maccarone, T. J. & Coppi, P. S. 2003, A&A, 399, 1151
- Miller & Lamb (1996) Miller, M. C. & Lamb, F. K. 1996, ApJ, 470, 1033
- Molkov et al. (2005) Molkov, S., Revnivtsev, M., Lutovinov, A., & Sunyaev, R. 2005, A&A, 434, 1069
- Mori et al. (2005) Mori, H., Maeda, Y., Pavlov, G. G., Sakano, M., & Tsuboi, Y. 2005, Advances in Space Research, 35, 1137
- Motta et al. (2011) Motta, S., D’Aı, A., Papitto, A., Riggio, A., di Salvo, T., Burderi, L., Belloni, T., Stella, L., & Iaria, R. 2011, MNRAS, 414, 1508
- Muno et al. (2000) Muno, M. P., Fox, D. W., Morgan, E. H., & Bildsten, L. 2000, ApJ, 542, 1016
- Natalucci et al. (2000) Natalucci, L., Bazzano, A., Cocchi, M., Ubertini, P., Heise, J., Kuulkers, E., in’t Zand, J. J. M., & Smith, M. J. S. 2000, ApJ, 536, 891
- Nath et al. (2002) Nath, N. R., Strohmayer, T. E., & Swank, J. H. 2002, ApJ, 564, 353
- Negoro et al. (2012) Negoro, H., Asada, M., Serino, M., Nakahira, S., Morii, M., Ogawa, Y., Ueno, S., Tomida, H., Ishikawa, M., Yamaoka, K., Kimura, M., Mihara, T., Sugizaki, M., Morihana, K., Yamamoto, T., Sugimoto, J., Takagi, T., Matsuoka, M., Kawai, N., Usui, R., Ishikawa, K., Yoshida, A., Sakamoto, T., Nakano, Y., Tsunemi, H., Sasaki, M., Nakajima, M., Ueda, Y., Hiroi, K., Shidatsu, M., Sato, R., Kawamuro, T., Tsuboi, Y., Yamauchi, M. H. M., Nishimura, Y., Hanayama, T., & Yoshidom, K. 2012, The Astronomer’s Telegram, 4622, 1
- Oosterbroek et al. (2001a) Oosterbroek, T., Barret, D., Guainazzi, M., & Ford, E. C. 2001a, A&A, 366, 138
- Oosterbroek et al. (2001b) Oosterbroek, T., Parmar, A. N., Sidoli, L., in’t Zand, J. J. M., & Heise, J. 2001b, A&A, 376, 532
- Pandel et al. (2008) Pandel, D., Kaaret, P., & Corbel, S. 2008, ApJ, 688, 1288
- Papitto et al. (2011) Papitto, A., Bozzo, E., Ferrigno, C., Belloni, T., Burderi, L., di Salvo, T., Riggio, A., D’Aì, A., & Iaria, R. 2011, A&A, 535, L4
- Papitto et al. (2010) Papitto, A., Riggio, A., di Salvo, T., Burderi, L., D’Aì, A., Iaria, R., Bozzo, E., & Menna, M. T. 2010, MNRAS, 407, 2575
- Peille et al. (2014) Peille, P., Olive, J., & Barret, D. 2014, ArXiv e-prints
- Piraino et al. (2007) Piraino, S., Santangelo, A., di Salvo, T., Kaaret, P., Horns, D., Iaria, R., & Burderi, L. 2007, A&A, 471, L17
- Sakano et al. (2002) Sakano, M., Koyama, K., Murakami, H., Maeda, Y., & Yamauchi, S. 2002, ApJS, 138, 19
- Sala et al. (2012) Sala, G., Haberl, F., José, J., Parikh, A., Longland, R., Pardo, L. C., & Andersen, M. 2012, ApJ, 752, 158
- Sguera et al. (2007) Sguera, V., Bazzano, A., & Bird, A. J. 2007, The Astronomer’s Telegram, 1340, 1
- Sidoli et al. (2005) Sidoli, L., Parmar, A. N., & Oosterbroek, T. 2005, A&A, 429, 291
- Skinner et al. (1990) Skinner, G. K., Foster, A. J., Willmore, A. P., & Eyles, C. J. 1990, MNRAS, 243, 72
- Stella & Rosner (1984) Stella, L. & Rosner, R. 1984, ApJ, 277, 312
- Strohmayer & Bildsten (2006) Strohmayer, T. & Bildsten, L. 2006, in Compact Stellar X-ray Sources, ed. Lewin, W. H. G. and van der Klis, M., 113–156
- Strohmayer & Brown (2002) Strohmayer, T. E. & Brown, E. F. 2002, ApJ, 566, 1045
- Swank et al. (1977) Swank, J. H., Becker, R. H., Boldt, E. A., Holt, S. S., Pravdo, S. H., & Serlemitsos, P. J. 1977, ApJ, 212, L73
- Sztajno et al. (1987) Sztajno, M., Fujimoto, M. Y., van Paradijs, J., Vacca, W. D., Lewin, W. H. G., Penninx, W., & Trumper, J. 1987, MNRAS, 226, 39
- Tawara et al. (1984) Tawara, Y., Hirano, T., Kii, T., Matsuoka, M., & Murakami, T. 1984, PASJ, 36, 861
- Thompson et al. (2005) Thompson, T. W. J., Rothschild, R. E., Tomsick, J. A., & Marshall, H. L. 2005, ApJ, 634, 1261
- Titarchuk (1994) Titarchuk, L. 1994, ApJ, 434, 570
- Vacca et al. (1986) Vacca, W. D., Lewin, W. H. G., & van Paradijs, J. 1986, MNRAS, 220, 339
- van Paradijs et al. (1990) van Paradijs, J., Dotani, T., Tanaka, Y., & Tsuru, T. 1990, PASJ, 42, 633
- van Paradijs & Lewin (1986) van Paradijs, J. & Lewin, H. G. 1986, A&A, 157, L10
- Walker (1992) Walker, M. A. 1992, ApJ, 385, 642
- Wang et al. (2001) Wang, Z., Chakrabarty, D., Roche, P., Charles, P. A., Kuulkers, E., Shahbaz, T., Simpson, C., Forbes, D. A., & Helsdon, S. F. 2001, ApJ, 563, L61
- Werner et al. (2004) Werner, N., in’t Zand, J. J. M., Natalucci, L., Markwardt, C. B., Cornelisse, R., Bazzano, A., Cocchi, M., Heise, J., & Ubertini, P. 2004, A&A, 416, 311
- Woosley & Taam (1976) Woosley, S. E. & Taam, R. E. 1976, Nature, 263, 101
- Worpel et al. (2013) Worpel, H., Galloway, D. K., & Price, D. J. 2013, ApJ, 772, 94
- Younes et al. (2009) Younes, G., Boirin, L., & Sabra, B. 2009, A&A, 502, 905