Gemini spectroscopy of Galactic Bulge Sources: a population of hidden accreting binaries revealed?††thanks: Based on observations obtained at the Gemini Observatory, which is operated by the Association of Universities for Research in Astronomy, Inc., under a cooperative agreement with the NSF on behalf of the Gemini partnership: the National Science Foundation (United States), the National Research Council (Canada), CONICYT (Chile), the Australian Research Council (Australia), Ministério da Ciência, Tecnologia e Inovação (Brazil) and Ministerio de Ciencia, Tecnología e Innovación Productiva (Argentina).
Abstract
We present Gemini spectroscopy for 21 candidate optical counterparts to X-ray sources discovered in the Galactic Bulge Survey (GBS). For the majority of the 21 sources, the optical spectroscopy establishes that they are indeed the likely counterparts. One of the criteria we used for the identification was the presence of an H emission line. The spectra of several sources revealed an H emission line only after careful subtraction of the F or G stellar spectral absorption lines. In a sub-class of three of these sources the residual H emission line is broad ( km s-1) which suggests that it is formed in an accretion disk, whereas in other cases the line width is such that we currently cannot determine whether the line emission is formed in an active star/binary or in an accretion disk. GBS source CX377 shows this hidden-accretion behaviour most dramatically. The previously-identified broad H emission of this source is not present in its Gemini spectra taken 1 year later. However, broad emission is revealed after subtracting an F6 template star spectrum. The Gemini spectra of three sources (CX446, CX1004, and CXB2) as well as the presence of possible eclipses in light curves of these sources suggest that these sources are accreting binaries viewed under a high inclination.
keywords:
binaries: close — stars: emission line, Be — Galaxy: Bulge — X-rays: binaries1 Introduction
Previous surveys of faint X-ray sources have been focused on the Galactic Center or globular clusters. While the Galactic Center Survey (e.g., Muno et al. 2003) benefits from a high source density, the crowding and significant extinction make the optical/infrared follow-up necessary for classification difficult (e.g., Mauerhan et al. 2009).
The Galactic Bulge Survey (GBS; Jonker et al. 2011; Jonker et al. 2014; Paper I & II hereafter) is a multiwavelength project that is designed to allow optical/infrared classification of X-ray sources detected in the Galactic Bulge. The GBS consists of Chandra and multiwavelength observations of two strips centered above and below the Galactic plane (see Fig. 1 of Paper I), thus avoiding the regions with serious crowding and extinction problems, while still maintaining a relatively high source density. The GBS utilizes Chandra observations with an exposure of 2 ks for each pointing; the exposure time is chosen to maximize the relative numbers of low-mass X-ray binaries (LMXBs) to cataclysmic variables (CVs). The completed Chandra observations have detected 1640 unique X-ray sources (Paper II), agreeing well with the estimation in Paper I which also gave a break-down of the expected numbers of various kinds of objects based on source density, expected Chandra flux limit, etc. Among the 1640 X-ray sources, are expected to be CVs, including both intermediate polars (IPs) and non-magnetic CVs, while the number of LMXBs is expected to be (see Table 2 of Paper I). We also expect 600 chromospherically active stars or binaries, e.g., RS Canum Venaticorum variables (RS CVn systems; Walter et al. 1980).
The GBS combines a large sky coverage with the good sensitivity to faint X-ray sources and the excellent positional accuracy possible with Chandra. There are two main science goals of the GBS (see §1 of Paper I for more details): 1) constraining the nature of the common-envelope phase in binary evolution by comparing the observed number of sources with model predictions in each class, e.g., CVs and LMXBs; 2) measuring the mass of the compact objects in X-ray binaries, e.g., eclipsing quiescent black hole (BH) and neutron star (NS) LMXBs, to investigate the Galactic BH mass distribution (e.g., Özel et al. 2010) and to constrain the NS equation of state (EoS).
Both of the science goals rely on the multiwavelength identification and classification of this large sample of faint X-ray sources. A variety of optical/infrared follow-up campaigns have been conducted. Hynes et al. (2012) identified 69 X-ray sources in the GBS using the Tycho-2 catalogue. These sources are coincident with or very close to the bright stars in that catalogue, most of which are likely to be the real optical counterparts to the X-ray sources. This sample is a mix of objects with a broad range of spectral types, including both late-type stars with coronal X-ray emission and early-type stars with wind X-ray emission. Many sources are foreground objects instead of residing in the Galactic Bulge. Britt et al. (2014) reported on an optical photometric survey of three quarters of the sky area covered by the Chandra GBS, and presented the light curves of variable objects consistent with the X-ray positions of GBS sources catalogued in Paper I. About a quarter of the optical counterparts are variable, and they are expected to be a mix of IPs, non-magnetic CVs, LMXBs, and RS CVns. Greiss et al. (2014) provided likely near-infrared identification of GBS X-ray sources using current near-infrared sky surveys. Maccarone et al. (2012) found 12 candidate radio matches to the GBS X-ray sources using the archival NRAO VLA Sky Survey (NVSS; Condon et al. 1998). The majority of them appear to be background active galactic nuclei.
Optical/infrared spectroscopy of the detected X-ray sources is an essential tool to investigate their nature. Accreting binaries can be identified by the emission features in their optical spectra. The only firm way to distinguish white dwarf (WD), NS, and BH as the primaries of the X-ray binaries is via measurements of the accretor masses, which requires high-quality optical/infrared spectroscopy. Britt et al. (2013) presented five accreting binaries identified in the GBS based on the strong emission lines in their spectra, including three likely IPs, one CV undergoing a dwarf nova outburst, and one likely quiescent LMXB (qLMXB). Torres et al. (2014) identified 22 new accreting binaries via the H emission lines in their optical spectra. They developed criteria of accreting binaries based on the equivalent width (EW) of H emission line (EW Å), the breadth of the H emission line (FWHM km s-1), or the strength of He i 5876,6678 in case of narrow and weak H lines. There are also several extensive spectroscopic studies on individual GBS sources. Ratti et al. (2013) presented a dynamical analysis of GBS source CX93 in which they measured the mass of the compact primary and the companion star, and concluded that the source is a long orbital period CV. Hynes et al. (2014) identified a symbiotic X-ray binary with a carbon star companion in the Galactic Bulge based on the spectra of its optical counterpart.
In this work, we present Gemini spectroscopy of 21 GBS X-ray sources with a better X-ray positional accuracy than the median (due to low off-axis angles). These 21 sources are listed in Table 1. We will refer to these sources with their labels, i.e. CX (or CXB) IDs, introduced in the GBS source catalogue (Paper I and II). GBS sources listed in Paper I have the prefix of “CX”, while the remaining GBS sources, detected in the last quarter of the Chandra coverage published in Paper II, have the prefix of “CXB”. The sources in each catalogue were ranked by their Chandra counts, where CX1 has the most counts among the CX sources. The majority of the sources in this work are CXB sources, while previous works were focused on CX sources. This paper is structured as follows. In §2 we describe the Gemini observations and data reduction. In §3 we present the analysis of the Gemini spectroscopy, including spectral classification and radial velocity analysis. In §4 we give results and discuss each interesting object. Overall conclusions are summarized in §5.
2 Observation & Data Reduction
2.1 Gemini Spectroscopy
The list of 21 GBS sources of which we obtained Gemini spectroscopy consists of six CX sources and 15 CXB sources. The six CX sources were proven to be interesting on the basis of earlier spectra and/or photometric variability. For example, three of the CX sources (CX377, CX446, and CX1004) have shown H emission lines in their previous spectra (Torres et al. 2014) obtained by the VIsible Multi-Object Spectrograph (VIMOS) mounted on the Very Large Telescope (VLT). Based on our follow-up strategy (i.e., prioritizing sources with higher positional accuracy and brighter in optical/infrared), the 15 CXB sources are chosen to have off-axis angles less than 5 arcmin in their Chandra observations and also have sufficient counts to allow for an accurate X-ray position (). Optical/infrared brightness, colour and photometric variability are also among the factors of sample selection.
The finding charts of our sources are shown in Appendix A (see Fig. 12–13). The coordinates listed in Table 1 are for the candidate optical counterparts, i.e., the objects for which we took Gemini spectroscopy. The astrometry was performed on images from VLT/VIMOS (CX377, CX446, and CX1004; Torres et al. 2014), Gemini (CXB117), and Mosaic-II/Dark Energy Camera (DECam; other sources; see §2.2). All of them have a RMS accuracy of , while some sources (CX377, CX1004, and CXB117) have positional accuracy (Britt et al. 2014; Torres et al. 2014).
Optical spectroscopy of the 21 GBS sources was obtained with GMOS (Gemini Multi-Object Spectrograph; Davies et al. 1997) mounted on the Gemini-South Telescope in Chile. All the observations were taken between 2012 Apr 20 and 2013 May 4 under programmes GS-2012A-Q-44 and GS-2012A-Q-67 (see Table 1 for an observation log). Nine objects have multi-epoch spectroscopy, while other objects have one epoch; each epoch has 900–3600 s integration time. The seeing of each spectroscopic observation was measured from the corresponding acquisition image (see the last column of Table 1). Typical seeing was around (with a range of 0.5–1.3′′). GMOS was operated in long-slit mode. We used the R400_G5325 grating (400 line mm-1) and a slit. The two-dimensional spectra were binned by a factor of two in both spatial and spectral dimensions, resulting in a spatial dispersion of /pixel and a spectral dispersion of Å/pixel. The spectral resolution is estimated to be Å FWHM for the sources that had filled the whole slit during the observation (i.e., the seeing was greater than the slit width 0.75′′), while spectral resolution should be better than Å FWHM for the sources with seeing less than 0.75′′. All the Gemini/GMOS spectra were split into three equal parts in the wavelength dimension by detector gaps. The bluest part of the spectra was ignored in the analysis because of the low signal-to-noise ratio () in the spectra due to the extinction towards our sources and the lack of arc lines in this part of the spectra. The middle part (wavelength range –6100 Å) and the red part (wavelength range –7600 Å) of the spectra were reduced and analyzed separately. The results presented in this work are mainly based on the analyses of the red part of the spectra because it is least affected by extinction.
The Gemini/GMOS data were reduced using the figaro package implemented in the
starlink software suite and the packages of pamela and
molly developed by T. Marsh. The two-dimensional spectra were bias-corrected and flat-fielded.
The bias was corrected using the overscan areas of
the detectors. We utilized the flat fields taken directly following each
target observation for flat fielding. We fit the background on both
sides of the spectra with a second-order polynomial and determined the
background at the position of the spectra. The object spectra were
optimally extracted using the optexp procedure in the pamela
package (Marsh 1989). The spectra were
wavelength-calibrated in molly using the helium-argon arc
spectra which were taken either right after observing the target or at the
end of the night. The average arc spectrum was used in case of
multiple arc spectra in one night.
The resulting root mean square (RMS) scatter on the wavelength
calibration is Å. The wavelength calibration was
examined using the skyline O i . Offsets
relative to the wavelength of this line have been corrected.
For sources with seeing less than the slit width (),
the centroiding uncertainty (i.e., if the source is not placed
in the middle of the slit) may introduce a small wavelength shift
(Bassa et al. 2006). This
wavelength shift cannot be corrected by examining the sky-line
wavelength as those fill the whole slit.
However, it can potentially be assessed by checking the wavelengths of
diffuse interstellar bands (DIBs; Herbig 1995). Three such sources (CX84,
CXB149, and CXB174) have strong DIBs at for which the
line profiles do not deviate from Gaussians. We checked
these features and found they have minor shifts relative to the rest-frame
wavelength (65 km s-1 for CX84, km s-1 for CXB149, and
km s-1 for CXB174 in heliocentric frame). We corrected the
wavelength scale for these small shifts. Each spectrum
was normalized by dividing it by the result of fitting a 5th-order
polynomial fit to the continuum.
2.2 Optical Photometry from Mosaic-II & DECam


Time-resolved optical photometry for all six CX sources was obtained with the Mosaic-II imager mounted on the Blanco 4-meter telescope at the Cerro Tololo Inter-American Observatory (CTIO) in 2010 July 8–15. Nineteen exposures in the Sloan -band with an integration time of 120 s were taken on 45 overlapping fields to cover a nine square degree area, which contain all but seven of the X-ray sources identified in Paper I (see Britt et al. 2014 for the full description and results of this variability campaign). Typical seeing for these imaging observations was around (with a range of 0.8–3.0′′). The data were reduced using the NOAO Mosaic Pipeline (Shaw 2009). We performed differential photometry using Alard’s image subtraction ISIS (Alard & Lupton 1998; Alard 2000) to obtain the changes in flux with respect to reference images. The zero-point flux in the reference images was measured with either aperture photometry or DAOPHOT-II (Stetson 1987). The number of variable interlopers within the 95% error circles of the X-ray position is (see §3.1 of Britt et al. 2014 for details).
The optical photometry information of four CX sources (CX84, CX377, CX446, CX1004) in this paper is shown in Table 2, while their light curves have been presented in literature (CX84 in Fig. 6 of Britt et al. 2014; CX377, CX446 and CX1004 in Fig. A2 of Torres et al. 2014). For CX138, there are two blended sources in the Mosaic-II image at its X-ray position; neither of the possible counterparts is variable. The counterpart to CX139 is saturated in the Mosaic-II imaging. Among the four CX sources with light curves, only CX84 shows possibly periodic behaviour with a period of 4.67 days. However, it is worth noting that it is currently not possible to confirm the periodic nature of this variability because the baseline of our monitoring was only 8 days, which is less than two full cycles. The light curves of the other three sources only have random flickering with an RMS–0.1 magnitude, although CX446 possibly experiences eclipse events.
Optical photometry for five of the CXB sources in our sample (CXB2,
CXB64, CXB82, CXB99, and CXB113) was obtained
using the Dark Energy Camera (DECam) instrument mounted on the
Blanco 4-meter telescope at CTIO on the nights of June 10 and 11 of
2013. The average seeing for both nights was with
a range of 0.9–1.9′′. DECam provides a
square degree field of view combining 62
science CCDs, 8 focus CCDs, and 4 guiding CCDs with a scale of
0.27′′ per pixel. For all of our images, the SDSS
filter was used with
exposure times of either s or s for the faint
and bright sources, respectively. The DECam pipeline reduction provided the
resampled images with cross-talk corrections, overscan, trimmed
sections, bias subtraction, flat-fielding and saturation
masks.111See DECam Data Handbook at
http://www.noao.edu/meetings/decam/ media/DECam_Data_Handbook.pdf.
We then used standard IRAF tasks (including
wcsctran, digiphot, and apphot) to extract magnitudes and
fluxes and to generate light curves through the use of differential
photometry. Calibration of the target stars was achieved by using
reference stars in the field of view that were contained in the
Carlsberg Meridian 14 catalogue (Evans et al. 2002) and VizieR catalogue:
I/304.
The photometry of these five sources are included in Table 2 while their light curves are shown in Fig. 1. Among the five GBS sources, CXB2 shows possible eclipsing/dipping events and an “outburst”. Although the outburst was towards the end of the night with higher airmass, visual inspection of the images confirms that the brightening is real. This outburst is possibly the reprocessed X-ray emission from a Type I X-ray burst, which is similar to the case of NS LMXB EXO 0748676 (Hynes et al. 2006). The light curve shows a likely periodic modulation of day (see the phase-folded light curve). CXB82 and CXB99 both appear to be long period variables with periods longer than our 2-night observing run. For both sources, there is a steady increase in brightness by about and magnitude, respectively. Due to the lack of standard stars in their fields, CXB64 and CXB113 only have approximate magnitudes without absolute calibration. CXB64 has a counterpart USNO B1.0 star 05780732346 with the optical magnitude of and . CXB113 shows a sinusoidal modulation with period of day. The phase-folded light curve for this source is also shown in Fig. 1. The optical counterpart to CXB113 was also identified by OGLE (Optical Gravitational Lensing Experiment; Field: BUL_SC37, StarID: 9614; Udalski et al. 1992). The OGLE source has optical magnitudes of and . It also shows a periodic modulation of day.
2.3 Near-Infrared Photometry


The likely near-infrared matches to the GBS X-ray sources detected by Chandra (Greiss et al. 2014) were mainly obtained from the public variability survey VISTA Variables in the Vía Láctea (VVV; Minniti et al. 2010). The VVV survey provides the most complete near-infrared coverage of the GBS area with consistent depth. Complementary coverage from the Two-Micron All Sky Survey (2MASS; Skrutskie et al. 2006) and UKIDSS Galactic Plane Survey (GPS; Lucas et al. 2008) were also utilized for bright () and faint () sources, respectively. Greiss et al. (2014) developed a method to estimate the likelihood (by calculating the false alarm probability) of a near-infrared source to be the counterpart of the X-ray source. However, for the optical sources where we have obtained Gemini/GMOS spectra, we are able to search for the near-infrared counterparts that matches our optical sources by comparing the optical and near-infrared images. We set a astrometric error circle, and searched for any matches within that error circle between the optical images and VVV images. Then we visually examined both images and selected the true near-infrared counterparts. A visual inspection is crucial given that the GBS fields are crowded.
Table 3 lists the near-infrared counterparts to 13 of the 21 optical sources with Gemini/GMOS spectroscopy. The other eight sources do not have reliable near-infrared counterparts. Three of them (CX446, CXB26, and CXB137) are too faint in the VVV frames and there are no near-infrared sources at the optical position. For the other five sources (CX1004, CXB64, CXB117, CXB189, and CXB201), there could be near-infrared matches but they are blended with nearby sources, for which the current VVV data release does not provide photometry.
The infrared colours can be used to estimate the distance of the source by calculating the needed extinction to match the source infrared colours to those of a standard star with the same spectral type (e.g., Ratti et al. 2013). Some of the GBS sources have an infrared excess, i.e., their infrared colours are redder than expected based on optical colours (see §4 of Hynes et al. 2012), which is possibly for cases where the optical classification may represent the hotter component of a binary (or of a blend, if another star is serendipitously along the same line of sight) while the infrared colours are from the cooler component. Accreting systems (CVs and LMXBs) and Be stars with a circumstellar disk may also have colours that do not match those of single stars. Be stars could also have significant colour variations due to the formation/dissolution of the circumstellar disks.
3 Data Analysis
The Gemini/GMOS spectra of the 21 GBS sources are shown in
Fig. 2–4. Three sources (CX446, CX1004,
and CXB2) show apparent broad H emission lines, while another three
(CXB64, CXB99, and CXB113) have narrow H emission (see
Fig. 2). We fit Gaussian profiles to these broad H
emission lines to measure their width and velocity separations (if
double-peaked) using the mgfit procedure in the molly
package. The equivalent widths (EWs) of these H lines were measured
using the light procedure in molly. Nine other objects
have H absorption features (Fig. 3). The stellar
absorption features
shown in the Gemini/GMOS spectra can be
utilized to perform spectral classification, and radial velocity
analysis. The spectra of the remaining six sources
are shown in Fig. 4; they appear at first sight to
have neither H
emission features nor H absorption features.
Some of the objects in our sample have strong DIBs in their spectra. We estimated the reddening for these sources via the equivalent width (EW) of the DIB at with the calibration in Table 3 of Herbig (1993). We also compared the measured reddening to the Bulge reddening along the line of sight provided by Gonzalez et al. (2011,2012), which utilized the Red Clump stars in the Bulge.222See the Bulge Extinction And Metalicity (BEAM) calculator at http://mill.astro.puc.cl/BEAM/calculator.php.
3.1 Spectral Classification
We utilize the optimal subtraction technique following previous works (e.g., Marsh et al. 1994; Ratti et al. 2013) to classify the spectra. A set of template star spectra was chosen from the library of the Ultraviolet and Visual Echelle Spectrograph Paranal Observatory Project (UVES POP; Jehin et al. 2005), covering spectral types from A0 to M6 with luminosity class of V (see Table 4). The UVES POP template spectra provide coverage over the wavelength range of 3000–10000 Å with a spectral resolution of . The templates were re-sampled and Gaussian-smoothed to match the spectral resolution of the object spectra. The object spectra were Doppler-shifted into the same rest frame and averaged. Each stellar template was optimally subtracted from the object spectrum, while a test was performed on the residuals. All the emission lines, DIBs, and telluric features (e.g., Kurucz 2006; Wallace et al. 2011) were masked during the procedure. The resulting values for each template were compared with each other. The template with the minimum value provides our best estimate of the spectral classification of each GBS source in our sample. These spectral classification procedures were first performed on the red part of the Gemini spectra. We verified our results by performing the same procedures to the middle part of the Gemini spectra and the results are consistent with each other. The results of spectral classifications are listed in Table 5. Note we are not controlling luminosity class in the spectral classification. Nine of the 21 GBS sources in our sample were spectrally classified. The uncertainty of spectral classification is estimated to be one or two spectral sub-classes. The other three sources listed in Table 5 are classified as early–mid M-type based on their spectral features.
We have also tried to measure the rotational broadening of the absorption features. However, our limited spectral resolution of km s-1 precluded the determination of rotational velocities.
3.2 Radial Velocity Analysis
The radial velocities of the optical counterpart of each GBS source are
measured by cross-correlating the object spectra using the xcor
procedure in molly. For each source, all the object spectra and
the template
spectrum were rebinned to the same velocity dispersion with the
vbin procedure. We also masked all the emission lines,
interstellar/telluric features
during the cross-correlation procedure. We performed two sets
of the cross-correlation analysis. The first set uses the first source
spectrum as the cross-correlation template, i.e., we derive the radial
velocity (RV1) relative to the first source spectrum. For the GBS sources that
were spectrally classified using the procedure in §3.1,
we also performed a second set of cross-correlation analyses, taking the
UVES POP standard star with the best-fit spectral type as the template.
Thus the second set of radial velocity (RV2) is relative to the template
star. All spectra had been shifted to a heliocentric frame.
Radial velocity values were derived by fitting a Gaussian profile to the cross-correlation function. The results are listed in Table 6. Seven sources have non-zero radial velocities relative to the standard star template. Three sources (CX84, CX138, CX139) have radial velocity variations of km s-1 on timescales of days.
4 Results & Discussion
4.1 Objects with H Emission Lines
There are six sources with apparent H emission in their Gemini/GMOS spectra (Fig. 2). Three of them (CX446, CX1004, and CXB2) have broad H emission lines (FWHM km s-1), while those of the other three sources (CXB64, CXB99, and CXB113) are narrow (FWHM km s-1). The strong, broad H emission likely originates from an accretion disk, indicating CX446, CX1004, and CXB2 are likely accreting binaries (§4.1.1).
CXB64 and CXB113 are possibly chromospherically active stars or binaries because of their narrow and weak H emission lines (Torres et al. 2014; also see Fig. 2). The colour (; see Table 3) of CXB113 agrees well with that of a M4V–M5V star (; see Table 5 of Pecaut & Mamajek 2013), while its colour () appears slightly bluer than that of a M4V–M5V type star ().
CXB99 has a weak, narrow H emission. After the optimal subtraction with the best-fit K2V template, the H emission appears to be stronger, indicating that it partially fills in the H absorption line in the spectrum.
4.1.1 Potential Quiescent Accreting Binaries: CX446, CX1004, and CXB2
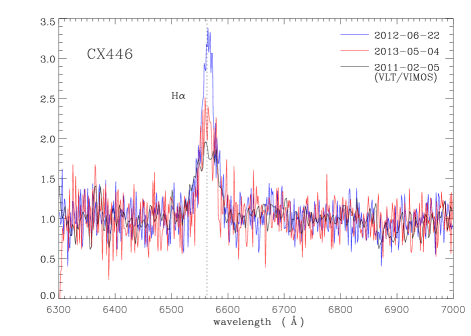


Both epochs of the Gemini/GMOS spectra of CX446 show broad H emission (see Fig. 5). The strength of the H line is weaker in the spectra taken on 2013 May 4 than that on 2012 Jun 22. The line width ( km s-1) is smaller than that of the H emission lines in the VLT/VIMOS spectra of CX446 ( km s-1; Torres et al. 2014), while the line EW is bigger. No absorption lines from the companion star are visible in the Gemini spectra. We also see no evidence of He i 6678. The light curve of CX446 does show a possible eclipse event with a depth of 0.4 magnitude (see Fig. A2 of Torres et al. 2014; on HJD). No significant periodicity is found in the light curve. CX446 is a candidate eclipsing CV or qLMXB.
The Gemini/GMOS spectra of CX1004 show double-peaked H emission in all four epochs (see Fig. 6). We measure the H emission line properties using the spectra of the last epoch because of its best . The line width is FWHM = km s-1, which is broader than that in the VLT/VIMOS spectra of CX1004 (FWHM = km s-1; see Torres et al. 2014). The line strength (EW Å) has also slightly increased compared to that in the VLT/VIMOS spectra (EW Å). The velocity separation between the red and blue peaks is km s-1, which is consistent with the result in Torres et al. (2014). The centroid of the H line does not have significant radial velocity (velocity offset km s-1), while that of the VLT/VIMOS spectra shows substantial radial velocity ( km s-1; Torres et al. 2014). One possible scenario for this is that the accretion disk of CX1004 is precessing. The double-peaked profile of the H emission line is asymmetric in three of the four epochs; the relative strength of the blue peak and the red peak varies with time (see Fig. 6). This behaviour can be explained by the presence of an S-wave originating in a hot-spot or the donor star (see §IV of Johnston et al. 1989).


The prominent molecular absorptions in the wavelength range of 6300–7300 Å are signatures of an M-type companion star. However, the detailed rotational broadening analysis and spectral classification are not feasible for the Gemini/GMOS spectra of CX1004. As discussed in Torres et al. (2014), the line width and the double-peak velocity separation are consistent with that of an eclipsing quiescent CV or qLMXB. However, possibly owing to the faintness of the source, the light curve of CX1004 (see Fig. A2 of Torres et al. 2014) does not show significant periodic behaviour. Torres et al. (2014) suggested CX1004 to be a nearby source due to the lack of diffuse interstellar bands.
The four epochs of Gemini/GMOS spectra of CXB2 are shown in Fig. 7. The spectra of the first and third epochs appear to have weak, broad H emission. Both of the lines have large velocity offsets (which are also visible in the figure) with km s-1 and km s-1, respectively. The widths of the two lines are FWHM = km s-1 and km s-1, respectively. The spectrum of the fourth epoch shows a narrow H absorption feature (FWHM = km s-1), which also has a significant velocity offset ( km s-1). These large negative offsets could originate in a high space velocity of this source, which may imply a NS or a BH as the primary star. CXB2 also shows the H emission variation as we have seen in CX377. No photospheric line from the companion star is detected from the spectra of CXB2.
CXB2 is brighter in X-rays than most of the GBS sources. It has
147 Chandra ACIS-I counts in 0.3–8.0 keV band in a 2 ks
exposure. CXB2 was serendipitously detected by an archival Suzaku observation
with 53 ks exposure time (ObsID: 507031010). Full details of the X-ray analysis
will be presented elsewhere, but we briefly summarize relevant results here. The
Suzaku XIS0 and XIS1 data were reduced and analysed using standard FTOOLS.
A good spectral fit (=1.0) was found for CXB2 with an absorbed power-law
model (photon index ,
cm-2).
The X-ray flux is erg cm-2 s-1, which is
consistent with that from our Chandra observation
( erg cm-2 s-1, assuming the same spectral model).
This source is probably associated with the ASCA
source AX J1754.02929 which is 7.2′′ away (see
catalogue in Sakano et al. 2002). The X-ray flux in the ASCA
observation is cm-2 s-1 in 0.7–10 keV
band, which is similar to the X-ray flux in the Chandra observation. This source was, however, not detected in ROSAT and is
classified as a transient (Paper II).
The value is smaller than that predicted to the Galactic
Bulge ( cm-2),
hence we infer that CXB2 probably lies in the 1–4 kpc distance range. Its
near-infrared colours also indicate low reddening. The X-ray luminosity
would be 1–40 erg s-1 (assuming the above distance
range), which is consistent with either a high-inclination CV or a qLMXB.
4.2 Objects with H in Absorption

Nine sources (CX138, CX377, CXB26, CXB73, CXB117, CXB149, CXB174,
CXB189, and CXB201) in our sample
only show H absorption lines in their Gemini/GMOS
spectra (Fig. 3). We are able to obtain a spectral
classification for five of them (CX138, CX377, CXB73, CXB149, and CXB174).
The residual spectra of these sources after
optimally subtracting their best-fit stellar templates are shown in
Fig. 8. Three of them (CX138, CX377, and CXB73) have
unambiguous H emission features, which partially fill
in the stellar H absorption features in our Gemini/GMOS
spectra. We measured the strength (EW) and width (FWHM) of the
H emission shown in these residual
spectra (see Table 7).
The broad H emission (FWHM km s-1; see
Table 7 and Fig. 8) is most likely
due to the accretion disk. Therefore, for the first time, we may have
discovered a hidden population of accreting binaries where the
accretion disk contribution to the optical light is small, and the
H emission lines become apparent only after subtracting the
stellar contribution to the spectra. In what follows,
we provide further details on the spectroscopic and/or photometric
properties of several individual objects.
(a) CX138 has a broad H emission line
(FWHM km s-1) in its residual spectrum. It also has
a radial velocity variation of km s-1 between its Gemini
spectra. Therefore, CX138 is a likely candidate of the hidden
accreting binaries. The reddening measured via the strength of
DIB (EW = 1971131 mÅ) is , which also puts the object in the Galactic Bulge, if
not farther. For the Galactic Bulge distance ( kpc), the absolute
-band magnitude of CXB138 would be , suggesting a giant
companion star.
(b) CX377 is also a candidate hidden accreting binary. The Gemini/GMOS spectra of CX377 do not show any notable emission features (see Fig. 3 and Fig. 9). However, the optical spectra of CX377 taken year before (2011 May 28 and 2011 July 23) by VLT/VIMOS show strong broad H emission with an asymmetric double-peaked profile (Torres et al. 2014; see Fig. 9). The intrinsic width of the H emission is km s-1, while the double-peak separation is km s-1. This apparent dramatic change of the spectrum is not caused by incorrect targeting. The finding charts of CX377 for our Gemini/GMOS spectroscopy and for the VLT/VIMOS spectroscopy (Fig. 10; also see Fig. 9 in Torres et al. 2014) show the exact same targets. The slit was placed during our Gemini/GMOS observations (see Fig. 10) to contain both the target and the adjacent object so that we are able to distinguish their spectra. The seeing during the Gemini/GMOS observations () was better than that during the VLT/VIMOS observations (). Thus, the contamination of the nearby bright sources is less of a problem for the Gemini/GMOS spectra. Therefore, the H emission feature of CX377 indeed has significant variation within one year. Although the Gemini/GMOS spectra of CX377 only show H absorption lines, its residual spectrum after optimally subtracting the F6V standard star template shows broad H emission (see Fig. 8). The H emission has not completely disappeared, but it is significantly weaker during our Gemini/GMOS observation than during the VLT/VIMOS observations of Torres et al. (2014). It has also become narrower (FWHM = km s-1 in the Gemini/GMOS residual spectrum). This rare behaviour of H emission line variations indicates significant accretion disk variations for CX377. The soft X-ray transient GRO J165540 has shown similar strong variability of its H emission line (e.g., Soria et al. 2000). GRO J1655 has a period of 2.62 days; the spectral type of its companion star had been classified as F3–F6 (Orosz & Bailyn 1997), similar to that of CX377 (see below). However, the H emission line variability of GRO J165540 occurred when this object was going through an outburst cycle, while CX377 has remained in quiescence. It is possible that CX377 experienced a faint X-ray outburst ending before June 1, 2012 when our Gemini spectra were taken, as long as the X-ray flux remained below the detection threshold of all sky monitors such as Monitor of All-sky X-ray Image (MAXI; Matsuoka et al. 2009). Another possibility is that CX377 has variable accretion rate during quiescence.

CX377 is spectrally classified as F6 type. The relative radial velocities between the Gemini spectra of CX377 (see Table 6) are consistent with zero or less than 10 km s-1, which is not surprising given that the three object spectra were only 15 minutes apart, and the orbital period of CX377 is expected to be much longer than 15 minutes for an F6 main sequence star filling its Roche lobe. Then we cross-correlated the object spectra to the F6V star template (HD 16673). The radial velocities relative to the star template range from to km s-1. The radial velocity of the star template itself is consistent with zero ( km s-1). The light curve of CX377 obtained in July 2010 only shows non-periodic flickering with a RMS scatter of 0.06 magnitude (see Fig. A2 of Torres et al. 2014). The strength of DIB (EW mÅ) in the spectra of CX377 corresponds to . Extinction map from Gonzalez et al. (2012) gives for CX377, which is consistent with the extinction derived above. Therefore, it is likely that CX377 resides in the Galactic Bulge.
The neutral hydrogen column density,
cm-2, was estimated from the
extinction following the relation in Güver &
Özel (2009). CX377 has 7 counts in the ACIS-I 0.3–8 keV band in
the 2 ks exposure. Assuming an absorbed power-law spectrum with
photon index of 1.6, the unabsorbed X-ray flux of CX377 is
erg cm-2 s-1. At a distance of
kpc, the X-ray luminosity would be erg s-1.
With the estimated extinction and the apparent -band
magnitude (see Table 2), we calculate the absolute
magnitude of
and the X-ray to optical flux ratio
; both values are consistent with those
for a giant companion star. However,
the disk luminosity at the time of the VIMOS observation should
have been larger than that of the F6 giant (), implying
that the source might have experienced a faint X-ray outburst
(cf. Wijnands & Degenaar 2013).
(c) CXB149 and CXB174 were spectrally
classified as G6 and F4, respectively. Their residual spectra after
optimal subtraction do not
show unambiguous H emission or absorption features. The
Gemini/GMOS spectra could possibly be from interlopers instead of the true
optical counterparts of the X-ray sources. The H absorption
features of these two sources are significantly blueshifted from the
laboratory wavelength ( km s-1 for CXB149 and
km s-1 for CXB174). This shift is not introduced by
the wavelength calibration process since offsets to the sky lines were
small and they have been corrected. It cannot be explained by the
wavelength shifts caused by the centroiding uncertainty within the slit
(which are km s-1 and km s-1, respectively; see
§2.1). These velocities are consistent with that for stars
residing in the Galactic
Bulge (e.g., Zoccali et al. 2014).
Regarding the reddening measurements, CXB149 has EW(DIB )
= 109928 mÅ; the corresponding reddening
is E(B-V) 2.110.05 and , which put this
object in the Galactic Bulge or farther ( from the map of
Gonzalez et al. 2012). For CXB174, EW(DIB ) = 61634 mÅ;
the corresponding reddening is E(B-V) 1.210.06 and ,
which is consistent with the Bulge reddening () from
Gonzalez et al. (2012). The absolute magnitudes for CXB149 and CXB174 residing
in the Bulge would be and , respectively, which are
consistent with those of the giant stars with their spectral types.
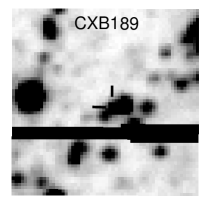
(d) CXB26 and CXB189 were not spectrally classified using our method. CXB26 is considered to be likely associated with an OGLE source away from the Chandra position (OGLE BUL-SC3 6033) which is identified as a CV (see Paper II). However, the Gemini/GMOS spectra of CXB26 do not show apparent features of an accretion disk. It is possibly a hidden accreting binary, which could be verified after it is spectrally classified with future spectroscopy. The physical nature of CXB189 remains unclear.
4.3 Objects without Apparent H Emission/Absorption Features

The remaining six sources show neither clear H emission nor absorption features in their Gemini/GMOS spectra (see Fig. 4). Three of them (CX84, CX139, CXB82) were spectrally classified (see Table 5). The residual spectra of these sources after optimally subtracting their best-fit stellar templates are shown in Fig. 8. Similar to CX138, CX377, and CXB73, they all have H emission features, which fill in the stellar H absorption features in our Gemini/GMOS spectra. To test the robustness of our results, we also subtracted other non-best-fit stellar template from the object spectra to see how the residual H emission would vary. Fig. 11 shows one example of this test. The H emission feature remains in the residual spectra of CX84 after subtracting several stellar templates with spectral types bracketing that of the best-fit template, which supports the detection of a residual accretion disk. Note that the choice of templates with non-best-fit spectral types could affect the profile of the residual H emission. For example, the mis-matched templates generate broader wings of the H emission which may result in a higher FWHM value (e.g., FWHM increases from km s-1 to km s-1 if using an F6 template spectrum).
It is worth noting that even in the case that the residual H emission features are real, there could be alternative explanations. For example, it is possible that the observed optical light is dominated by a foreground, physically unrelated star (instead of the companion star in the above scenario) so that we can only see the accretion after subtracting the foreground stellar emission. However, based on the analysis in Britt et al. (2014), we expect interloper in our sample of 21 GBS sources (also see §2.2). In §4.2, we already discussed two possible interlopers (for CXB149 and CXB174) for which the residual spectra do not have clear H emission. Therefore, it is not likely that the six optical sources that only have H emission in their residual spectra are all chance interlopers. Another possibility is that these sources are active stars/binaries, where the H emission fills in the stellar absorption features. Sources with narrower H emission (e.g., km s-1) in their residual spectra could fit into this scenario. However, it is difficult to explain the broad residual H emission lines of CX138 and CX377. The periodic modulation in the light curves of CX84, CXB82, and CXB99 could originate from either binary motion or stellar activity (hotspots). Alternative explanations for the narrowness of their H emission lines are that the binaries are relatively face-on, or that the disks are highly recessed.
CX84 is spectrally
classified as G9. The reddening estimated from the strength of
interstellar band (EW = 2499218 mÅ) is
, which means the object is in the Bulge or
farther. Assuming
CX84 resides in the Galactic Bulge, the absolute -band
magnitude would be , which indicates a G9 giant star.
The X-ray luminosity is erg s-1, which
appears higher than that for G9 giants (see Fig. 2 of Güdel 2004).
However, it is typical of long orbital period qLMXBs
(e.g., Jonker et al. 2012). The optical light curve of CX84 indeed shows a
modulation with a tentative period of 4.67 days. If it is a qLMXB, the
orbital period should be twice that value ( days)
because of the ellipsoidal modulation. In summary, the X-ray luminosity
of CX84 suggests the qLMXB nature, while the narrow residual H
emission line favors the chromospherically active star/binary scenario.
Similarly, the reddening of CXB82 derived from its near-infrared colour
() is also consistent with the reddening expected if
it resides in the Galactic Bulge. The absolute -band
magnitude () suggests a G9 giant star, while its X-ray luminosity
( erg s-1) indicates that it is more likely to
be a qLMXB. The H emission line in the residual spectrum of CXB82 is
also narrow. Based on current data, we are not able to determine whether
CX84 and CXB82 are chromospherically active stars/binaries or qLMXBs.
Among the seven potential accreting binaries identified in our sample with a spectral classification, one source (CX377) has an F-type companion star, another four (CX84, CX138, CXB73, CXB82) have G-type companion stars, while the other two (CX139 and CXB99) have K-type companion stars. Given the mass of F/G-type companion stars, the mass ratios ( here) for the sources with F/G-type companion stars should be higher than those of the more typical X-ray binaries with later spectral types (K, M). In contrast to LMXBs, very few of these “intermediate” mass X-ray binaries (IMXBs) have been found. Existing examples include Cyg X-2 (e.g., Casares et al. 2010) and Her X-1 (e.g., Reynolds et al. 1997). Our Gemini/GMOS spectroscopy indicates that the GBS may be able to provide an example of this type of X-ray binary.
5 Conclusions
The GBS is a multiwavelength survey project where one of the goals is to identify X-ray binaries in the Galactic Bulge area. In this work, we present optical and infrared photometry, and Gemini/GMOS spectroscopy of 21 GBS X-ray sources detected in the GBS. One prime goal of the GBS is to identify eclipsing qLMXBs. CX446, CX1004 and CXB2 are promising candidates to be eclipsing qLMXBs. CX446 has broad H emission, and its optical light curve shows likely eclipsing events. CX1004 has broad, double-peaked H emission. The light curve of CXB2 also contains eclipsing events suggesting a high systemic inclination.
We may have discovered a population of hidden accreting binaries. After optimally subtracting the stellar templates with matched spectral type, the residual spectra of seven sources show H emission. Three of them (CX138, CX377, and CXB73) have broad ( km s-1) H lines, which are likely produced by an accretion disk. CX84 and CXB82 are also possibly hidden accreting binaries based on their X-ray luminosity, while their residual H emission lines are narrow ( km s-1). Previous VLT/VIMOS spectra of CX377 showed a strong, double-peaked H emission line, while our Gemini/GMOS spectra of CX377 only contains an H absorption line. This may indicate the strong variability of the accretion disk of this source. The residual spectrum of CX377 after optimal subtraction supports this scenario by showing weak, broad H emission.
In summary, based on the emission features, the spectral classification, X-ray luminosity, and the residual spectra after optimal subtraction, we are able to constrain the likely nature for eight sources in our sample: CX446, CX1004, and CXB2 are accreting binaries (CVs or qLMXBs) while CX446 and CXB2 are likely also eclipsing; CXB64 and CXB113 are chromospherically active stars or binaries; CX138, CX377, and CXB73 could be hidden accreting binaries.
Appendix A: Finding Charts
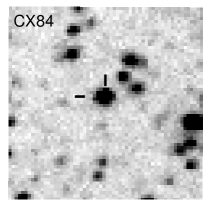
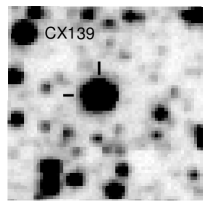
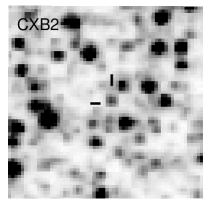
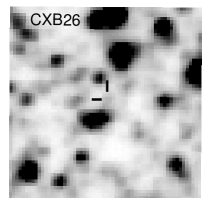
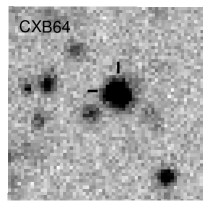
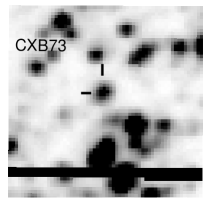
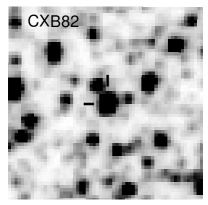
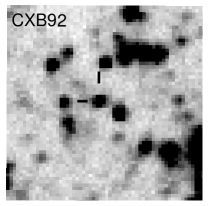
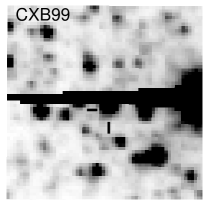
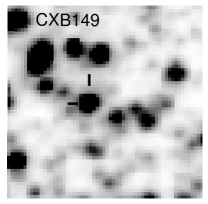
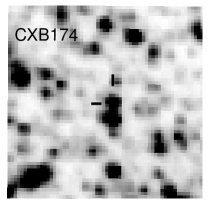
The -band finding charts for the optical counterparts of 18 of the 21 GBS sources presented in this paper are shown in Fig. 12 and Fig. 13 . The sky area in each chart is 2020′′ (except for CXB113 which is 2015′′) with the source in the center and indicated by the thick horizontal and vertical short bars. North is up and East is to the left. CXB189 is blended with a nearby bright source because the field is crowded. Part of the emission from the nearby bright source may leak into the slit. The finding chart for CX377 is shown in Fig. 10. The charts for CX446 and CX1004 can be found in Torres et al. (2014).
Acknowledgments
We would like to thank the referee, Prof. P. Charles, for
his comments which substantially improved the paper. The
software packages pamela, and molly
utilized in this work were developed by T. Marsh.
R.I.H., C.B.J., and C.T.B., acknowledge support from the National
Science Foundation under Grant No. AST-0908789 and from the National
Aeronautics and Space Administration through Chandra Award Number
AR3-14002X issued by the Chandra X-ray Observatory Center, which is
operated by the Smithsonian Astrophysical Observatory for and on
behalf of the National Aeronautics Space Administration under contract
NAS8-03060. D.S. acknowledges the support of the Science and
Technology Facilities Council, grant number ST/L000733/1. C.O.H. is
supported by NSERC, an Ingenuity New Faculty Award, and an
Alexander von Humboldt fellowship.
References
- [Alard(2000)] Alard C., 2000, A&AS, 144, 363
- [Alard & Lupton(1998)] Alard C., Lupton R. H., 1998, ApJ, 503, 325
- [Bassa et al.(2006)] Bassa C. G., van Kerkwijk M. H., Koester D., Verbunt F. 2006, A&A, 456, 295
- [Britt et al.(2013)] Britt C. T. et al., 2013, ApJ, 769, 120
- [Britt et al.(2014)] Britt C. T. et al., 2014, ApJS, 214, 10
- [Casares et al.(2010)] Casares J., González Hernández J. I., Israelian G., Rebolo R., 2010, MNRAS, 401, 2517
- [Condon et al.(1998)] Condon J. J., Cotton W. D., Greisen E. W., Yin Q. F., Perley R. A., Taylor G. B., Broderick J. J., 1998, AJ, 115, 1693
- [Davies et al.(1997)] Davies R. L. et al., 1997, Proc SPIE, 2871,1099
- [Evans et al.(2002)] Evans D. W., Irwin M. J., Helmer, L., 2002, A&A, 395, 347
- [Gonzalez et al.(2011)] Gonzalez O. A., Rejkuba M., Zoccali M., Valenti E., Minniti D., 2011, A&A, 534, A3
- [Gonzalez et al.(2012)] Gonzalez O. A., Rejkuba M., Zoccali M., Valenti E., Minniti D., Schultheis M., Tobar R., Chen B., 2012, A&A, 543, A13
- [Greiss et al.(2014)] Greiss S. et al., 2014, MNRAS, 438, 2839
- [Güdel(2004)] Güdel M., 2004, A&AR, 12, 71
- [Güver & Özel(2009)] Güver T., & Özel F., 2009, MNRAS, 400, 2050
- [Herbig(1993)] Herbig G. H., 1993, ApJ, 407, 142
- [Herbig(1995)] Herbig G. H., 1995, ARA&A, 33, 19
- [Hynes et al.(2006)] Hynes R. I., Horne Keith, O’Brien K., Haswell C. A., Robinson E. L., King A. R., Charles P. A., Pearson K. J., 2006, ApJ, 648, 1156
- [Hynes et al.(2012)] Hynes R. I. et al., 2012, ApJ, 761, 162
- [Hynes et al.(2014)] Hynes R. I. et al., 2014, ApJ, 780, 11
- [Jehin et al.(2005)] Jehin E., Bagnulo S., Melo C., Ledoux C., Cabanac R. 2005, in Hill V., François P., Primas F., eds, IAU Symp. 228, From Lithium to Uranium: Elemental Tracers of Early Cosmic Evolution. Cambridge University Press, p. 261
- [Johnston et al.(1989)] Johnston H. M., Kulkarni S. R., Oke J. B., 1989, ApJ, 345, 492
- [Jonker et al.(2011)] Jonker P. G. et al., 2011, ApJS, 194, 18 (Paper I)
- [Jonker et al.(2012)] Jonker P. G., Miller-Jones J. C. A., Homan J., Tomsick J., Fender R. P., Kaaret P., Markoff S., Gallo E., 2012, MNRAS, 423, 3308
- [Jonker et al.(2014)] Jonker P. G. et al., 2014, ApJS, 210, 18 (Paper II)
- [Kurucz(2006)] Kurucz R. L., 2006, preprint (arXiv:astro-ph/0605029)
- [Lucas et al.(2008)] Lucas P. W. et al., 2008, MNRAS, 391, 136
- [Maccarone et al.(2012)] Maccarone T. J. et al., 2012, MNRAS, 426, 3057
- [Marsh(1989)] Marsh T. R., 1989, PASP, 101, 1032
- [Marsh et al.(1994)] Marsh T. R., Robinson E. L., Wood J. H., 1994, MNRAS, 266, 137
- [Matsuoka et al.(2009)] Matsuoka M. et al., 2009, PASJ, 61, 999
- [Mauerhan et al.(2009)] Mauerhan J. C., Muno M. P., Morris M. R., Bauer F. E., Nishiyama S., Nagata T., 2009, ApJ, 703, 30
- [Minniti et al.(2010)] Minniti D. et al., 2010, New Astron., 15, 433
- [Muno et al.(2003)] Muno M. P. et al., 2003, ApJ, 589, 225
- [Orosz & Bailyn(1997)] Orosz J. A., Bailyn C. D., 1997, ApJ, 477, 876
- [Özel et al.(2010)] Özel F., Psaltis D., Narayan R., McClintock J. E., 2010, ApJ, 725, 1918
- [Pecaut & Mamajek (2013)] Pecaut M. J., Mamajek E. E., 2013, ApJS, 208, 9
- [Ratti et al.(2013)] Ratti E. M. et al., 2013, MNRAS, 428, 3543
- [Reynolds et al.(1997)] Reynolds A. P., Quaintrell H., Still M. D., Roche P., Chakrabarty D., Levine S. E., 1997, MNRAS, 288, 43
- [Sakano et al.(2002)] Sakano M., Koyama K., Murakami H., Maeda Y., Yamauchi S., 2002, ApJS, 138, 19
- [Shaw (2009)] Shaw R. A., ed. 2009, NOAO Data Handbook, Version 1.1. National Optical Astronomical Observatory, Tucson.
- [Skrutskie et al.(2006)] Skrutskie M. F., et al., 2006, AJ, 131, 1163
- [Soria et al.(2000)] Soria R., Wu K., Hunstead R. W., 2000, ApJ, 539, 445
- [Stetson(1987)] Stetson P. B., 1987, PASP, 99, 191
- [Torres et al.(2014)] Torres M. A. P. et al., 2014, MNRAS, 440, 365
- [Udalski et al.(1992)] Udalski A., Szymanski M., Kaluzny J., Kubiak M., Mateo M., 1992, Acta Astron., 42, 253
- [Wallace et al.(2011)] Wallace L., Hinkle K. H., Livingston W. C., Davis S. P., 2011, ApJS, 195, 6
- [Walter et al.(1980)] Walter F. M., Cash W., Charles P. A., Bowyer C. S., 1980, ApJ, 236, 212
- [Wijnands & Degenaar(2013)] Wijnands R., Degenaar N., 2013, MNRAS, 434, 1599
- [Zoccali et al.(2014)] Zoccali M. et al., 2014, A&A, 562, A66


| GBS | R.A. (J2000) | Dec. (J2000) | Observation ID | Date (UT) | Integration | Seeing |
|---|---|---|---|---|---|---|
| ID | (HH:MM:SS.SS) | (DD:MM:SS.S) | (GS-2012A-Q) | Time (s) | (arcsec) | |
| CX84 | 67-48 | 2012-05-31 | 1200 | 0.5 | ||
| 67-9 | 2012-06-01 | 1200 | 0.5 | |||
| CX138 | 67-52 | 2012-06-01 | 1200 | 0.5 | ||
| 67-15 | 2012-06-14 | 1200 | 1.1 | |||
| CX139 | 67-3 | 2012-05-31 | 900 | 0.6 | ||
| 67-44 | 2012-06-01 | 900 | 0.6 | |||
| CX377 | 67-70 | 2012-06-01 | 0.6 | |||
| 67-72 | 2012-06-09 | 1.1 | ||||
| CX446 | 67-96 | 2012-06-22 | 0.8 | |||
| 67-109 | 2013-05-04 | 0.6 | ||||
| CX1004 | 44-63 | 2012-05-14 | 0.8 | |||
| 44-59 | 2012-05-17 | 0.8 | ||||
| 44-3 | 2012-05-17 | 0.8 | ||||
| 44-61 | 2012-05-17 | 0.7 | ||||
| CXB2 | 44-53 | 2012-04-20 | 0.9 | |||
| 44-55 | 2012-04-20 | 0.9 | ||||
| 44-57 | 2012-04-20 | 0.8 | ||||
| 44-80 | 2012-05-19 | 0.9 | ||||
| CXB26 | 44-49 | 2012-05-17 | 0.7 | |||
| CXB38 | 67-21 | 2012-06-09 | 1.3 | |||
| CXB64 | 67-74 | 2012-05-29 | 0.7 | |||
| CXB73 | 67-68 | 2012-06-22 | 1.1 | |||
| CXB82 | 67-66 | 2012-06-14 | 1.0 | |||
| 67-99 | 2012-06-22 | 1.0 | ||||
| CXB92 | 44-47 | 2012-05-03 | 0.7 | |||
| 44-85 | 2012-05-19 | 900 | 1.1 | |||
| CXB99 | 67-64 | 2012-06-09 | 1.2 | |||
| CXB113 | 67-62 | 2012-06-22 | 900 | 1.1 | ||
| CXB117 | 67-60 | 2012-06-01 | 0.6 | |||
| CXB137 | 44-45 | 2012-05-17 | 0.8 | |||
| CXB149 | 67-58 | 2012-05-31 | 0.5 | |||
| CXB174 | 44-43 | 2012-04-19 | 0.6 | |||
| CXB189 | 44-41 | 2012-04-19 | 1.0 | |||
| CXB201 | 44-39 | 2012-04-19 | 0.9 |
| GBS ID | Mean() | Err() aaThe mean error of the magnitudes for the object. | () bbThe standard deviation of the magnitudes for the object. | No. of Frames |
|---|---|---|---|---|
| CX84 | 19.018 | 0.007 | 0.029 | 35 |
| CX377 | 18.885 | 0.009 | 0.060 | 36 |
| CX446 | 21.162 | 0.062 | 0.166 | 37 |
| CX1004 | 20.761 | 0.019 | 0.040 | 35 |
| CXB2 | 20.350 | 0.003 | 0.14 | 110 |
| CXB64 | ccThe magnitude here is approximate because of a lack of calibrator stars in the field of view. | 0.011 | 0.014 | 56 |
| CXB82 | 16.894 | 0.006 | 0.023 | 52 |
| CXB99 | 16.516 | 0.021 | 0.073 | 110 |
| CXB113 | ccThe magnitude here is approximate because of a lack of calibrator stars in the field of view. | 0.018 | 0.041 | 55 |
| GBS ID | R.A.(VVV; J2000) | Dec.(VVV; J2000) | aaThe offset between near-infrared position and optical position, in arcseconds. | |||
|---|---|---|---|---|---|---|
| (HH:MM:SS.SS) | (DD:MM:SS.S) | (arcsec) | (mag) | (mag) | (mag) | |
| CX84 | ||||||
| CX138 | ||||||
| CX139 | ||||||
| CX377 | ||||||
| CXB2 | ||||||
| CXB38 | ||||||
| CXB73 | ||||||
| CXB82 | ||||||
| CXB92 | ||||||
| CXB99 | ||||||
| CXB113 | ||||||
| CXB149 | ||||||
| CXB174 |
| Spectral Type | Star Name |
|---|---|
| A0V | HD 162305 |
| A1V | HD 65810 |
| A2V | HD 60178 |
| A3V | HD 211998 |
| A4V | HD 145689 |
| A5V | HD 39060 |
| A7V | HD 187642 |
| A9V | HD 26612 |
| F0V | HD 109931 |
| F1V | HD 40136 |
| F2V | HD 33256 |
| F3V | HD 18692 |
| F4V | HD 37495 |
| F6V | HD 16673 |
| F8V | HD 45067 |
| F9V | HD 10647 |
| G0V | HD 105113 |
| G1V | HD 20807 |
| G2V | HD 14802 |
| G3V | HD 211415 |
| G4V | HD 59967 |
| G5V | HD 59468 |
| G6V | HD 140901 |
| G9V | HD 25069 |
| K2V | HD 22049 |
| K5V | HD 10361 |
| M0V | HD 156274 |
| M6V | HD 34055 |
| GBS ID | Spectral Type |
|---|---|
| CX84 | G9 |
| CX138 | G9 |
| CX139 | K2 |
| CX377 | F6 |
| CX1004aaThese three sources cannot be spectrally classified via optimal subtraction. However, their spectra contain features (e.g., TiO band) of early-to-mid M-type stars. | M0–M5 |
| CXB64aaThese three sources cannot be spectrally classified via optimal subtraction. However, their spectra contain features (e.g., TiO band) of early-to-mid M-type stars. | M0–M5 |
| CXB73 | G9 |
| CXB82 | G9 |
| CXB99 | K2 |
| CXB113aaThese three sources cannot be spectrally classified via optimal subtraction. However, their spectra contain features (e.g., TiO band) of early-to-mid M-type stars. | M0–M5 |
| CXB149 | G6 |
| CXB174 | F4 |
| GBS ID | HJD | RV1 (km s-1)aaThe radial velocity (RV) results when using the first source spectrum as a cross-correlation template; thus the RV1 value for the first source spectra is always zero. | RV2 (km s-1)bbThe radial velocity (RV) results when using the star template spectrum with the spectral type shown in Table 5 as a cross-correlation template. |
|---|---|---|---|
| CX84 | |||
| CX138 | |||
| CX139 | |||
| CX377 | |||
| CXB73 | |||
| CXB82 | |||
| CXB99 | |||
Note. — Among the sources not listed in this table, seven of them (CX446, CX1004, CXB2, CXB64, CXB92, CXB113, and CXB137) do not show significant cross-correlations between their Gemini/GMOS spectra, while the other seven (CXB26, CXB38, CXB117, CXB149, CXB174, CXB189, and CXB201) have relative radial velocities consistent with zero.
| GBS ID | EW (Å) | FWHM(Å) aaThe FWHM of the H emission/absorption lines before correcting for instrumental broadening, in unit of Å. | FWHM(km s-1) bbThe FWHM of the H emission/absorption lines after correcting for instrumental broadening, in unit of km s-1. The FWHM values quoted in the text (in unit of km s-1) are also corrected for instrumental broadening. | |
|---|---|---|---|---|
| CX377 | ||||
| CX446 | ||||
| CX1004ccThe measurements listed here are for the full H emission profile. For the measurements of each individual peak, see the text in §4.1.1. | ||||
| CXB2 | ||||
| CXB64 | ||||
| CXB99 | ||||
| CXB113 | ||||
| CX84 | ||||
| CX138 | ||||
| CX139 | ||||
| CX377 | ||||
| CXB73 | ||||
| CXB82 | ||||
| CXB99 |
Note. — The upper part of the table shows the measurements of H emission/absorption lines in the Gemini/GMOS spectra of the GBS sources. The lower part of the tables lists the measurements of the H emission lines in the residual spectra. The residual spectra are obtained by optimally subtracting the best-fit stellar templates (see Fig. 8 for residual spectra).