Stable localized moving patterns in the 2-D Gray-Scott model
Abstract
I show stable, localized, single and multi-spot patterns of three classes – stationary, moving, and rotating – that exist within a limited range of parameter values in the two-dimensional Gray-Scott reaction-diffusion model with . These patterns exist in domains of any size, and appear to derive their stability from a constructive reinforcement effect of the standing waves that surround any feature. There are several common elements – including a spot that behaves as a quasiparticle, a U-shaped stripe, and a ring or annulus, or a portion thereof – which combine to form a great variety of stable structures. These patterns interact with each other in a variety of ways. There are similarities to other reaction-diffusion systems and to physical experiments; I offer several suggestions for further research.
Key words: Gray-Scott model, Reaction-diffusion, Pattern formation, Numerical simulation
PACS: 82.40.Ck, 82.40.Bj, 47.54.De, 87.18.Hf
1 Introduction
The Gray-Scott model [2] is a widely-studied model of a pair of reactions involving cubic autocatalysis. It has been applied in reaction-diffusion models in one [9, 10, 16, 17, 20], two [5, 16, 19, 22, 25] and three [21, 24] dimensions. Widely-known results include the existence of stable single spots, self-replication of spots, spontaneous formation of stripes and hexagonal arrays of spots, and Turing patterns [9]. Findings that show a lack of moving stable patterns, e.g. [10] apply only in 1-D or a limited region of the 2-D system parameter space ([16] p. 81 and [19] p. 3). [19] shows existence of stable multi-spot patterns within a finite domain.
The model equations are:
| (1) | ||||
This paper concerns the two-dimensional case with periodic boundary conditions. I use similar terminology and symbols to those in [5]: and are the concentrations of two reactants and , normalized to dimensionless units. Parameters and represent the feed rate and removal rate of the reactants in the original homogeneous continuously-stirred tank reactor model; in diffusion systems they are typically the rates at which and permeate through a membrane separating a homogeneous supply from the gel in which the patterned reactions occur [6]. and are the diffusion rates of the two reactants through the gel or other medium; considered together as a ratio , they constitute a third parameter that determines certain characteristics of the parameter space [9]. In this paper, and . Since I am measuring the size, velocity, and other related statistics of certain features in observed patterns, there is a need for time and length units. For this purpose I use the dimensionless units of length and time implicit in the equations, and refer to them as lu (“length unit”) and tu (“time unit”) respectively.
2 Methods
I used numerical simulation similar to that of Pearson [5] (discrete Euler forward integration, also called forward-time centered-space [4]). All figures shown here were produced with a grid, with representing a system size of , periodic boundary conditions, and .
Results were verified using higher grid resolution, smaller time steps, and 2nd and 4th order Runge-Kutta integration. Because many of these patterns exhibit novel properties (such as stability combined with motion) it was necessary to perform a thorough series of measurements to isolate the legitimate “real” phenomena from any effects that arise from simulation error.
In these tests, the grid resolution , time step , and stability index (the variable component of the Courant condition, see [4, 9]) were each decreased in steps of , and respectively. The finest resolution used was with double-precision arithmetic.
| measured velocities | range of stable U pattern | ||||
|---|---|---|---|---|---|
| U | 3-dot | (to within ) | |||
| measured velocities | range of stable U pattern | ||||
|---|---|---|---|---|---|
| U | 3-dot | (to within ) | |||
These tests showed no qualitative difference in the results, but did enable more accurate determination of certain measurements. For example, the “measured velocities” in Tables 1 and 2 have a measurement error of 1 part in 200 due to the procedure used, and the increases in and resolution had no significant effect on the measured velocities: but the double-precision tests show a somewhat greater consistency (i.e. lower variance) in the same measurement across different grid resolutions.
All phenomena reported in the remainder of this paper appear at the grid resolutions of [5], , with single-precision arithmetic. A few grid effects are apparent at this lower resolution, for example the two-spot pattern in figure 4(a) reorients to a diagonal alignment. Such effects diminish sharply at higher grid resolutions.
The initial state was created in several ways. Most results were produced by starting with a background level of and set to a homogeneous state computed from and . There is always a stable state , sometimes called the “red state” [5, 8, 9]. For sufficiently small there are two other homogeneous states, one of which can be stable (called the “blue state”, due to the color of the pH indicator bromothymol blue the laboratory experiments of [6]). Transforming the variables and units from Muratov and Osipov[16], the third homogeneous state exists when , with and given by
| (2) |
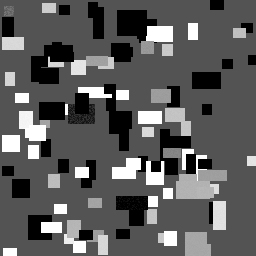
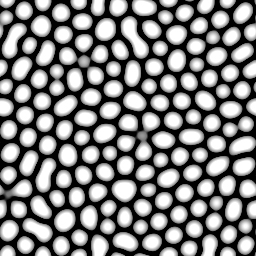
where is . Starting with a grid filled with these values of and or with , a number of rectangles were added whose width, height, locations, and number were determined randomly, and then filled with random levels of and . For most tests, these rectangles ranged from to in area, and the frequency of occurrence of any given size rectangle was inversely proportional to its area. Density of these rectangles ranged anywhere from 1 to 40 per . A typical example is shown in figure 1.


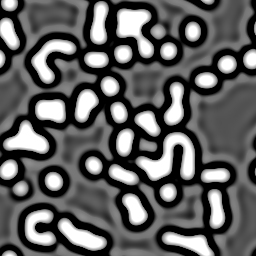
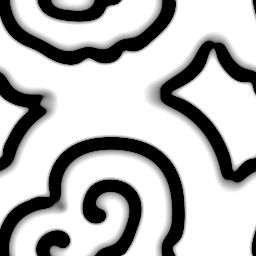
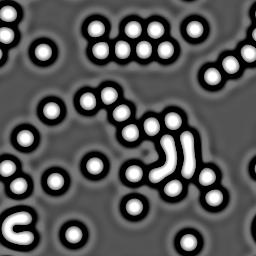
A repeatable pseudo-random algorithm was used to generate all starting patterns, and the initial seed values saved so the same simulation sequence could be reproduced at will [11]. The simulation was run for anywhere from to tu, as needed for the phenomena under test. A complete survey of the parameter space in figure 2 was performed at intervals of 0.02 in and 0.04 in ; many starting patterns were tried at each parameter value combination. The interested reader can find a gallery of images online at [27].
Although all of the patterns shown here arose naturally from such initial random states, a number of techniques were used to make exploration and discovery more practical: Selectively removing unwanted patterns by setting portions of the grid to the homogeneous state; combining parts of patterns to create others; changing parameter values; moving small parts of the grid to test pattern integrity; then continuing the simulation after making any of these changes.
Because of their stability, each type pattern naturally evolves from any starting pattern that superficially resembles it, provided the dimensions and levels of and are approximately correct.
I found it exceptionally useful to visualize and simultaneously via appropriate color mappings, with the latter greatly amplified as in figure 4(b). An interactive simulation tool was essential for the discovery of stable moving patterns “in the wild”. Most work was performed on an 8-core Xeon workstation; verification tests were also performed on a PowerPC workstation. The simulation was implemented in C, divided into anywhere from 2 to 16 execution threads via pthreads. The data set was partitioned in one dimension only (stripes, each overlapping by two rows with the two neighbor stripes); all inter-thread data exchange was via shared memory.
Additional insight was gained from 1-D and 3-D numerical simulations (the latter from the website at [24]).
3 Principal Findings
I noted all of the pattern types reported in Pearson [5], including several parameter values at which two or more of Pearson’s types coexist; many examples are exhibited at [27]. In addition I observed three new pattern types, illustrated in figure 3 and named , and to extend Pearson’s classification letters.
Type is found throughout a large part of the area labeled R in [5], bordering on the regions , , and . Here we have stable spots (called solitons or autosolitons by others [16, 26]) that do not multiply. These spots are static only in isolation. Pairs and groups drift apart from one another, at a rate that diminishes sharply with distance. The velocity of two spots drifting apart in a sufficiently large and otherwise empty domain is modeled fairly well by an exponentially decaying rate: velocity where is inter-spot distance, and constant. For as shown here, : the spots drift about half as fast with every added of inter-spot distance. increases with and with ; for example, at , ; and at , . Given enough time and a small domain size, motion ceases with spots roughly equidistant; such multi-spot patterns are the subject of [19]. At lower values, particularly for , spot-like starting patterns produce spots that oscillate with a characteristic frequency varying slightly with and , and a damping rate that diminishes sharply as approaches the right edge of the type region in figure 2. Near this frontier the stable spot becomes smaller in diameter and the central peak has farther from . Also in figure 2 we see that at higher values type occurs on both sides of the saddle-node bifurcation line. As Mazin et. al. found in one dimension [9], at higher values the red state overpowers the blue state in a substantial band to the left of the saddle-node line; however it is not strong enough to extinguish small spots. For this reason, parameters in this band support solitons that do not grow to fill the space with the blue state.
Type is found in a modest-sized area of the parameter space which includes and . As shown in figure 2, type appears on both sides of the saddle-node bifurcation. It also appears on both sides of the subcritical/supercritical boundary at (when , the model without diffusion oscillates indefinitely; see [7] and [9]). Type patterns very closely resemble the B-Z (Belousov-Zhabotinsky) reaction in a Petri dish. An initial pattern containing a traveling wave front with free ends produces two spiral seeds and usually results in sustained activity. At some parameter values the waves develop flaws similar to the segmented waves shown in [23] (which is discussing a CDIMA system); these flaws contribute to the production of more spiral seeds. Occasionally, double spirals also occur. A self-sustaining population of spiral seeds is needed to maintain the pattern, and the density of seeds varies with and . The longevity of the pattern is highly dependent on the size of the domain. At , twenty starting patterns like that in figure 1 (a domain) had an average life-span of 5400 tu before all waves died out. Twenty trials in a domain with starting patterns of the same density all lasted longer than tu.

Type is the most novel and the subject of the rest of this paper. I found patterns in this category for values ranging from to , in a very thin band of values; figure 2 shows four representative locations in this band. The band runs roughly parallel to the saddle-node and Turing lines, and to the left (lower values) of both. It is also at lower values than the area investigated by McGough and Riley [22].
In [5] Pearson explored some parameter values near this area, initializing the system with red state and a small central rectangle of , and found that the system evolved to a homogeneous blue state; these were designated B. Mazin et. al. [9] using a similar starting pattern in one-dimensional simulations, explored a greater number of and combinations, and found many for which stable localized structures result; these were designated L.
At all values the band is very narrow in as compared to its distance from the bifurcation lines. For example, when , the saddle-node bifurcation is at , the Hopf bifurcation is at , the Turing bifurcation is at , and the range of valid values for the object in the lower-left of figure 4(a) is . Thus the width of the band near is about in units of , while the distance to the nearby Turing region is ten times as great.
4 Stability and motion of type Patterns
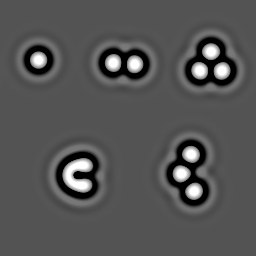
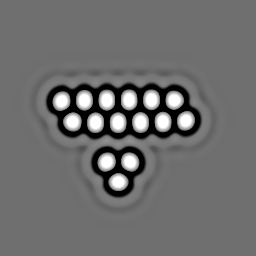
Figure 4(a) shows five patterns at and . The three in the upper row are stable non-moving patterns. Contrast has been exaggerated in the area of to show the concentric rings or “halos” that surround all patterns in systems with these parameters. The halos are concentric stationary waves of alternating sign superimposed on the homogeneous state values in (2). The full range of and levels for type patterns at is and .
The other two patterns in figure 4(a) move to the left, indefinitely at constant speed; the three-spot pattern moves at about 1 lu per , and the U-shaped pattern at about 1 lu per .
All of the patterns in 4(a) arise frequently from random starting patterns, and are resilient to noise and other perturbations. If any of them is perturbed by shifting half of the pattern in any direction a distance on the order of 0.02 lu, further simulation results in a return to the canonical forms shown here.
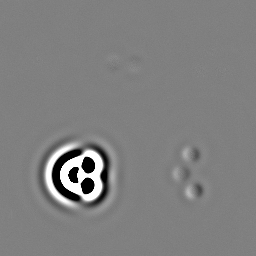
Figure 4(b) shows the time derivative of for the same five patterns. The motion of the two patterns in the bottom half of the figure is clear.
Figure 4(c) shows two rotating patterns. Both rotate clockwise; the four-spot pattern performs one full revolution in about ; the other takes about . Disruptions to these will cause a momentary change in rotational velocity followed by a return to the normal rotation rate after the spots return to the stable alignment.
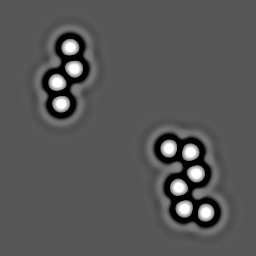
Many stripelike patterns like those in figure 4(d) arise from random starting patterns; one-ended forms are more common than the two-ended versions shown here. They are stable in the central linear section, in the direction perpendicular to their length, but are unstable in the other dimension. Any deviation from a straight line will increase, first slowly and then with increasing speed, forming meanders like those of a river in a floodplain. These linear forms grow at both ends. The top one is the fastest, each end grows at about 1 lu per , slightly slower than the speed of the U-shaped pattern in figure 4(a). The second example grows at 1 lu per from each end. The third example has two spots at each end that make it grow (at about 1 lu per ); without these spots the pattern shrinks at each end. When encountering other objects, these stripelike patterns will change direction, stop growing, or (frequently in the case of the topmost example) break down into some other form, such as separate parallel stripes.
Systems that contain active growing stripes will usually grow to fill all available space with spots and stripes, but the time taken and the final proportion of spots to stripes is highly variable, and depends on tiny details of the initial configuration. This is substantially different from the behavior of stripes at other parameter values in the Gray-Scott system, whose final density can generally be predicted from the parameter values alone.
The central portions of the stripelike patterns in figure 4(d) suggest a connection with certain one-dimensional localized structures found by Mazin et. al in [9] at parameter values in their region L. In my tests I found that the dimensions and levels of and of features in 1-D simulations were effectively the same as cross-sections of stripe-like patterns in 2-dimensional simulations when the same parameter values are used.

5 Variations with small changes to
The patterns in figure 4(a) are shown as they appear when and . If is diminished below , the U-shaped moving pattern is no longer viable and decays into a single spot. When the single spot shown in the upper-left of figure 4(a) is no longer stable and quickly evolves to the homogeneous state, however the other three patterns made up of spots continue to exist. When is lowered below , the patterns in the top center and lower right vanish, but the triangular three-spot pattern remains. Below the triangular pattern vanishes, but a 7-spot arrangement similar to that in figure 5(c) is still viable. The 7-spot pattern dies out when .



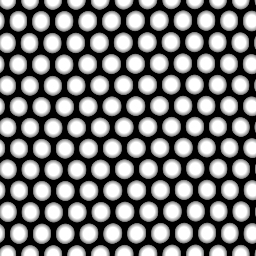
At the 5-spot pattern in figure 5(a) is stable and moves to the left slowly. Using this as the starting pattern, is increased to 0.06110, and a spot forms in the center to make the 6-spot pattern in figure 5(b). This pattern is also left-moving and stable. Increasing further to , a seventh spot appears (figure 5(c)), and motion stops due to the attainment of symmetry. Throughout this process the spots shift away from one another slightly to attain a new steady state, with a slightly greater inter-spot spacing with each increase in .
Increasing to , new spots appear on all sides, quickly growing to produce the uniform hexagonal grid in figure 5(d).
Groups of spots are no longer stable at these relatively high values – if is increased more gradually from 0.06135 to 0.06150 (for example in 15 equal steps at intervals of ), some or all of the spots will have time to swell into elongated “stripes” of high . Even at the seven-spot pattern shown in 5(c) is barely stable, and groupings of more than 7 spots produce stripelike patterns.
Considered together, the range of different behaviors described thus far represents a very wide spectrum of phenomena in the relatively narrow range . A similar spectrum is found at higher and lower values, although varying in details. For example, the behavior shown in figure 5(d) has been observed at several values of from 0.046 to 0.0652; at higher values a greater change in is needed to precipitate the growth of the hexagonal pattern, and it appears that at significantly higher the phenomenon cannot be produced at all. The U-shaped moving pattern has been found to be stable at values from 0.0492 to 0.0876, with varying as illustrated in figure 2.
At , the Turing effect is present. Here, no initial spots are needed to generate a pattern of spots and/or stripes. As defined by [1] (see also the introductory section of [9]) Turing patterns arise spontaneously from random noise of arbitrarily low initial amplitude, diffusion plays an active role in the destabilization of the initial state, and a characteristic wavelength (spot size and/or stripe width) exists that is independent of the system size. Figure 5(e) shows a typical Turing pattern in the 2-D Gray-Scott system; it was produced from a starting pattern of “white” noise with amplitude superimposed on the blue state from (2). We see similarities, such as hexagonal arrangement of spots and a similar spot size and spacing, to figure 5(d). However, many grain boundaries, short stripes and other differences in detail are present. This is typical of patterns throughout the Turing domain, which at includes values in the range (see [9] for a derivation of the formulas for these values; is the Hopf bifurcation).
6 Distance interactions and more exotic patterns
Figures 6(a) and 6(b) show two frames of a simulation in which was gradually increased from 0.06058 to 0.06110 over . The overall length of the horizontal row of spots increases with , and the smaller 3-spot pattern moves slightly away from it. The entire set of 15 spots also rotates very slowly as a unit. Similar interactions between patterns that are not in direct contact are very common. Decreasing back to 0.06058 over a similar time period causes the pattern to return to the state in 6(a).
In figure 6(c), the U-shaped feature is moving to the right and slightly downward. It interacts weakly with the stripelike feature, then more strongly with the triangular array of spots to the right, and emerges traveling on a diagonal path towards the upper-right. An animation of this is available at [28].

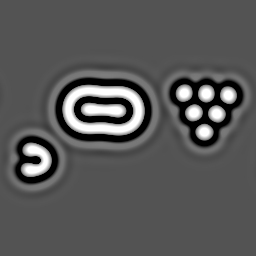
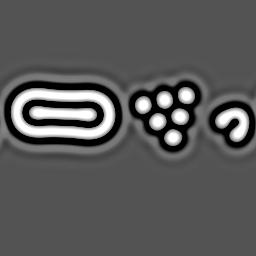
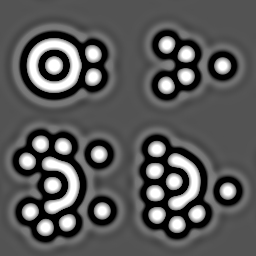
In figure 7 are six rotating patterns with a “target” pattern in the center. The first three are asymmetrical; each of these transforms into the corresponding symmetrical version; the center shifts a bit in the process. All rotate clockwise. The solitary spots in the second example are pushed by the triads. In figure 7(b) one of the spots is stationary; after becoming symmetrical as shown in 7(e) both spots are moving. Each of these solitary spots remains at the distance shown, about twice the radius of the brightest surrounding halo, from the annulus of the “target” and from the two closer spots of the triad immediately following it.
Figure 7(g) shows several more moving patterns. All move to the right. The pattern in the upper-left is an example of many variations of the “target” with attached spots that arise from random starting patterns. Most remain stable and move; symmetrical forms move on a straight path and asymmetrical forms move on a curved path. The “target” by itself is also stable and does not move. The other three all involve spots that are being “pushed” ahead of a larger pattern; in all cases the larger pattern moves faster if the spots in front are removed. The asymmetrical pattern in the lower-right moves on a curved path, bending to its right as it moves forward. In the process the spot is pushed out of the way, and is left behind after about the first quarter-turn of the moving pattern’s path. An animation of this is available at [28].






7 Similarity to Other Systems
Several other authors describe spots with appearance and interaction similar to the spots shown in this paper.
Schenk, et. al. [12], studying a two-component cubic autocatalytic reaction-diffusion system, found parameter values for which there is a stable spot solution with concentric rings of alternating sign and diminishing magnitude. For certain parameter values they found that the spots interact in a similar way to that described in this paper; they showed some stable multi-spot arrangements similar to my figure 4(a) and proposed several more. There are some differences, for example the pattern in their figure 5(e) (a four-spot pattern in a Y configuration with unequal angles) is not stable in the Gray-Scott system with parameters , nor at several other locations I tested throughout the region. I also found the pattern in their figure 5(b) (three spots in a straight line) to be stable, whereas they did not. Such differences might result from differences in the spacing and relative amplitudes of the halos.
In work related to [12], a number of researchers including Purwins et. al. [13] have identified and studied “quasi-particles” that can arrange themselves in a very similar manner to my figures 4(a) and 5(d). This can be seen clearly in figures 3 (d), (g), and (h) of the web page article by Stollenwerk [26]. Note in particular the halos around the spots in their figure 3(d). These spots arose in laboratory AC gas plasma discharge experiments that have other features reminiscent of patterns seen in the two-dimensional Gray-Scott system.
Liehr, et. al. in [15], modeling a DC gas plasma discharge experiment, began with a 3-component reaction-diffusion system, then transformed the equations into a two-component form with a global integration term. In numerical simulation (see their figures 3 and 5) they achieved results similar to my figures 5(c) and 5(d). Note the halos and arrangement of the spots in their patterns. Studying a similar 3-component system, Schenk in [14] shows several examples that include a Zielscheiben-Struktur (target structure) closely resembling the target patterns in my figure 7. Spots with halos and similar spot-to-spot interactions are also shown in that work. In both of these 3-component systems, a single spot can have an intrinsic velocity and display particle-like collision behavior in addition to the static attraction and repulsion effects.
8 Discussion
The single spot in the upper-left of figure 4(a) has a set of concentric halos with progressively lower amplitude and alternating sign. In multi-spot patterns, each spot tends to be found at a location that coincides with the first positive-sign halos of neighboring spots. In the growth of hexagonal arrays, the new spots always appear at such locations.
In figure 4(a), the U-shaped moving pattern is of similar size and shape to the three-spot pattern, and both tend to return to the canonical dimensions shown here after distortion or perturbation.
In more distant alignments such as that in figure 6(a) the spots are found at distances coinciding with each other’s second positive-signed surrounding halos. This is also evident in the five-spot pattern in figure 5(a), which remains as shown when perturbed, rather than changing to a pentagonal ring or some other arrangement.
In several instances (for example figure 4(d), all of figure 6, and figure 7(d)) we see rows of spots and other roughly linear features, halos that parallel these features, and motion and interaction that follows the locations of these roughly linear halos.
All of the foregoing suggest that areas of high and low produce a pattern of surrounding standing waves, and that these standing waves combine in a nearly linear way to produce an effect of constructive and destructive interference, causing spots and other features to drift towards a preferred alignment. A similar explanation exists for spot interactions in the reaction-diffusion system of [12]. Analytical research is needed to establish a basis for this theory for the Gray-Scott model equations, or another explanation that can account for the observed phenomena. Inasmuch as similar effects are observed in the 1-dimensional system (see Mazin et. al [9] and my own work [29]), analytical work can probably begin with 1-dimensional systems.
There is much opportunity for further research by numerical simulation, including rigorous statistical analysis to establish the degree of stability of the patterns in response to varying types and levels of perturbation. The majority of the present results are at a single point in the parameter space; there is a likelihood that changing and will yield new discoveries.
The superficial similarity (spot shape and “halos” and target patterns) and behavior (spots condensing into a bound multi-spot state similar to “molecules”) in gas plasma experiments, combined with the successful modeling (e.g. by [15]) of these experiments by a reaction-diffusion system in numerical simulation, strongly suggest research to identify more connections between the present work and the gas discharge systems.
Concerning the moving stable structures, there are several well-studied reaction-diffusion system models, including the Brusselator model with diffusion, the three-component system of [15], and the Oregonator model of the B-Z reaction [18]; all sharing many or most of the features of the Gray-Scott system (stripes, spots, multiple homogeneous stable states, mixed-mode patterns, ability to produce Turing patterns, and varying types of movement and interaction at various parameter values). Because of these many shared traits, it seems likely that some of these other systems can also produce stable moving localized patterns and other complex phenomena like those described in the present paper. If such phenomena exist, they likely involve parameter values that have not been thoroughly explored, or may be confined to a very narrow region of the parameter space.
Finally, this author notes that the great diversity of patterns and types of interaction displayed by the Gray-Scott system at these specific parameter values, combined with the inherent stability of these patterns, clearly places this system in Wolfram’s class 4 (complex localized structures, sometimes long-lived) [3] that characterizes certain discrete cellular automata that have been shown to be capable of universal computation. Constructing large systems of interacting patterns presents several challenges for long-term stability, because most interactions cause each interacting part to shift. However, a starting pattern containing an infinite array of elements, each of which is only used a small number of times, would appear promising.
Acknowledgments
The author acknowledges Jeff McGough for early feedback; thanks also to Joseph Fineman for his copy-editing experience; and to Jonathan Lidbeck for his 3-D Gray-Scott Java applet [24].
References
- [1] A. M. Turing, The chemical basis of morphogenesis, Philosophical Transactions of the Royal Society of London, Series B (Biological Sciences), 237(641) (1952) 37-72.
- [2] P. Gray and S.K. Scott, Autocatalytic reactions in the isothermal, continuous stirred tank reactor: isolas and other forms of multistability, Chemical Engineering Science 38 (1983) 29-43.
- [3] S. Wolfram, Universality and complexity in cellular automata, Physica D: Nonlinear Phenomena 10 (1984) 1-35.
- [4] W. H. Press, S. A. Teukolsky, W. T. Vetterling, and B. P. Flannery, Numerical recipes in C, Cambridge University Press, New York, 1992, pp. 847-851.
- [5] J. Pearson, Complex patterns in a simple system, Science 261 (1993) 189-192.
- [6] K. J. Lee, W. D. McCormick, Q. Ouyang, and H. L. Swinney, Pattern formation by interacting chemical fronts, Science 261 (1993) 192-194.
- [7] P. Gray and S. K. Scott, Chemical oscillations and instabilities, Oxford University Press, Oxford, 1994, pp. 219-229.
- [8] K. J. Lee, W. D. McCormick, H. L. Swinney, and J. E. Pearson, Experimental observation of self-replicating spots in a reaction-diffusion system, Nature 369 (1994) 215-218.
- [9] W. Mazin, K. E. Rasmussen, E. Mosekilde, P. Borckmans, P, and G. Dewel, Pattern formation in the bistable Gray-Scott model, Mathematics and Computers in Simulation 40 (3-4) (1996) 371-396.
- [10] A. Doelman, T. J. Kaper, and P. A. Zegeling, Pattern formation in the 1-D Gray-Scott model, Nonlinearity 10 (1997) 523-563.
- [11] D. E. Knuth, The art of computer programming, 2 (Seminumerical Algorithms), Addison-Wesley, 1997, pp. 184-189.
- [12] C. P. Schenk, P. Schütz, M. Bode, H.-G. Purwins, Interaction of self-organized quasiparticles in a two-dimensional reaction-diffusion system: The formation of molecules, Physical Review E 57 (6) (1998) 6480-6486.
- [13] H.-G. Purwins, Yu. A. Astrov, and I. Brauer, Self-organized quasiparticles and other patterns in planar gas-discharge systems, in M. Ding, W. L. Ditto, L. M. Pecora, M. L. Spano (Eds.), Proceedings of the 5th Experimental Chaos Conference, World Scientific Publishing Company, 2000, pp. 3-14.
-
[14]
C. P. Schenk,
Numerische und analytische Untersuchung solitärer Strukturen in
zwei- und dreikomponentigen Reaktions-Diffusions-Systemen,
(inaugural dissertation),
Westfälischen Wilhelms University Münster, 1999.
http://www.uni-muenster.de/Physik.AP/Purwins/RD/Literatur/schenk_diss.pdf - [15] A. W. Liehr, M. Bode, and H.-G. Purwins, The generation of dissipative quasi-particles near Turing’s bifurcation in three-dimensional reaction-diffusion systems, in: E. Krause, W. Jäger, (Eds.), High performance computing in science and engineering 2000, Springer, 2001, pp. 425-439.
- [16] C. B. Muratov and V. V. Osipov, Spike autosolitons in the Gray-Scott model, Journal of Physics A: Mathematical and General 33 (2000) 8893-8916.
- [17] Y. Nishiura and D. Ueyama, Self-replication, self-destruction, and spatio-temporal chaos in the Gray-Scott model, Physical Review Letters 15 (2000) 281-289.
- [18] L. Yang, M. Dolnik, A. M. Zhabotinsky, and I. R. Epstein, Pattern formation arising from interactions between Turing and wave instabilities, Journal of Chemical Physics 117 (15) (2002) 7259-7265.
- [19] J. Wei and M. Winter, Existence and stability of multiple-spot solutions for the Gray-Scott model in , Physica D: Nonlinear Phenomena 176 (3-4) (2003) 147-180.
- [20] T. Kolokolnikov, Pattern formation in reaction-diffusion models far from the Turing regime, Doctoral thesis, University of British Columbia, August 2004.
- [21] T. Leppänen, Computational studies of pattern formation in Turing systems, Doctoral thesis, Helsinki University of Technology, November 2004.
- [22] J. S. McGough and K. Riley, Pattern formation in the Gray-Scott model, Nonlinear Analysis: Real World Applications 5(1) (2004) 105-121.
- [23] L. Yang, I. Berenstein, and I. R. Epstein, Segmented waves from a spatiotemporal transverse wave instability, Physical Review Letters 95 (3) (2005) 038303.
-
[24]
J. Lidbeck,
3-D Gray-Scott Reaction Diffusion (experimental – in progress)
website with embedded Java applet,
http://www.aliensaint.com/uo/java/rd/3d.php - [25] A. Munteanu and R. V. Solé, Pattern formation in noisy self-replicating spots International Journal of Bifurcation and Chaos 12(16) (2006) 3679-3685.
-
[26]
L. Stollenwerk,
Pattern Formation in AC Gas Discharge Systems,
at website of the Workgroup on Nonlinear Systems and Pattern Formation,
Institute of Applied Physics at WWU Münster.
http://www.uni-muenster.de/Physik.AP/Purwins/AC/index-en.html -
[27]
A large gallery of sample images and animations covering the entire
parameter space mapped in figure 2 can be found
at:
http://www.mrob.com/pub/comp/xmorphia -
[28]
Movies accompanying the figures in this paper are available at:
http://www.mrob.com/sci/papers/2009smp-figs -
[29]
R. Munafo,
Stable moving patterns in the 1-D and 2-D Gray-Scott Reaction-Diffusion
System, talk given at Rutgers University Mathematical Physics seminar series,
Fall 2010. Slides are here:
http://www.mrob.com/sci/talks/20101209.html