An emerging population of BL Lacs with extreme properties: towards a class of EBL and cosmic magnetic field probes?
Abstract
High energy observations of extreme BL Lac objects, such as 1ES 0229+200 or 1ES 0347–121, recently focused interest both for blazar and jet physics and for the implication on the extragalactic background light and intergalactic magnetic field estimate. However, the number of these extreme highly peaked BL Lac objects (EHBL) is still rather small. Aiming at increase their number, we selected a group of EHBL candidates starting from the BL Lac sample of Plotkin et al. (2011), considering those undetected (or only barely detected) by the Large Area Telescope onboard Fermi and characterized by a high X-ray vs. radio flux ratio. We assembled the multi-wavelength spectral energy distribution of the resulting 9 sources, profiting of publicly available archival observations performed by Swift, Galex, and Fermi satellites, confirming their nature. Through a simple one-zone synchrotron self-Compton model we estimate the expected VHE flux, finding that in the majority of cases it is within the reach of present generation of Cherenkov arrays or of the forthcoming Cherenkov Telescope Array (CTA).
keywords:
galaxies: active – galaxies: jets – radiation mechanisms: non–thermal – gamma-rays: galaxies.1 Introduction
Intense emission of rays is a distinctive feature of blazars, active galactic nuclei (AGN) dominated by the boosted non–thermal continuum from a relativistic jet pointed toward the observer. The 2LAC catalogue (Ackermann et al., 2011), listing the AGN detected with high significance by the Large Area Telescope onboard Fermi during its first two years of operations, contains 886 sources, of which 862 are blazars (395 sources classified as BL Lacs, 310 Flat Spectrum Radio Quasars (FSRQ), and 157 sources of “unknown type”). Blazars also dominate the extragalactic sky at very high energy (VHE, GeV) with BL Lac being the dominant population (58 over a total of 67 extragalactic sources discovered until November 2014 according to TeVCat111http://tevcat.uchicago.edu). Within BL Lacs, the large majority (51 out of 58) of the VHE emitters belongs to the High-peaked BL Lac (HBL) subclass.
The spectral energy distribution (SED) of blazars displays two characteristics broad humps, whose peak frequency appears to anticorrelate with the emitted power (Fossati et al. 1998, but see Giommi et al. 2005). While the low energy (from radio up to optical) emission is clearly associated to synchrotron radiation, the nature of the mechanisms responsible for the high-energy continuum is still debated. The majority of the studies adopts the so called leptonic scenario, in which the high energy radiation is interpreted as the product of the inverse Compton (IC) scattering of the relativistic electrons and soft photons (either produced internally, i.e. the synchrotron photon themselves, or externally to the emitting region). Hadronic models (Böttcher et al., 2013) instead assume that the –ray emission is either the byproduct of reactions initiated by ultrarelativistic hadrons and mediated by mesons (e.g. Mücke et al., 2003; Atoyan & Dermer, 2003) or direct synchrotron emission from protons (e.g. Aharonian, 2000).
For the great majority of known BL Lac objects the high-energy component peaks in the 1-100 GeV band. However, there is a small group of sources detected at TeV energies by Cherenkov arrays for which the maximum is located above 1 TeV (e.g. Tavecchio et al., 2011). The extreme hardness of the spectrum makes these sources very faint and thus often undetected in the Large Area Telescope (LAT) band. These features can be exploited to effectively constrain the intergalactic magnetic field (IGMF, e.g. Neronov & Vovk, 2010; Tavecchio et al., 2010, 2011; Dolag et al., 2009; Dermer et al., 2011; Vovk et al., 2012; Oikonomou et al., 2014). Other properties shared by these sources are the extremely large ratio between the X-ray and the radio flux and the hardness of the X-ray continuum (), locating the synchrotron peak in the medium-hard X-ray band. These characteristics lead to collect them under the term “extreme” HBL (EHBL, Costamante et al., 2001). In the IR-optical regime the emission is dominated by the host galaxy and the non-thermal jet continuum starts to be important only in the UV band. The modeling of their SED within the Synchrotron Self-Compton (SSC) framework reveals rather unusually low magnetic fields ( G) and large electron energies (Tavecchio et al., 2010, 2011). The emitted hard TeV spectrum (once corrected for interaction with the extragalactic background light, EBL) can be reproduced assuming that the electron energy distribution is truncated below a minimum Lorentz factor around (Katarzyński et al., 2005; Tavecchio et al., 2009, 2011; Kaufmann et al., 2011). This interpretation also accounts for the peculiar UV/X-ray spectrum. Alternatively, the SED could be the result of a Maxwellian electron distribution (Lefa et al., 2011), internal absorption (Aharonian et al., 2008; Zacharopoulou et al., 2011) or inverse Compton scattering between electrons and photons of the cosmic microwave background in the large-scale (kpc) jet (Böttcher et al., 2008). Alternatively lepto-hadronic models can be also invoked, either through proton-synchrotron emission, or through secondary cascades inside the emission region initiated by ultra-relativistic hadrons (see e.g. Cerruti et al., 2015). A last suggestive possibility is that high-energy photons are produced by ultra-high energy protons along the line of sight injected by the blazars into the intergalactic space (Essey et al., 2011; Murase et al., 2012a; Zheng & Kang, 2013; Tavecchio, 2014).
From the brief description given above is clear that EHBL are rather interesting objects, both for the study of jets phenomenology or even Ultra High Energy Cosmic Ray (UHECR) astrophysics and for the use of probes of EBL and IGMF. However, their use is somewhat hampered by the small number of EHBL detected at TeV energies. This is the main fact driving the present work, in which we intend to characterize a group of EHBL detectable at TeV energies by present instruments or by the upcoming Cherenkov Telescope Array (CTA, Acharya et al., 2013). Sparse groups of EHBL have been identified in previous work (e.g. Giommi et al., 2005; Nieppola et al., 2006). Here we intend to follow a focused and well defined selection procedure, based on the compilation of the SDSS/FIRST BL Lac of Plotkin et al. (2011), and the criterion of an extreme radio-to-X-ray flux ratio (§2). We show their SED using recent Swift data (§3). We also profit from archival Galaxy Evolution Explorer (GALEX) satellite data and we analyze the whole Fermi/LAT photon archive in order to constrain their behavior in gamma rays by computing at least upper limits if no detection is possible, which comes out to be the most common result, in agreement with our expectations. Based on a simple synchrotron self-Compton homogeneous model we reproduce the resulting SED (§4), giving also an estimate of their flux and detectability for Imaging Atmospheric Cherenkov Telescopes (IACT) of the present and forthcoming generation.
Throughout the paper, we assume the following cosmological parameters: km s-1 Mpc-1, , . We use the notation in cgs units.
2 Selection of TeV candidates EHBL
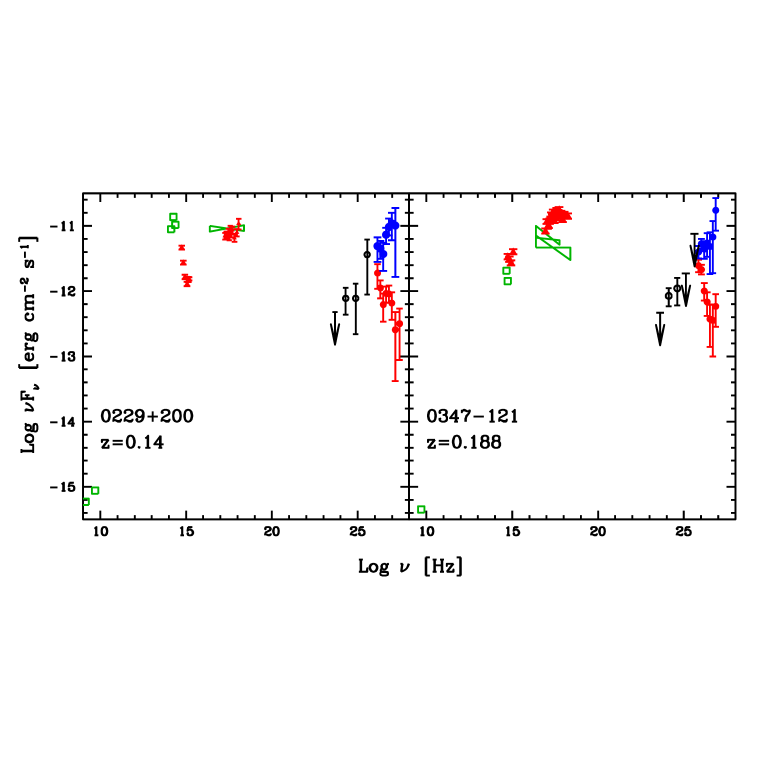
The SED of two representative EHBL detected in the TeV band, 1ES 0229+200 and 1ES 0347-121, are reported in Fig. 1222Note that due to a bug in the calculation of the effective area, the X-ray spectrum reported in Tavecchio et al. (2009) was too high. In Fig. 1 the correct spectrum is shown.. To select EHBL candidates we are guided by two evident peculiarities of these SED, namely the large X-ray/radio flux ratio and a non-thermal optical continuum lower than the thermal contribution from the galaxy. These two features suggest to select EHBL among the BL Lacs with high X-ray/radio flux ratio whose optical spectrum is dominated by the galaxy.
We emphasize that this criterion should not be confused with the one adopted in Costamante & Ghisellini (2002) who aimed to maximize the TeV flux (with a selection based on the evidence of large X-ray and radio fluxes), while here we tend, in a wide sense, to minimize the TeV spectral index. The criterion is rather model independent, as it arises by similarity with the archetypal EHBL 1ES 0229+200 and 1ES 0347-121 mentioned above. In the scope of a pure one-zone SSC model (e.g., Tavecchio et al., 1998), this can be interpreted as the outcome of an electron distribution characterized by high minimum () and break () Lorentz factors; this translates into large values of the peak frequencies for the synchrotron () and Inverse Compton () components of the radiation spectrum, and dim (due to scarcity of seed photons) but hard TeV spectra. Costamante & Ghisellini (2002) instead requested both high energy electrons and seed photons to be abundant in the emission region, in order to maximize the bolometric VHE luminosity. This interpretation suggests that the regions of the FFr parameter space plotted in Fig. 2 selected by the two criteria should actually host BL Lac populations of different flavour, with the TeV-brightest clustered towards the upper-right corner while the TeV-hardest clustered at the upper-left corner. While the Costamante & Ghisellini (2002) selection has been robustly proved by the detection at TeV energies of most of their candidate sources, the one we adopt here will need extensive observation of the selected sources in order to be proven or rejected.
Guided by this criterion, we started our selection from the list of 71 BL Lac presented by Plotkin et al. (2011) resulting from the correlation of SDSS and FIRST surveys and by optical spectrum dominated by the host galaxy emission; to enforce this, we limit the study within . To apply our criteria we further select those with measured X-ray flux (by ROSAT), from Plotkin et al. (2010), obtaining a total of 50 BL Lacs. Note that the cut in redshift, originally dictated by the requirement of the galaxy dominance in the optical band, also ensures that the relatively small suppression of the EBL for rays up to a few TeV does not prevent detection by current Cherenkov arrays.
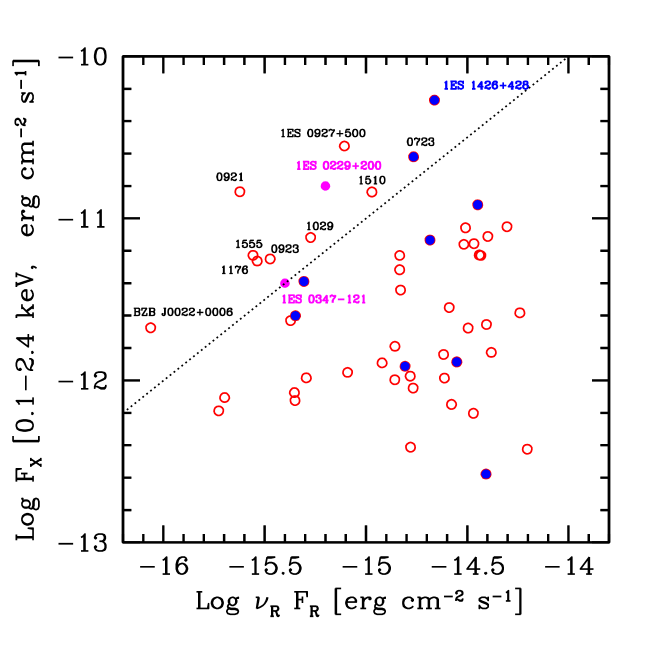
The X-ray flux in the 0.1-2.4 keV band and the radio flux at 1.4 GHz (expressed as Fν for homogeneity with the integrated X-ray flux), of the sources resulting from the selection have been taken from Plotkin et al. (2010) and are reported in Fig.2. There, the blue points show the sources already detected by LAT (2FGL catalogue). For comparison, the magenta points report the fluxes of 1ES 0229+200 and 1ES 0347-121 (although not belonging to our selected sources). The oblique dashed line corresponds to a fixed ratio . This particular, rounded but somewhat arbitrary value is suggested by the position of the two known EHBL in the plane. The sources above the line are expected to be good EHBL candidates, without any claim for completeness, as we are not aiming at it at this level. For instance, just outside of the region and next to 1ES 0347-121 lies RBS 1049, which would easily fit in the same scheme. In this region there are two sources already detected by LAT, RBS 0723 and 1ES 1426+428. The latter is already a well established TeV source (Horan et al., 2002). Although its SED is coherent with our picture, it can be considered a transition object towards the “bright X-ray”–”bright radio” corner of the plot, populated by the bright blazars of Costamante & Ghisellini (2002) therefore will be omitted in the following discussion. It’s worth noticing that 1ES1426+428 is not a standalone case, as another hard source not belonging to our sample but to the one of Giommi et al. (2005) that is built along a similar line has been discovered at VHE by HESS (SHBL J001355.9-185406 at , H.E.S.S. Collaboration et al., 2013). More recently RBS 0723 has been discovered at VHE too, by MAGIC (Mirzoyan, 2014). Other extreme BL Lacs such as those contemplated in Cerruti et al. (2015) also show X-ray to radio flux ratios high enough to fit in the scheme.
3 Multi–wavelength data
For the sources fulfilling our criterion on the FFR ratio we built multiwavelength SED exploiting publicly available data. We used archival optical–UV data from Swift/UVOT and soft X–ray data from Swift/XRT for the vast majority of the sources, while for RBS 0921 and RBS 1176 we requested dedicated Swift observations. We also profited from the GALEX archive333http://galex.stsci.edu/galexview/. Other data have been also added using the ASI Science Data Center (ASDC) archive444http://tools.asdc.asi.it/. All the considered sources have been observed at least one time with Swift, ensuring a good description of the crucial UV-X-ray band. No particular attempt was made to seek for strictly simultaneous observations, that would need a dedicated observational campaign, being these sources generally reputed of secondary importance and therefore left aside from any monitoring campaign of some time density.
We also analyzed Fermi/LAT data. Almost all the sources are undetected and we could only calculate upper limits.
| Source Name | R.A.(J2000) | (J2000) | l | b | Redshift | AB |
|---|---|---|---|---|---|---|
| BZB J0022+0006 | 5.5040 | 0.1161 | 107.18 | -61.85 | 0.306 | 0.108 |
| RBS 0723 | 131.8039 | 11.5640 | 215.46 | 30.89 | 0.198 | 0.093 |
| 1ES 0927+500 | 142.6566 | 49.8404 | 168.19 | 45.71 | 0.187 | 0.073 |
| RBS 0921 | 164.0275 | 2.8704 | 249.28 | 53.28 | 0.236 | 0.178 |
| RBS 0923 | 164.3462 | 23.0552 | 215.96 | 63.91 | 0.378 | 0.088 |
| RBS 1029 | 176.3963 | -3.6671 | 273.11 | 55.34 | 0.168 | 0.130 |
| RBS 1176 | 193.2540 | 38.4405 | 121.36 | 78.68 | 0.371 | 0.083 |
| RBS 1510 | 233.2969 | 18.9081 | 29.21 | 52.05 | 0.307 | 0.210 |
| RBS 1555 | 241.3293 | 54.3500 | 84.35 | 45.60 | 0.212 | 0.041 |
In the following we describe the analysis performed on the Swift/XRT Swift/UVOT and Fermi/LAT data.
3.1 Swift/XRT data
Swift/XRT (Burrows et al., 2005) observations were available for all the sources in our subsample, except for RBS 0923 and RBS 1176, which were targets of dedicated observations: RBS 0923 was observed in July 2012, while RBS 1176 was observed in November 2011, then in May and June 2012 . For most of the other sources only one observation was available, except for RBS 1029 which was observed in November and December 2007, 1ES0927+500, observed in September 2010 and March 2011, and RBS 1510 in June, September, October 2011 and in January 2012.
Swift/XRT data were analyzed by using the HEASoft v. 6.13 software package with the CALDB updated on 21 January 2013 and processed with xrtpipeline v. 0.12.6 with standard parameters. Spectra have been grouped to have at least 20 counts per bin, in order to use the test and analyzed with xspec v. 12.8.0 in the 0.3–10 keV energy band.
For all sources (with perhaps the exception of RBS 1176, see below) an absorbed power law model provides a good description of the spectrum. In the majority of cases the absorption column can be fixed to the Galactic value (Kalberla et al., 2005).
In Tab. 2 we report the results of the fitting procedure. In the two cases of 1ES 0927+500 and RBS 1029 we separately consider two spectra. The best fit parameters are perfectly consistent. All the other multiple datasets could be merged as no hint of variability was found.
| Source Name | Obs. ID | Exp. Time | NH | F | ||
|---|---|---|---|---|---|---|
| [s] | [ cm-2] | [10-12 erg cm-2 s] | ||||
| BZB J0022+0006 | 38113001 | 4700 | 2.76 (Gal.) | 7.19/8 | ||
| RBS 0723 | 37396001 | 2000 | 3.17 (Gal.) | 20.8/18 | ||
| 1ES 0927+500 1 | 39154001 | 2870 | 1.38 (Gal.) | 40.13/37 | ||
| 2+3 | 39154002-3 | 2260 | 1.38 (Gal.) | 29.4/33 | ||
| RBS 0921 | 37547001 | 4700 | 3.82 (Gal.) | 44.8/46 | ||
| RBS 0923 | 48001001-4 | 6400 | 1.12 (Gal.) | 25.8/26 | ||
| RBS 1029 1 | 36813001 | 2900 | 2.22 (Gal.) | 8.1/6 | ||
| 2 | 36813002 | 2900 | 2.22 (Gal.) | 9.35/10 | ||
| RBS 1176 | 48000001-3 | 5250 | 14.1/13 | |||
| RBS 1510 | 91101001-5 | 3700 | 3.83 (Gal.) | 35.0/33 | ||
| RBS 1555 | 38303001 | 7100 | 0.886 (Gal.) | 23.4/29 |
More complex is the case of RBS 1176. A fit of the summed spectrum with a power law model returns an absorption column largely in excess to the Galactic value (Table 2). Alternatively, a good fit () can be obtained assuming a broken power law model and the Galactic value of , with slopes , and break energy keV. The spectra of the single pointings are much less constraining. A single power law model (with photon index ) with Galactic absorption is barely compatible with the data but a curved spectrum is clearly suggested by the shape of the residuals.
3.2 Swift/UVOT data
Swift/UVOT (Roming et al., 2005) is a 30 cm diffraction–limited optical–UV telescope, equipped with six different filters, sensitive in the 1700–6500 Å wavelength range, in a 17’ 17’ FoV. We retrieved from the HEASARC database the UVOT images in which our target sources were observed. The maximum angular distance from the optical axis does not exceed 4’ for any source.
For all the sources and the available different observations the analysis was performed with the uvotimsum and uvotsource tasks with a source region of . while the background was extracted from a source–free circular region with radius equal to . The extracted magnitudes were corrected for Galactic extinction using the values of Schlegel et al. (1998) (reported in the last column of Tab. 1 and applying the formulae by Pei (1992) for the UV filters, and eventually were converted into fluxes following Poole et al. (2008).
Tab. 3 reports the observed Vega magnitudes in the Swift/UVOT , , , , , and filters, together with statistical uncertainties. Systematic uncertainties are never greater than 0.03 mag and therefore dominated by statistical ones in the vast majority of cases.
| Source Name | Obs. ID | ||||||
|---|---|---|---|---|---|---|---|
| BZB J0022+0006 | 38113001 | - | - | - | |||
| RBS 0723 | 37396001 | ||||||
| 1ES 0927+500 | 39154001-3 | - | - | - | - | ||
| RBS 0921 | 37547001 | ||||||
| RBS 0923 | 48001001-4 | ||||||
| RBS 1029 | 36813001-2 | - | - | - | - | ||
| RBS 1176 | 48000001-3 | ||||||
| RBS 1510 | 91101001-5 | - | - | - | |||
| RBS 1555 | 38303001 | - | - | - |
3.3 Fermi/LAT data
Publicly available Fermi/LAT data were retrieved from the Fermi Science Support Center (FSSC) and analyzed by means of the LAT Science Tools v. 9.27.1, together with the Instrument Response Function (IRF) Pass 7 and the corresponding isotropic and Galactic diffuse background models. Source (class 2) photons in the 0.1–100 GeV energy range, collected until 21 August 2012 and coming from direction within 10 degrees from the nominal position of the source were selected and filtered through standard FSSC quality cuts. Standard analysis steps were then performed, eventually adopting the test statistic from Mattox et al. (1996) to assess the significance of excess signal in correspondance with our targets. Besides the target (modeled as a simple power law) and backgrounds, all the 2FGL point sources in the field were included in the model.
Most of the sources were undetected on the whole 0.1–100 GeV energy band. For RBS 1510 (TS=23.0) and 1ES0927+500 (TS=24.5) we had marginal detections while we could confirm RBS 0723, already present in both the 1FGL and 2FGL catalogs. Then we computed fluxes in the 1-10 GeV and 10-100 GeV bands, relaxing the limit for a detection to TS9 for the sources that were detected in the full band; however, none of the others reached this threshold in either energy bin. In absence of a measured flux we computed upper limits, following Rolke et al. (2005). Results are collected in Tab. 4 and plotted in Figs. 3-5. In the last two columns we also report the number of photons with energy E 10 GeV detected within a 0.4∘ radius (roughly corresponding to 68% containment for E 10 GeV) from the nominal position of the source, and the energy of the most energetic one Emax. A rigorous study of the significance of these photons, taking into account the different PSF of LAT for front and back converted photons, aiming to check and exclude contamination from nearby hard sources (though unlikely) and eventually to assess the probability of enclosing background photons within the same aperture, was beyond the scope of this work.
| Source Name | F0.1-100GeV | TS | F1-10GeV | F10-100GeV | Hard photons | Emax | |
|---|---|---|---|---|---|---|---|
| [10-10 ph cm-2 s | [10-10 ph cm-2 s-1] | [10-10 ph cm-2 s | [] | [GeV] | |||
| BZB J0022+0006 | - | - | 1.88 | 1 | 31.5 | ||
| RBS 0723 | 11.3 | 1.46 | 79 | 3.91.0 | 0.690.25 | 10 | 77.6 |
| 1ES 0927+500 | 4.23.4 | 1.380.3 | 24.5 | 0.620.26 | 9 | 159.1 | |
| RBS 0921 | - | - | 4 | 2 | 23.4 | ||
| RBS 0923 | - | - | 3 | 1 | 53.7 | ||
| RBS 1029 | - | - | 0.002 | 0 | - | ||
| RBS 1176 | - | - | -0.04 | 1 | 13.7 | ||
| RBS 1510 | 5.83.6 | 1.480.21 | 23.0 | 2.00.8 | 0.360.20 | 5 | 42.9 |
| RBS 1555 | - | - | 0.44 | 2 | 10.9 |
3.4 GALEX data
The Galaxy Evolution Explorer (Martin et al., 2005) was a NASA Small Explorer, in flight since 28 April 2003, and operational until mid 2013.
It performed an all–sky survey in the far UV (FUV, nm) and near UV (NUV, nm) band. We retrieved from the MAST555Multimission Archive at the Space Telescope Science Institute, http://galex.stsci.edu archival fluxes observed for the sources of our sample (see Tab. 5). No data is found for RBS 1176, likely due to a gap in the sky coverage of the survey.
| Source Name | FUV Flux | NUV Flux |
|---|---|---|
| [Jy] | [Jy] | |
| BZB J0022+0006 | 17.00.2 | 23.400.25 |
| RBS 0723 | 104.34.9 | 177.24.3 |
| 1ES 0927+500 | 59.35.6 | 68.84.1 |
| RBS 0921 | 15.11.5 | 25.41.1 |
| RBS 0923 | 12.63.7 | 22.83.5 |
| RBS 1029 | 17.54.3 | 32.94.9 |
| RBS 1176 | - | - |
| RBS 1510 | 24.96.2 | 48.15.3 |
| RBS 1555 | 9.620.51 | 11.30.2 |
4 Spectral Energy Distributions
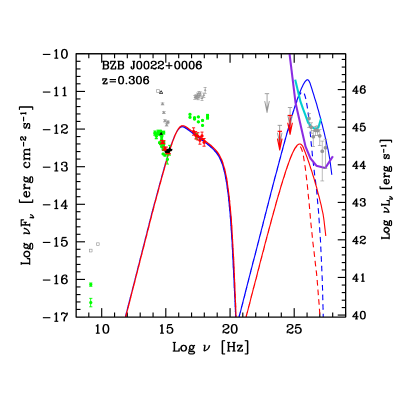
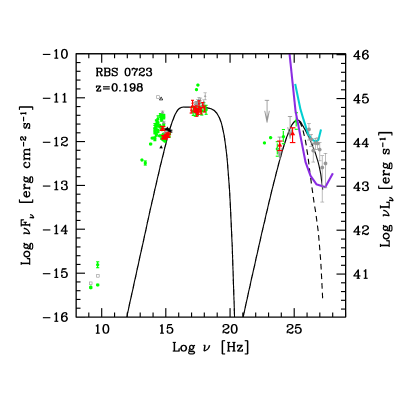
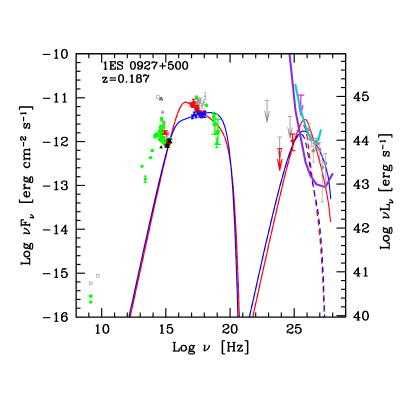
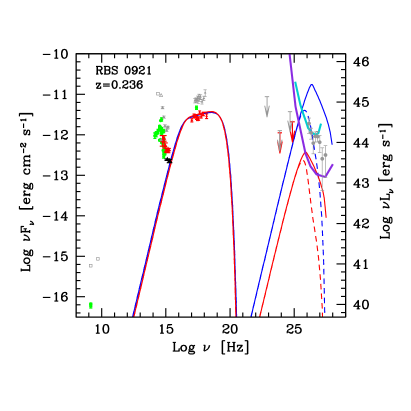
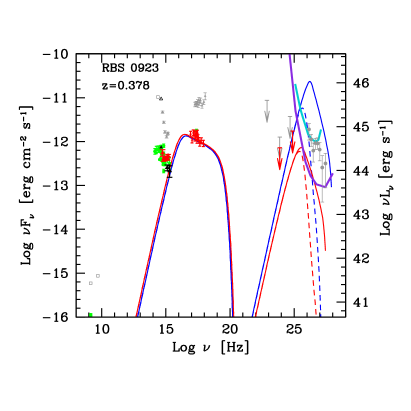
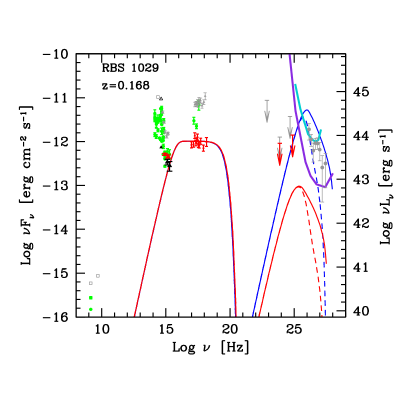
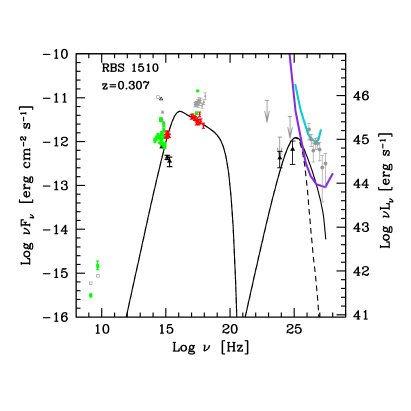
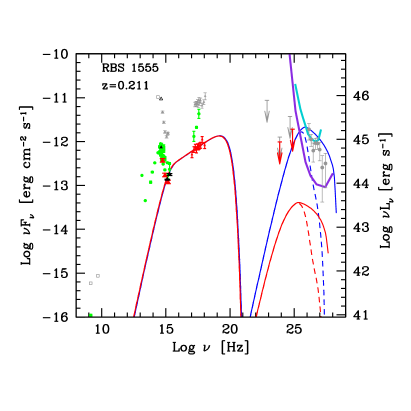
The SED of the sources are reported in Figs. 3-5. In all cases we use the same color code: green symbols are used for archival data from ASDC, red points for Swift/XRT, UVOT and LAT data and black triangles for GALEX data (taken from the database). Note that in almost all cases the GALEX and UVOT data in the UV filters perfectly agree, in spite of the uncorrelated observing epochs. The only exception is RBS 1510 for which GALEX provides fainter fluxes than UVOT. In this case variability is likely an explanation for this difference.
For comparison, we report in background (gray) the data corresponding to 1ES 0229+200 (for simplicity only the observed TeV spectrum is shown). It is clear that the structure of the synchrotron part of the SED of all the sources closely resembles that of 1ES 0229+200. In all cases the steep optical continuum is dominated by the host galaxy emission. A feature shared by all the sources is the large ratio between the flux in the UV band and soft X-ray band. As remarked in Tavecchio et al. (2009) (see also Kaufmann et al., 2011), in the framework of the one-zone leptonic model, this features can be reproduced if the energy distribution of the emitting electrons is truncated below a relatively large value, . As for 1ES 0229+200, this also causes a very hard SSC component, consistent with the extremely low flux in the LAT band.
As discussed in §3.1, for RBS 1176 the observed deficit of soft X-ray photons in the XRT spectrum can be interpreted either as due to intrinsic or intervening absorption or as the evidence for an intrinsic curvature of the spectrum. In the latter case, the extremely hard soft X-ray continuum (photon index close to 1) would be readily interpreted in the SSC scheme as the synchrotron low-energy tail of the electrons with Lorentz factor . In this case, RBS 1176 would thus be a source characterized by a peculiarly large , for which the break in the synchrotron continuum – which in the other sources occurs between the UV and the X-ray bands – is located around 1 keV. Therefore RBS 1176 could be the first example of ultra extreme HBL.
Our selection criterion is rather efficient in selecting EHBL blazars, as shown by the similarity of the synchrotron SEDs of the selected sources, even if the paucity of the -ray data does not allow (yet) a detailed comparison of the high energy SEDs. We remark that the selection procedure does not explicitly require that the synchrotron peak is in the X-ray band (which is the defining feature of EHBL). Nevertheless, almost all the selected BL Lacs show hard X-ray spectra, often showing photon indices below 2, locating the synchrotron peak energy above 10 keV; it is worth noticing that with indices around 2 the position of the synchrotron peak can shift a lot (from to Hz ), even if the synchrotron luminosity is almost constant. As shown below, the exact location of the synchrotron peak does not affect much the predicted TeV flux, since this depends mostly on the low energy edge of the electron distribution (see the case of 1ES 0927+500 below).
The high energy component is unconstrained in almost all the sources, with the exception of RBS 0723, RBS 1510 and 1ES 0927+500, detected by LAT at the highest energies. Based on the striking similarity of the synchrotron bump, it is reasonable to assume that the high energy component is also similar to that of 1ES 0229+200, characterized by an extremely hard spectrum in the LAT ( according to Vovk et al. 2012, but see Cerruti et al. 2015 where a softer slope is found) and TeV bands. This assumption is supported by the detection of 1ES 0927+500 and RBS 1510 only at high energy and by the hard photon index of RBS 0723 reported in the 2FGL, . In the next paragraph we then estimate the expected TeV flux assuming as SED template and physical parameters those of 1ES 0229+200.

4.1 SED Modeling and predicted TeV fluxes
We use the one-zone leptonic model of Tavecchio et al. (1998), fully described in Maraschi & Tavecchio (2003). The emitting region is assumed to be spherical with radius , filled by a tangled magnetic field of intensity . To reduce the number of free parameters we assume that the relativistic electrons follow a simple power law distribution with . As for the case of 1ES 0229+200 (Tavecchio et al., 2009; Kaufmann et al., 2011) this distribution suitably describes the observed SED. The relativistic beaming of the synchrotron and SSC radiation is described by the relativistic Doppler factor . These parameters fully specify the model, that can be uniquely fixed once the quantities specifying the two bumps (peak frequencies and luminosities, spectral slopes) and the variability timescale are known (Tavecchio et al., 1998).
In the present case, since in the majority of cases we do not have any direct measurement of the high energy hump, it is not possible to uniquely derive the physical parameters of the emitting sources. Moreover the minimum variability timescale for these sources is not known, thus allowing additional degeneracy in the plane. On the other hand, relying on the physical parameters inferred for known EHBL (e.g. Tavecchio et al., 2011), it is possible to derive the SSC component and thus an estimate of the expected TeV flux. According to the results of the models in Tavecchio et al. (2010, 2011) we then fix the radius cm and the Doppler factor . Then we consider two values of the magnetic field bracketing the expected range of the magnetic field intensity, G and for each value we derive the remaining parameters (, , and ) reproducing the synchrotron component (described by the X-ray spectrum and the UV data) and the upper limits in the GeV band. The only parameter loosely constrained in this procedure is , which, however, has only a minor impact on the derived SSC component due to Klein-Nishina suppression. For 1ES 0927+500, RBS 0723 and RBS 1510, the LAT data allow us to constrain also the level of the SSC component and to determine all the parameters. Therefore in this case we present only one model. For RBS 1176, as discussed above, we consider both possibilities for the X-ray spectrum. For the case assuming additional absorption we report two models, as for the other sources. For the case in which the X-ray continuum as an intrinsic curvature we show one model (black lines), assuming G. We do not consider the case of a larger magnetic field for which the SSC luminosity (already low) would be much smaller.
As discussed in Katarzyński et al. (2005) and Tavecchio et al. (2009), the peculiar SED of EHBL can be reproduced in the framework of the standard one-zone leptonic model assuming that the emitting relativistic electrons follow an energy distribution truncated below a relatively large energy or, equivalently, Lorentz factor . In this case, below the typical synchrotron frequency of electrons with Lorentz factor , , the resulting spectrum is described by the characteristics hard power law . The same hard spectrum describes the SSC emission up to the peak energy . Since the UV and X-ray data constrain around Hz, the typical minimum Lorentz factor is , implying a SSC peak at TeV. Note that in this scheme the sources with very large separation between the X-ray and the UV fluxes, implying a large value of , are expected to have the maximum of the SSC component at very high energy and are thus the most promising sources for TeV detection. Larger values of have been sometimes required in the past to model the SED of HBL, (e.g. Aleksić et al., 2012), and would boost even more the detectability of our sources.
4.2 Results
The resulting theoretical SED are shown by the red ( G) and blue ( G) lines in Figs. 3-5. Solid lines report the intrinsic emission, dashed lines show the observed emission, corrected for absorption through interaction with the EBL using the model of Domínguez et al. (2011). We note here that the radio emission can not be explained by our model, providing fluxes well below the measured level. This is a general feature of single-region models, which are especially intended to model the emission at higher frequencies emitted by compact components. The low frequency radio emission is instead likely produced in extended regions in the jet.
The cases with low are characterized by a larger SSC flux and viceversa. This is simply due to the well known fact that the ratio between the SSC and synchrotron luminosities is proportional to the radiation and magnetic energy densities, i.e. . For a fixed also is constant, thus .
Figs. 3-5 also display the sensitivity curves for MAGIC (light blue, Sitarek et al., 2013) and CTA (violet, Actis et al., 2011) corresponding to 50 hours of observation and significance. It’s noteworthy that these sensitivity curves assume a 0.2 dex energy binning, therefore dimmer flux densities are still within reach if a more coarse binning is adopted. In the low magnetic field case, the majority of the sources could be already detected by the present generation of IACTs and all the sources could be easily detected by CTA (Acharya et al., 2013). In the high B-field case, instead, the selected EHBL could be hard to detect even by CTA. However, we remark that the prediction of the SSC flux for the case of high magnetic field, G, should be considered rather pessimistic, since the magnetic field intensity derived for most of the known EHBL tends to lie close to the low value (e.g. Tavecchio et al., 2011).
For RBS 1176, the case of an intrinsic X-ray break results in a large peak frequency (which we recall is directly related to , that in this case is larger than for the other sources) and a quite low SSC luminosity (related to the small energy density of the target optical-IR photons). Therefore, if the observed lack of soft photons is really connected to the intrinsic spectrum RBS 1176 (making this source the first ultra-extreme HBL) we do not expect that it can easily detected by the CTA.
| Source Name | |||||
|---|---|---|---|---|---|
| [G] | |||||
| BZB J0022+0006 | 0.1 | 3.5 | |||
| 0.01 | 3.5 | ||||
| RBS 0723 | 0.15 | 3.0 | |||
| 1ES 0927+5001 1 | 0.05 | 3.3 | |||
| 2+3 | 0.035 | 2.7 | |||
| RBS 0921 | 0.1 | 2.8 | |||
| 0.01 | 2.8 | ||||
| RBS 0923 | 0.1 | 3.3 | |||
| 0.01 | 3.3 | ||||
| RBS 1029 | 0.1 | 3.0 | |||
| 0.01 | 3.0 | ||||
| RBS 1176 | 0.1 | 2.8 | |||
| 0.01 | 2.8 | ||||
| 0.01 | 3.1 | ||||
| RBS 15103 | 0.12 | 3.35 | |||
| RBS 1555 | 0.1 | 2.6 | |||
| 0.01 | 2.6 |
5 Discussion
Extreme HBLs are particular interesting for several reasons, ranging from the study of jet physics to the estimate of EBL and IGMF. In this work we have assembled a well defined group of EHBL and we have characterized their SED using historical, Swift, Fermi/LAT and (when available) GALEX data. All the SEDs closely resemble in shape that of the “prototypical” EHBL 1ES 0229+200, demonstrating the efficiency of our selection in identify these kind of sources. We applied a simple one-zone synchrotron SSC model, trying to predict the flux at very high energies, showing that most of the sources could be detectable by the upcoming CTA. Given the shape of the SED, the most effective instruments of the CTA to detect EHBL would be the array of Medium Sized Telescopes (MST), dominating the overall sensitivity from several hundreds of GeV up to few TeV. In case of detection a deep follow up with the Large Sized Telescopes (LST) sensitive down to few tens of GeV could measure the reprocessed flux and hence the IGMF under the hypothesis that the intrinsic emission does not interfere below 100 GeV. Possible different variability at high (dominated by the intrinsic) and low energies could help to separate the two components.
One of the most interesting features of EHBL is their exceptionally hard GeV-TeV spectrum, which in most of cases puts the maximum of the SSC component above few TeV. Here, following Katarzyński et al. (2005) and Tavecchio et al. (2009) we interpret the hard TeV spectrum, together with the extreme X-ray/UV flux ratio, as the result of the emission from an electron population with a large minimum Lorentz factor, . As discussed in Tavecchio et al. (2009) the exceptionally large seem to challenge existing models for particle acceleration, which usually predicts power-law non-thermal tails starting from much lower values (e.g. Sironi & Spitkovsky, 2011).
Another intriguing point is the apparent stability of the TeV spectrum over several years (Aharonian et al. 2007, but see also Aliu et al. 2014 for the case of 1ES 0229+200 where marginal evidence for mild TeV variability on a several months/annual time scale is found), which neatly distinguishes EHBL from HBL that show rather variable TeV emission, down to timescales of few minutes. As discussed in Tavecchio et al. (2009) for 1ES 0229+200 the radiative cooling time of electrons at is of the order of 2 years, barely consistent with the observations. However, it is difficult to avoid other sources of losses, such as adiabatic losses. One interesting possibility to understand such a stable spectrum (e.g. Murase et al., 2012a; Essey et al., 2011; Taylor et al., 2011) is that the GeV-TeV continuum is not the primary emission from the source, but instead is reprocessed radiation from cascading processes spread into the intergalactic space. Electromagnetic cascades could be the result of the absorption of primary multi-TeV gamma rays or, instead, could be produced by Bethe-Heitler pair creation or photo-meson reactions involving ultra-high energy protons accelerated in the source and beamed toward the Earth. As shown in Tavecchio (2014), the physical parameters of the jets are consistent with the requests of the hadronic cascade scenario, both in terms of maximum hadron energy and jet power. As discussed by Murase et al. (2012a) and Takami et al. (2013) an effective test to distinguish between intrinsic and reprocessed emission is the observation of photons at several TeV, only possible in the latter case, since the cascade emission, being produced at lower distance, is less affected by absorption than the intrinsic one; although exotic processes such as the photon-axion conversion (e.g. de Angelis et al., 2011) could result in a lower effective absorption. Due to absorption and reprocessing of primary TeV photons a significant contribution to the GeV extragalactig gamma-ray background (EGB) could be related to E-HBL (see e.g. Inoue & Ioka, 2012; Murase et al., 2012b; Ajello et al., 2014). We plan to study this issue in a forthcoming paper.
Another topic worth of discussion is the position of these EHBLs within the general BL Lac population and the nature of their parent population. By construction, the sources we are discussing have very faint radio emission (radio luminosities around erg s-1) indicating very weak radio jets (e.g. Giroletti et al., 2004, for some sources). Considering that at least a fraction of the radio flux comes from the beamed jet synchrotron component, we argue that the intrinsic radio luminosity drops below the lower end of the FRI radiogalaxy power range, making EHBLs suitable candidates for the aligned counterparts of the weak radiogalaxies population studied by Baldi & Capetti (2009).
Finally we wish to speculate on the existence of even more extreme EHBL. In fact it is tempting to suppose the existence of blazars which SED is shifted toward even higher energies, with the X-ray emission peak above 10 keV and high-energy component reaching several tens of TeV. Given the very high energy of the synchrotron and IC peaks and low flux levels these sources could escape detection by Swift and Fermi. We speculate that possibly the CTA survey will allow to detect or constrain this hypotetical subclass of the HBL population in the TeV band. Of course such sources would deeply suffer from EBL absorption around their IC emission peak, limiting their detectability at low redshifts and the detection of the left side of the IC bump below few TeV. Arguably, a relatively strong fraction of their radiated power would be reprocessed into the GeV band, setting limits to their spatial density. We will further investigate this issue in a future work.
A generalization of our criterion, for instance relaxing the condition of the known redshift, will allow to validate this EHBL selection method on new and larger samples. This class of sources is especially important for improving our understanding about the far-IR EBL, IGMF and EGB. Exploiting at the same time the capability of NuStar (Harrison et al., 2013) SKA (Carilli & Rawlings, 2004) and CTA (Acharya et al., 2013) will be particularly revealing. Even before the completion of CTA, the planned ASTRI/CTA mini–array (Di Pierro et al., 2013; Vercellone et al., 2013) could be exploited in this direction. Actually, whereas the brightest flux from this sources is expected to be in the band up to 1 TeV, where MSTs will be the most sensitive instruments of CTA, still crucial physical information is engraved in the high energy tail of the IC bump, in the band best observed with the Small Sized Telescopes.
For instance, these extreme sources could allow eventually to compare leptonic and hadronic emission scenarios in a multi-TeV territory where degeneracy of competing models is significantly reduced (see e.g. Murase et al., 2012a). Opportunity would arise for tests of non standard physics such as violations of the Lorentz invariance (Fairbairn et al., 2014) or the speculated existence of axion–like particles (Meyer & Conrad, 2014), once the number of these multi-TeV photon factories should become greater than now. Therefore EHBL will be very interesting targets for challenging hot topics in fundamental physics, both with the ASTRI/CTA Mini–Array (improving the current H.E.S.S. sensitivity above 5 TeV) and with the full array of CTA small telescopes, which dominates the overall CTA sensitivity above the same threshold.
Acknowledgements
FT and GB acknowledge financial contribution from grant PRIN-INAF-2011. This work is based on the publicly available Fermi/LAT data obtained through the Science Support Center (SSC). This research has made use of data obtained from the High Energy Astrophysics Science Archive Research Center (HEASARC), provided by NASA’s Goddard Space Flight Center. We acknowledge the use of public data from the Swift data archive. We also acknowledge use of GALEX data is made publically available through the Multi–Mission archive at the Space Telescope Science Institute (MAST). Part of this work is based on archival data, software or on-line services provided by the ASI Science Data Center (ASDC). We thank the referee Andreas Zech for comments that helped in improving the paper. We also acknowledge constructive comments from M. Cerutti, K. Murase, Y. Tanaka and D. Sanchez.
References
- H.E.S.S. Collaboration et al. (2013) H.E.S.S. Collaboration, Abramowski, A., Acero, F., et al. 2013, A&A, 554, AA72
- Acharya et al. (2013) Acharya, B. S., Actis, M., Aghajani, T., et al. 2013, Astroparticle Physics, 43, 3
- Ackermann et al. (2011) Ackermann, M., Ajello, M., Allafort, A., et al. 2011, ApJ, 743, 171
- Actis et al. (2011) Actis, M., Agnetta, G., Aharonian, F., et al. 2011, Experimental Astronomy, 32, 193
- Aharonian (2000) Aharonian, F. A. 2000, New Astronomy, 5, 377
- Aharonian et al. (2007) Aharonian, F., Akhperjanian, A. G., Barres de Almeida, U., et al. 2007, A&A, 475, L9
- Aharonian et al. (2008) Aharonian, F. A., Khangulyan, D., & Costamante, L. 2008, MNRAS, 387, 1206
- Ajello et al. (2014) Ajello, M., Romani, R. W., Gasparrini, D., et al. 2014, ApJ, 780, 73
- Aleksić et al. (2012) Aleksić, J., Alvarez, E. A., Antonelli, L. A., et al. 2012, A&A, 542, AA100
- Aliu et al. (2014) Aliu, E., Archambault, S., Arlen, T., et al. 2014, ApJ, 782, 13
- Atoyan & Dermer (2003) Atoyan, A. M., & Dermer, C. D. 2003, ApJ, 586, 79
- Baldi & Capetti (2009) Baldi, R. D., & Capetti, A. 2009, A&A, 508, 603
- Böttcher et al. (2008) Böttcher, M., Dermer, C. D., & Finke, J. D. 2008, ApJL, 679, L9
- Böttcher et al. (2013) Böttcher M., Reimer A., Sweeney K., Prakash A., 2013, ApJ, 768, 54
- Burrows et al. (2005) Burrows, D. N., Hill, J. E., Nousek, J. A., et al. 2005, Space Sci.Rev., 120, 165
- Carilli & Rawlings (2004) Carilli, C. L., & Rawlings, S. 2004, New Astronomy Reviews, 48, 979
- Cerruti et al. (2015) Cerruti, M., Zech, A., Boisson, C., & Inoue, S. 2015, MNRAS, 448, 910
- Costamante et al. (2001) Costamante, L., Ghisellini, G., Giommi, P., et al. 2001, A&A, 371, 512
- Costamante & Ghisellini (2002) Costamante, L., & Ghisellini, G. 2002, A&A, 384, 56
- de Angelis et al. (2011) de Angelis, A., Galanti, G., & Roncadelli, M. 2011, Phys. Rev. D, 84, 105030
- Dermer et al. (2011) Dermer, C. D., Cavadini, M., Razzaque, S., et al. 2011, ApJL, 733, L21
- Di Pierro et al. (2013) Di Pierro, F., Bigongiari, C., Morello, C., et al. 2013, arXiv:1307.3992
- Dolag et al. (2009) Dolag, K., Kachelrieß, M., Ostapchenko, S., & Tomàs, R. 2009, ApJ, 703, 1078
- Domínguez et al. (2011) Domínguez, A., Primack, J. R., Rosario, D. J., et al. 2011, MNRAS, 410, 2556
- Essey et al. (2011) Essey, W., Kalashev, O., Kusenko, A., & Beacom, J. F. 2011, ApJ, 731, 51
- Fairbairn et al. (2014) Fairbairn, M., Nilsson, A., Ellis, J., Hinton, J., & White, R. 2014, JCAP, 6, 005
- Fossati et al. (1998) Fossati, G., Maraschi, L., Celotti, A., Comastri, A., & Ghisellini, G. 1998, MNRAS, 299, 433
- Giommi et al. (2005) Giommi, P., Piranomonte, S., Perri, M., & Padovani, P. 2005, A&A, 434, 385
- Giroletti et al. (2004) Giroletti, M., Giovannini, G., Taylor, G. B., & Falomo, R. 2004, ApJ, 613, 752
- Harrison et al. (2013) Harrison, F. A., Craig, W. W., Christensen, F. E., et al. 2013, ApJ, 770, 103
- Horan et al. (2002) Horan, D., Badran, H. M., Bond, I. H., et al. 2002, ApJ, 571, 753
- Inoue & Ioka (2012) Inoue, Y., & Ioka, K. 2012, Phys. Rev. D,
- Kalberla et al. (2005) Kalberla, P. M. W., Burton, W. B., Hartmann, D., et al. 2005, A&A, 440, 775
- Katarzyński et al. (2005) Katarzyński, K., Ghisellini, G., Tavecchio, F., et al. 2005, A&A, 433, 479
- Kaufmann et al. (2011) Kaufmann, S., Wagner, S. J., Tibolla, O., & Hauser, M. 2011, A&A, 534, A130
- Lefa et al. (2011) Lefa, E., Rieger, F. M., & Aharonian, F. 2011, ApJ, 740, 64
- Livio & Silk (2014) Livio, M., & Silk, J. 2014, Nature, 507, 2
- Maraschi & Tavecchio (2003) Maraschi, L., & Tavecchio, F. 2003, ApJ, 593, 667
- Martin et al. (2005) Martin, D. C., Fanson, J., Schiminovich, D., et al. 2005, ApJL, 619, L1
- Mattox et al. (1996) Mattox, J. R., Bertsch, D. L., Chiang, J., et al. 1996, ApJ, 461, 396
- Meyer & Conrad (2014) Meyer, M., & Conrad, J. 2014, arXiv:1410.1556
- Mirzoyan (2014) Mirzoyan, R. 2014, The Astronomer’s Telegram, 5768, 1
- Mücke et al. (2003) Mücke, A., Protheroe, R. J., Engel, R., Rachen, J. P., & Stanev, T. 2003, Astroparticle Physics, 18, 593
- Murase et al. (2012a) Murase, K., Dermer, C. D., Takami, H., & Migliori, G. 2012a, ApJ, 749, 63
- Murase et al. (2012b) Murase, K., Beacom, J. F., & Takami, H. 2012b, JCAP, 8, 030
- Neronov & Vovk (2010) Neronov, A., & Vovk, I. 2010, Science, 328, 73
- Nieppola et al. (2006) Nieppola, E., Tornikoski, M., & Valtaoja, E. 2006, A&A, 445, 441
- Oikonomou et al. (2014) Oikonomou, F., Murase, K., & Kotera, K. 2014, A&A, 568, AA110
- Pei (1992) Pei, Y. C. 1992, ApJ, 395, 130
- Plotkin et al. (2010) Plotkin, R. M., Anderson, S. F., Brandt, W. N., et al. 2010, Astronom. Journal, 139, 390
- Plotkin et al. (2011) Plotkin R. M., Markoff S., Trager S. C., Anderson S. F., 2011, MNRAS, 413, 805
- Poole et al. (2008) Poole, T. S., et al. 2008, MNRAS, 383, 627
- Rolke et al. (2005) Rolke, W. A., López, A. M., & Conrad, J. 2005, Nuclear Instruments and Methods in Physics Research A, 551, 493
- Roming et al. (2005) Roming, P. W. A., et al. 2005, Space Sci.Rev., 120, 95
- Schlegel et al. (1998) Schlegel, D. J., Finkbeiner, D. P., & Davis, M. 1998, ApJ, 500, 525
- Sironi & Spitkovsky (2011) Sironi, L., & Spitkovsky, A. 2011, ApJ, 726, 75
- Sitarek et al. (2013) Sitarek, J., Carmona, E., Colin, P., et al. 2013, arXiv:1308.0141
- Takami et al. (2013) Takami, H., Murase, K., & Dermer, C. D. 2013, ApJL, 771, L32
- Tanaka et al. (2014) Tanaka, Y. T., Stawarz, Ł., Finke, J., et al. 2014, ApJ, 787, 155
- Tavecchio et al. (1998) Tavecchio, F., Maraschi, L., & Ghisellini, G. 1998, ApJ, 509, 608
- Tavecchio et al. (2009) Tavecchio, F., Ghisellini, G., Ghirlanda, G., Costamante, L., & Franceschini, A. 2009, MNRAS, 399, L59
- Tavecchio et al. (2010) Tavecchio, F., Ghisellini, G., Foschini, L., et al. 2010, MNRAS, 406, L70
- Tavecchio et al. (2011) Tavecchio, F., Ghisellini, G., Bonnoli, G., & Foschini, L. 2011, MNRAS, 414, 3566
- Tavecchio (2014) Tavecchio, F. 2014, MNRAS, 438, 3255
- Taylor et al. (2011) Taylor, A. M., Vovk, I., & Neronov, A. 2011, A&A, 529, A144
- Vercellone et al. (2013) Vercellone, S., Agnetta, G., Antonelli, L. A., et al. 2013, arXiv:1307.5671
- Voges et al. (1999) Voges, W., Aschenbach, B., Boller, T., et al. 1999, A&A, 349, 389
- Vovk et al. (2012) Vovk, I., Taylor, A. M., Semikoz, D., & Neronov, A. 2012, ApJL, 747, L14
- Wakely & Horan (2008) Wakely, S. P., & Horan, D. 2008, International Cosmic Ray Conference, 3, 1341
- Zacharopoulou et al. (2011) Zacharopoulou, O., Khangulyan, D., Aharonian, F. A., & Costamante, L. 2011, ApJ, 738, 157
- Zheng & Kang (2013) Zheng, Y. G., & Kang, T. 2013, ApJ, 764, 113