How to bend galaxy disc profiles: the role of halo spin
Abstract
The radial density profiles of stellar galaxy discs can be well approximated as an exponential. Compared to this canonical form, however, the profiles in the majority of disc galaxies show downward or upward breaks at large radii. Currently, there is no coherent explanation in a galaxy formation context of the radial profile per se, along with the two types of profile breaks. Using a set of controlled hydrodynamic simulations of disc galaxy formation, we find a correlation between the host halo’s initial angular momentum and the resulting radial profile of the stellar disc: galaxies that live in haloes with a low spin parameter show an up-bending break in their disc density profiles, while galaxies in haloes of higher angular momentum show a down-bending break. We find that the case of pure exponential profiles () coincides with the peak of the spin parameter distribution from cosmological simulations. Our simulations not only imply an explanation of the observed behaviours, but also suggest that the physical origin of this effect is related to the amount of radial redistribution of stellar mass, which is anti-correlated with .
keywords:
hydrodynamics – methods: numerical – galaxies: spiral – galaxies: structure.1 Introduction
In his landmark work, Freeman (1970) found that most spiral galaxies share a uniform stellar surface brightness profile which is well fitted by an exponential, . Subsequent deeper imaging of a wider variety of disc galaxies has shown some variation in the functional form of the radial profile. For example Pohlen et al. (2002) observed galaxies that exhibit two distinct exponential profiles. In addition to an inner profile just as observed by Freeman (1970), they found a steeper outer exponential profile such that the overall profile appeared to have a “break”. In barred S0-Sb galaxies Erwin et al. (2005) found profiles with an outer exponential slope which is shallower than the inner part. Pohlen & Trujillo (2006) compiled a sample of galaxies that included all three types of profiles. They called them pure, down-bending and up-bending exponentials. They found that only of their sample of late-type galaxies have pure exponential profiles that extend all the way out to the observational surface brightness limit. The measured abundances of down- and up-bending profiles are and , respectively.
Using numerical simulations, Debattista et al. (2006) explain down-bending disc breaks with stellar angular momentum redistribution induced by the formation of a bar. A study by Roškar et al. (2008) that also employed numerical simulations predicted ‘U-shaped’ stellar age profiles for down-bending disc breaks and that the positions of the minima of the age profiles coincide with the break radius. This prediction was confirmed by observations (Yoachim et al., 2010).
There are many analytical models in the literature that study the physical origin of the exponential radial profile of stellar galaxy discs (e. g. Fall & Efstathiou, 1980; Lin & Pringle, 1987; Dalcanton et al., 1997; Mo et al., 1998; van den Bosch, 2001). A common assumption of all these models is that the distribution of specific angular momentum of baryons is conserved during the evolution of galaxies. Dutton (2009) found that low angular momentum material needs to be removed in order to prevent centres of galaxies from becoming too dense. He suggested that stellar feedback is a viable mechanism to redistribute angular momentum. Cosmological simulations of galaxy formation confirm this mechanism and find that this ejected low angular momentum gas can be reaccreted with high angular momentum via the galactic fountain effect (e. g. Brook et al., 2011, 2012; Marinacci et al., 2011; Übler et al., 2014). However, currently there is no coherent explanation for the existence of pure, down- and up-bending radial profiles.
In this Letter we present the first attempt at identifying physical quantities that determine the profile of stellar discs at large radii. We use a suite of smoothed particle hydrodynamic (SPH) simulations of disc galaxies in an isolated set-up. We show that the type of disc profiles depends on the initial angular momentum of the galactic baryons. In Section 2, we describe the simulation set-up followed by a presentation of the results in Section 3 and our conclusions in Section 4.
2 Simulations
In this Letter we present the results of a suite of simulations of disc galaxy formation from idealized and isolated, yet cosmologically motivated, initial conditions. We use a modified version of the publicly available treeSPH code ChaNGa (Jetley et al., 2008, 2010; Menon et al., 2014) 111http://librarian.phys.washington.edu/astro/index.php/Research:ChaNGa. The simulations are evolved for 8 Gyr. This corresponds to , when the last major merger era was coming to an end (Zentner & Bullock, 2003). Examinations of cosmological simulations show that they behave similarly to isolated spheres after their last major merger (Zentner & Bullock, 2003, Obreja et al., in preparation). In section 2.1 we present a detailed description of our cosmologically motivated initial set-up while we will only briefly outline the implementation of hydrodynamics in section 2.2.
Our initial set-up is motivated and indeed very similar to that in Roškar et al. (2008). We deliberately chose a simplified and controlled set-up in order to be able to link observed properties to their physical origin more easily. This level of control comes at the expense of neglecting asymmetric influences from the cosmological context, such as merging of galaxies. However, stellar feedback helps to break the symmetry in the initial conditions.
2.1 Initial conditions
We set up isolated haloes with the following properties: . and are the virial mass and radius. is the fraction of baryons in the initial set-up and is the halo concentration. is lower than the cosmological baryon fraction because our set-up does not account for high redshift outflows that are ejected from the halo. Dark matter (DM) particle masses are and initial gas particle masses are . The gravitational softening is . The SPH smoothing length is variable and set such that the kernel covers 50 particles.
The initial conditions were set up in four steps. First we created an equilibrium NFW DM halo (Navarro et al., 1997) following the recipe from Kazantzidis et al. (2004) including an exponential cutoff outside . In the next step the mass of each DM particle was reduced by a factor of , the baryon fraction, and a gas particle was added at the same position, accounting for the mass difference between the old and the new DM particle.
This gas sphere is then rotated by some random angle in order to prevent gas and DM particles from sharing identical positions.
To set the gas velocities, we establish a cylindrical coordinate system such that the gas orbits about the z-axis. The velocities are set to obey the angular momentum profile for DM haloes as found by Bullock et al. (2001) in cosmological body simulations222These calculations were done assuming that the DM and the gas share the same angular momentum profile.:
| (1) |
where is the mass of all material that has less angular momentum than , is the shape parameter and is the maximum specific angular momentum in the halo. depends on the value of and is proportional to the spin parameter . While simply scales the gas particles’ angular momentum, sets the actual mass distribution of . We use the definition of the spin parameter from Bullock et al. (2001):
| (2) |
Here and are the halo angular momentum and mass inside a sphere of radius and is the halo circular velocity at that radius. Radial and vertical velocities were set to . Tangential velocities are a function of the axisymmetric radius only (). However, the DM halo does not rotate in our simulations. Finally, the gas temperatures were calculated such that the gas obeys hydrostatic equilibrium.
Here we explore the effects of varying at a fixed on the radial profile of the resulting stellar disc. We explore the range 333We did not explore lower values of because the computational effort increases significantly as decreases due to denser gaseous discs and an increased amount of star formation.. The simulation parameters are summarized in Table 1.
| ( ) | ( ) | |
|---|---|---|
| 0.02 | 0.34 | 3.14 |
| 0.03 | 0.56 | 2.91 |
| 0.035 | 0.67 | 2.64 |
| 0.04 | 0.95 | 2.53 |
| 0.045 | 1.13 | 2.42 |
| 0.05 | 1.24 | 2.36 |
| 0.055 | 1.31 | 2.30 |
| 0.06 | 1.34 | 2.25 |
| 0.1 | 1.44 | 1.96 |
2.2 Baryonic physics
The ChaNGa code is derived from the treeSPH code gasoline. It uses a modified version of SPH which employs a pressure averaged force calculation (Ritchie & Thomas, 2001; Hopkins, 2013; Keller et al., 2014). ChaNGa includes stochastic star formation (Stinson et al., 2006, ) based on a Kennicut-Schmidt law, radiative metal line cooling, metal diffusion and pre supernova stellar wind feedback (early stellar feedback; Stinson et al., 2013). The feedback follows Dalla Vecchia & Schaye (2012) in which the energy output from supernova explosions of a stellar population is released at one time altogether. The energy released per supernova is . Further details on the implemented physics in ChaNGa will be presented in upcoming papers (Keller et al., 2014, Stinson et al., in preparation). First tests of this implementation produced realistic disc galaxies in cosmological simulations.
3 Results
3.1 Disc profiles
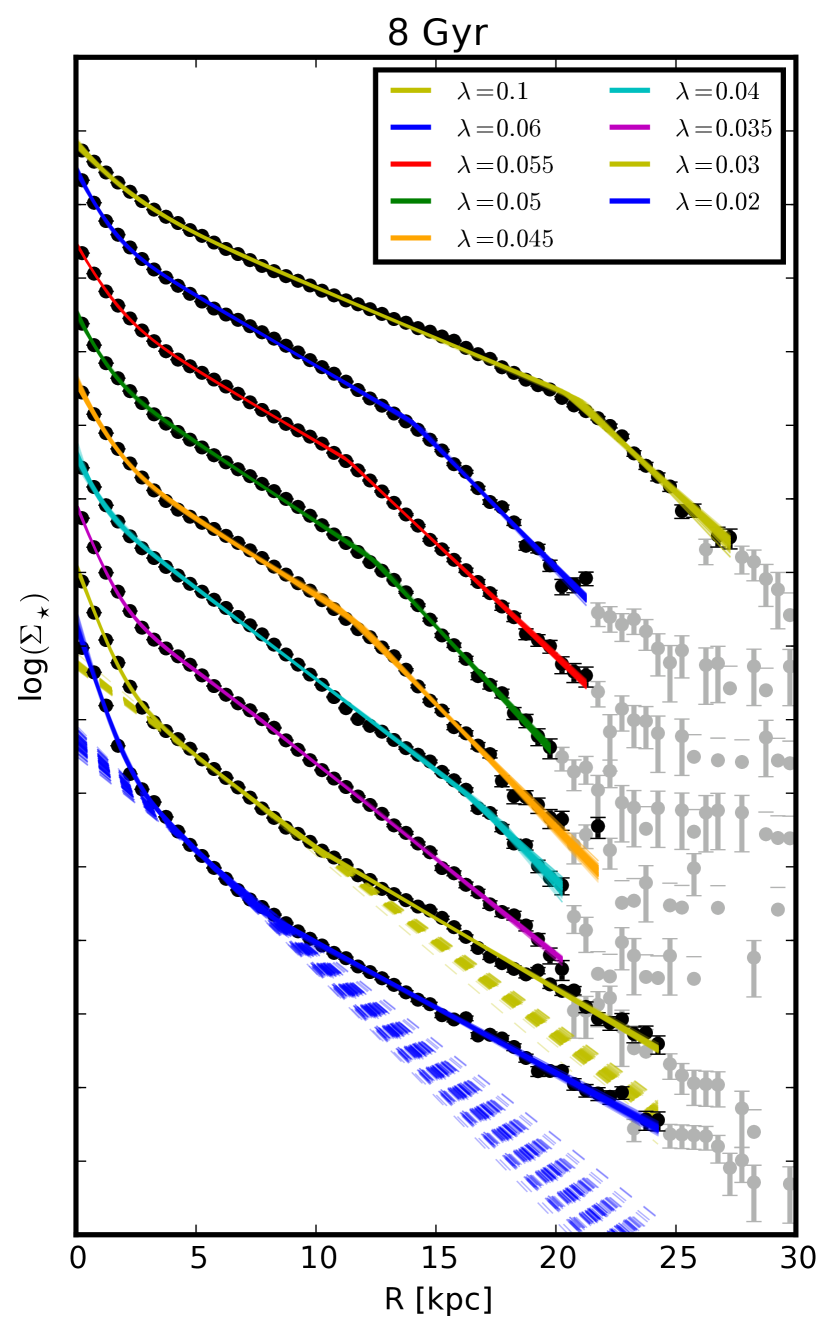
After evolving the simulations for 8 Gyr, we extracted the stellar surface density in axisymmetric radial bins . These stellar surface density profiles include all stars up to 3 kpc above and below the plane and inside a cylinder with a radius of 30 kpc. We fit these profiles with a superposition of a ‘broken exponential disc’ surrounding an exponential bulge which is a very good parametrization of the data (see Fig. 1):
| (3) |
where
| (4) |
Here and are normalization factors for the bulge and disc component, respectively. and represent the inner and outer disc scale-length and the radius of the break. The probability distribution function (PDF) of the fit parameters for the given surface density profiles was obtained using the Monte Carlo Markov chain (MCMC) algorithm emcee (Foreman-Mackey et al., 2013)444We did not use a standard minimization procedure because it gave unstable results.. Fig. 1 shows the stellar surface density profiles (black points) for all simulations at 8 Gyr overplotted by 100 models sampled from the obtained PDF (coloured lines). The grey data points show data for radial bins with nine or fewer star particles. These points were omitted in the fitting procedure.
3.2 Disc breaks
Fig. 1 shows that the type of the disc profiles changes with . In the lowest spin simulations () the profile is up-bending, i. e. . The models with high spin parameters () clearly show a down-bending break. Fig. 2 quantifies these trends in terms of the fit parameters. The middle panel shows the fitted inner to outer scale-lengths as a function of . The inner scale-length increases linearly with . The outer scale-length has a high value for low and decreases with until it approaches a constant lower value for . The bottom panel of Fig. 2 shows the ratios of the inner to outer scale-lengths as a function of . There is a transition from up-bending () to down-bending () disc breaks at .
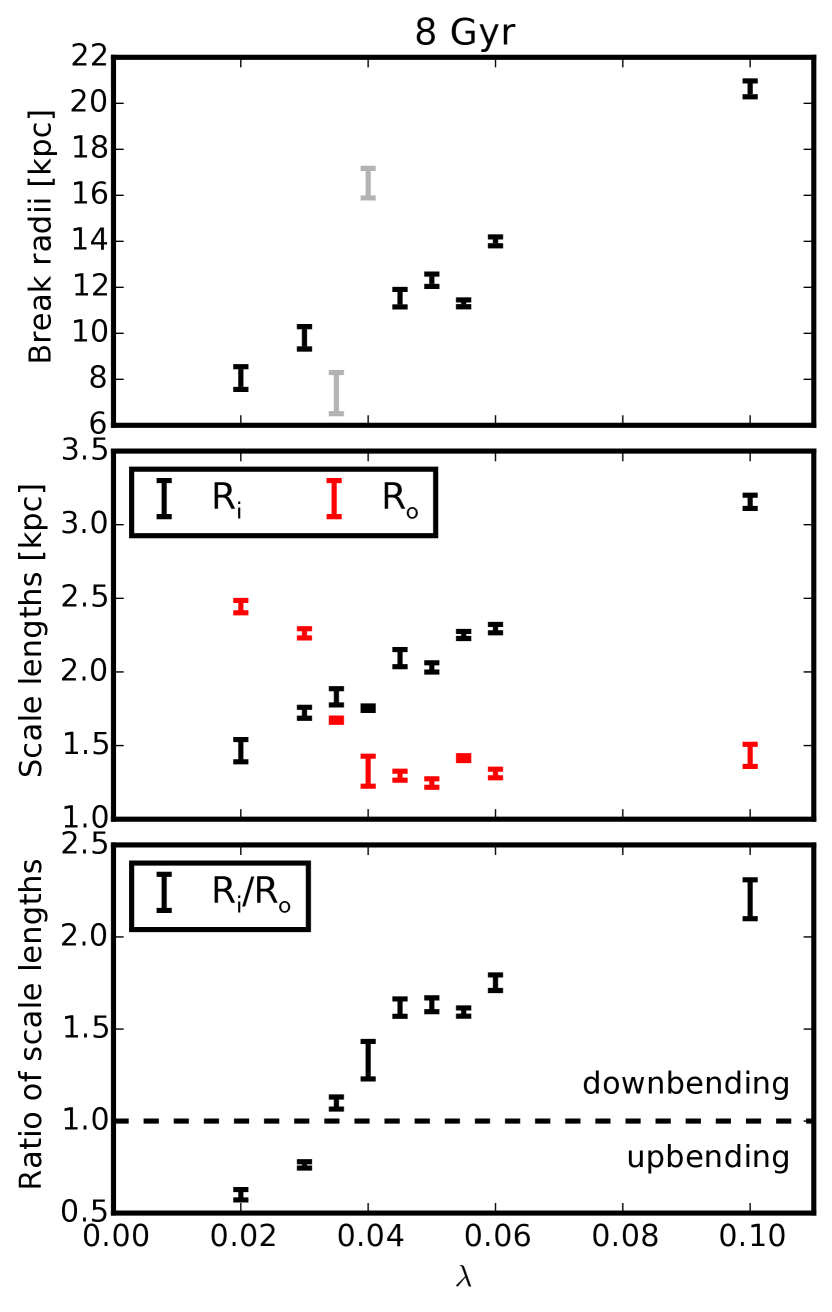
The top panel in Fig. 2 shows the estimated break radii as a function of . Except for the cases, shows a linear dependence on .
3.3 The pure exponential case
In the region between the up- and down-bending regime (), the disc profiles are purely exponential over a range that exceeds the typical position of disc breaks (8-10 kpc) for other spin parameters. In such cases, the definition of and the distinction between and are ill-defined. In the case, the best fit for is at the end of the disc. Therefore, the fitted break radius exceeds the otherwise linear relation with as can be seen in the middle panel of Fig. 2. In the case, the best fit for is at a minor wiggle in the profile. The result is that does not fit the relation with either but this time it falls short. This is not surprising given that the model parameters are degenerate for pure exponential profiles where and the distinction between and have no physical meaning. This phenomenon is reflected by the larger error bars.
3.4 Radial mass redistribution
In this section we briefly lay out a possible mechanism that may be the cause for systematic changes of the disc profile with . Fig. 3 compares the final stellar surface density profile to the density profile of stars at birth, irrespective of their actual time of birth. Hereafter, we will refer to these as the final and formation profiles respectively.
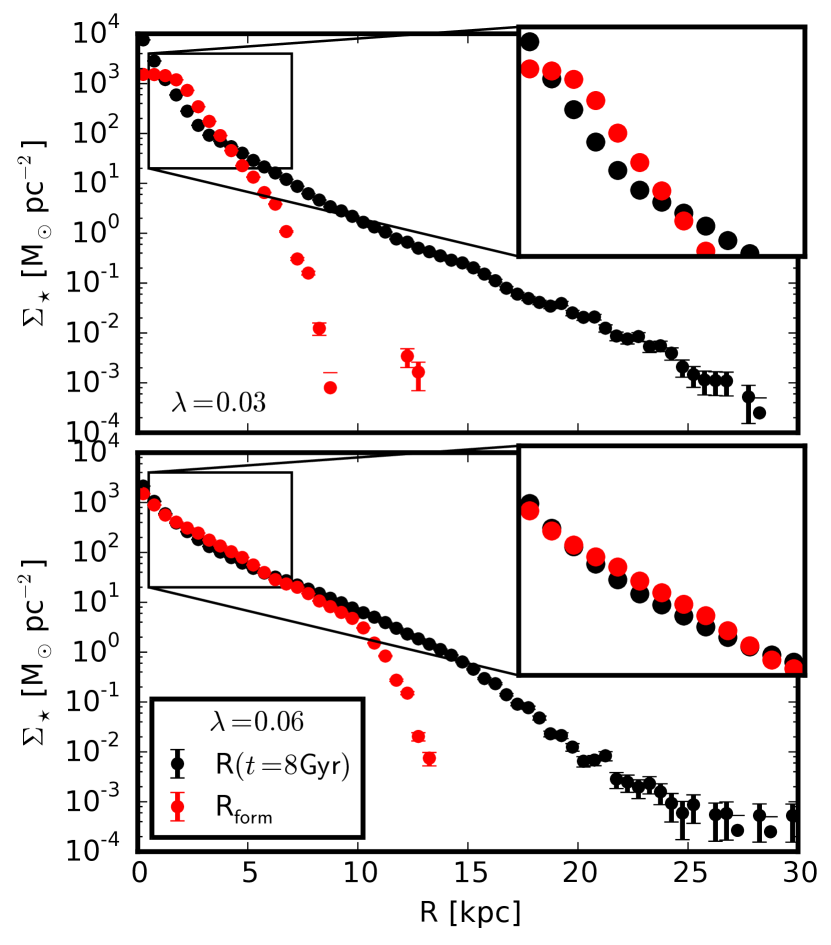
The two panels in Fig. 3 show profiles for two different simulations, one with a spin parameter below the transition region between up- and down-bending discs (, top panel) and one above (, bottom panel). In the case we see that stars are formed with a very concentrated profile that has a core in the centre. This core might be artificial due to centring issues. What is evident without doubt is that practically all stars formed in the inner kpc of the disc, while the final profile extends all the way out to kpc.
The figure shows that in the range the formation profile significantly exceeds the final profile. Inside and outside that range the opposite is the case. This is because the integrated masses of the current and formation profiles are identical. It follows that a substantial amount of stellar redistribution has occurred from outwards as well as inwards.
For , we observe the same qualitative effect but there are two striking differences with important implications. First, star formation extends to much larger radii ( kpc). Secondly, despite the same qualitative trend the differences between the formation and final profiles are much smaller. The final profile closely follows the formation profile out to kpc and there is no central core in the formation profile. At large radii there is a steeply declining tail of stars that have reached large radii, leading to the down-bending profile. Therefore the amount of stellar redistribution that took place in this ‘high-spin’ case is much less than that in the ‘low-spin’ case. For clarity, we only presented these two cases. The intermediate cases show a monotonic trend between those shown in Fig. 3.
4 Conclusions
Using numerical models of disc galaxy formation, we found a correlation between the initial spin of the host halo and the shape of the radial profile of the stellar disc.
We find that galaxies with an initial spin parameter form an up-bending disc profile while larger values of yield down-bending discs. Pure exponential discs occur only right at which coincides approximately with the median of the distribution in cosmological simulations (; Macciò et al., 2008). Thus, our model explains why only some late-type galaxies exhibit pure exponential disc profiles, while the majority of them show breaks in the outer disc profiles. As the transition between up- and down-bending disc profiles () in our model coincides with the median of the distribution, we expect roughly equal abundances of up- and down-bending profiles which are comparable but not equal to observational results (30 % and 60 %; Pohlen & Trujillo, 2006). A possible cause for this discrepancy between our model and observations is that gas in cosmological simulations generally has larger angular momentum than the DM (Stewart et al., 2013).
Nevertheless the model qualitatively reproduces all types of observed disc profiles. In a follow-up paper we will further explore this effect in cosmological zoom simulations.
Acknowledgements
The authors thank Frank van den Bosch for his very helpful comments on setting up the simulations. The analysis was performed using the pynbody package (Pontzen et al., 2013). The simulations were performed on the THEO cluster of the Max-Planck-Institut für Astronomie and the Hydra supercomputer of the Max-Planck-Gesellschaft at the Rechenzentrum in Garching. The authors greatly appreciate the contributions of these computing allocations. JH, GSS and HWR acknowledge funding from the European Research Council under the European Union’s Seventh Framework Programme (FP 7) ERC Advanced Grant Agreement no. [321035]. GSS, AAD and AVM acknowledge support through the Sonderforschungsbereich SFB 881 ‘The Milky Way System’ (subproject A1) of the German Research Foundation (DFG). MM acknowledges support from the Alexander von Humboldt Foundation.
References
- Brook et al. (2011) Brook C. B., Governato F., Roškar R., Stinson G., Brooks A. M., Wadsley J., Quinn T., Gibson B. K., Snaith O., Pilkington K., House E., Pontzen A., 2011, MNRAS, 415, 1051
- Brook et al. (2012) Brook C. B., Stinson G., Gibson B. K., Roškar R., Wadsley J., Quinn T., 2012, MNRAS, 419, 771
- Bullock et al. (2001) Bullock J. S., Dekel A., Kolatt T. S., Kravtsov A. V., Klypin A. A., Porciani C., Primack J. R., 2001, ApJ, 555, 240
- Dalcanton et al. (1997) Dalcanton J. J., Spergel D. N., Summers F. J., 1997, ApJ, 482, 659
- Dalla Vecchia & Schaye (2012) Dalla Vecchia C., Schaye J., 2012, MNRAS, 426, 140
- Debattista et al. (2006) Debattista V. P., Mayer L., Carollo C. M., Moore B., Wadsley J., Quinn T., 2006, ApJ, 645, 209
- Dutton (2009) Dutton A. A., 2009, MNRAS, 396, 121
- Erwin et al. (2005) Erwin P., Beckman J. E., Pohlen M., 2005, ApJ, 626, L81
- Fall & Efstathiou (1980) Fall S. M., Efstathiou G., 1980, MNRAS, 193, 189
- Foreman-Mackey et al. (2013) Foreman-Mackey D., Hogg D. W., Lang D., Goodman J., 2013, PASP, 125, 306
- Freeman (1970) Freeman K. C., 1970, ApJ, 160, 811
- Hopkins (2013) Hopkins P. F., 2013, MNRAS, 428, 2840
- Jetley et al. (2010) Jetley P. Wesolowski L., Gioachin F., Mendes C., Kale L. V., Quinn T. R., 2010, In Proceedings of the 2010 ACM/IEEE International Conference for High Performance Computing, Networking, Storage and Analysis, SC ’10
- Jetley et al. (2008) Jetley P., Gioachin F., Mendes C., Kale L. V., Quinn T. R., 2008, Proceedings of IEEE International Parallel and Distributed Processing Symposium 2008
- Kazantzidis et al. (2004) Kazantzidis S., Magorrian J., Moore B., 2004, ApJ, 601, 37
- Keller et al. (2014) Keller B. W., Wadsley J., Benincasa S. M., Couchman H. M. P., 2014, MNRAS, 442, 3013
- Lin & Pringle (1987) Lin D. N. C., Pringle J. E., 1987, ApJ, 320, L87
- Macciò et al. (2008) Macciò A. V., Dutton A. A., van den Bosch F. C., 2008, MNRAS, 391, 1940
- Marinacci et al. (2011) Marinacci F., Fraternali F., Nipoti C., Binney J., Ciotti L., Londrillo P., 2011, MNRAS, 415, 1534
- Menon et al. (2014) Menon H., Wesolowski L., Zheng G., Jetley P., Kale L., Quinn T., Governato F., 2014, arXiv:1409.1929
- Mo et al. (1998) Mo H. J., Mao S., White S. D. M., 1998, MNRAS, 295, 319
- Navarro et al. (1997) Navarro J. F., Frenk C. S., White S. D. M., 1997, ApJ, 490, 493
- Pohlen et al. (2002) Pohlen M., Dettmar R.-J., Lütticke R., Aronica G., 2002, A&A, 392, 807
- Pohlen & Trujillo (2006) Pohlen M., Trujillo I., 2006, A&A, 454, 759
- Pontzen et al. (2013) Pontzen A., Roškar R., Stinson G., Woods R., , 2013, pynbody: N-Body/SPH analysis for python, Astrophysics Source Code Library
- Ritchie & Thomas (2001) Ritchie B. W., Thomas P. A., 2001, MNRAS, 323, 743
- Roškar et al. (2008) Roškar R., Debattista V. P., Stinson G. S., Quinn T. R., Kaufmann T., Wadsley J., 2008, ApJ, 675, L65
- Stewart et al. (2013) Stewart K. R., Brooks A. M., Bullock J. S., Maller A. H., Diemand J., Wadsley J., Moustakas L. A., 2013, ApJ, 769, 74
- Stinson et al. (2006) Stinson G., Seth A., Katz N., Wadsley J., Governato F., Quinn T., 2006, MNRAS, 373, 1074
- Stinson et al. (2013) Stinson G. S., Brook C., Macciò A. V., Wadsley J., Quinn T. R., Couchman H. M. P., 2013, MNRAS, 428, 129
- Übler et al. (2014) Übler H., Naab T., Oser L., Aumer M., Sales L. V., White S. D. M., 2014, MNRAS, 443, 2092
- van den Bosch (2001) van den Bosch F. C., 2001, MNRAS, 327, 1334
- Yoachim et al. (2010) Yoachim P., Roškar R., Debattista V. P., 2010, ApJ, 716, L4
- Zentner & Bullock (2003) Zentner A. R., Bullock J. S., 2003, ApJ, 598, 49