On the origin of the absorption and emission line components in the spectra of PHL 293B
Abstract
From the structure of PHL 293B and the physical properties of its ionizing cluster and based on results of hydrodynamic models, we point at the various events required to explain in detail the emission and absorption components seen in its optical spectrum. We ascribe the narrow and well centered emission lines, showing the low metallicity of the galaxy, to an HII region that spans through the main body of the galaxy. The broad emission line components are due to two off-centered supernova remnants evolving within the ionizing cluster volume and the absorption line profiles are due to a stationary cluster wind able to recombine at a close distance from the cluster surface, as originally suggested by Silich et al. (2004). Our numerical models and analytical estimates confirm the ionized and neutral column density values and the inferred X-ray emission derived from the observations.
1 Introduction
PHL 293B is an extreme emission line blue compact dwarf or HII galaxy first listed in the “Palomar-Haro-Luyten” survey of faint blue objects. It ranks among the lowest luminosity and metallicity and smallest size galaxies. The metal abundances are less than one tenth of the solar value (French, 1980; Izotov et al., 2007; Asplund et al., 2009) which situates it in the borderline of what is considered to be an extremely metal deficient galaxy (e.g. Kunth & Östlin, 2000). It is very compact with an effective radius of 0.4 kpc (Cairós et al., 2001; Geha et al., 2006) and its absolute magnitude according to the Sloan Digital Sky Survey (SDSS) is Mg = -14.8.
The optical spectrum of PHL 293B is that of a typical HII galaxy with strong narrow emission lines resembling an HII region. In addition the spectrum shows some intriguing features: low intensity broad wings in the Balmer series plus weak narrow absorptions in the hydrogen recombination lines and FeII multiplet 42, all of them blue-shifted by about 800 km s-1 with respect to the galaxy reference frame provided by the stellar IR CaII triplet.
While the observed broad wings in the Balmer lines can be originated in a very old SN remnant (the supernova rate of PHL 293B is about yr-1), in order to generate relatively narrow absorption profiles such as the ones detected in PHL 293B, it was argued that the absorbing material must cover a substantial fraction of the continuum source, in this case a young stellar cluster several parsecs in size (Terlevich et al., 2014).
From the observed Balmer line luminosity and using the equivalent width of the Balmer emission lines as an age indicator, the resulting upper limit for the ionizing star cluster mass is M☉ and the upper limit for the age is about yr.
Terlevich et al. (2014) analyzed extensive published and own photometric and spectroscopic data and found that at 3 level any long term variability, i.e. over a few years, cannot be larger than 0.02 magnitudes and that any medium term variability, i.e. over a few months, should be less than 0.04 magnitudes. Furthermore there is no variability at the level of a few tenths of magnitude over a period of 25 years. This lack of variability suggests that the spectrum of PHL 293B is not due to transient phenomena like a luminous blue variable or a type IIn SN.
From the ACIS-Chandra X-ray image of PHL 293B, Terlevich et al. (2014) estimated a luminosity upper limit in the 0.4 to 6 keV energy range of about erg s-1. Analysis of the detected narrow absorption lines of Fe allows to estimate that the column densities of ionized hydrogen () are around cm-2 if Fe/H is similar to that of the ISM in PHL 293B or substantially lower if Fe/H is that of the cluster wind. Assuming that the cluster wind has solar abundance, the estimated () column density is cm-2. From the equivalent width of the Balmer lines Terlevich et al. (2014) also estimated that the column density of neutral hydrogen is cm N(HI) cm-2. The true column density of neutral hydrogen however may be higher because only Balmer absorption were used in this estimate. Measurements on HST images indicate that the diameter of the brightest cluster is less than 5 pc.
As discussed by Terlevich et al. (2014), while the presence of broad Balmer lines and blue-shifted absorptions may be explained by either an extremely luminous blue variable (LBV) or an old SN type IIn, the lack of variability over at least a quarter of a century strongly argues against these scenarios. Thus the understanding of this object constitutes a challenge. Here we present a new scenario supported by detailed hydrodynamic calculations of a strongly radiative stationary cluster wind and a comparison of the theoretical predictions with the observed parameters.
Based on the structure of PHL 293B and on the physical properties of its ionizing cluster, we point at the various events required to explain in detail the emission and absorption components seen in its spectrum. In section 2 we ascribe the narrow and centered emission lines, to an HII region that spans through the main body of the galaxy and propose an explanation for the observed broad emission line components and the P-Cygni absorption line profiles. Section 3 deals with our conclusions and further predictions from the model.
2 Negative star formation feedback in PHL 293B
Knowledge of the cluster mass and age allow one to estimate its mechanical luminosity, and the production of UV photons. These are well known negative star formation feedback agents that structure the galaxy ISM in a wide variety of ways. These parameters together with the cluster size have been shown to define whether the mass reinserted by massive stars ends up, after thermalization, streaming all supersonically as a stationary cluster wind or if instead, strong thermal instabilities may deplete the pressure of the reinserted matter, particularly within the densest central volume, inhibiting its exit as part of the cluster wind. In the latter case, the reinserted matter is forced to accumulate there until its mass surpasses the Jeans limit, leading to a new stellar generation. As shown before, the more massive a young cluster is, the more of the reinserted matter is to accumulate and the smallest the resultant fraction of its mechanical energy output (Tenorio-Tagle et al., 2007). The two solutions are separated in the mechanical energy (or cluster mass) vs size diagram by a critical line, the position of which strongly depends on the radiative cooling law applied to the flow (see Tenorio-Tagle et al., 2007, 2013). This however, as first pointed out by Silich et al. (2004), is not the end of the story. As one considers more massive clusters of a given size and approaches the critical line, the stationary cluster wind becomes strongly radiative, letting its temperature drop to K, closer to the cluster surface. Consequently such cluster winds would not present an extended X-ray free wind region but instead a recombining and, given the ample supply of UV photons, a re-ionized region, rapidly expanding close to the cluster surface.
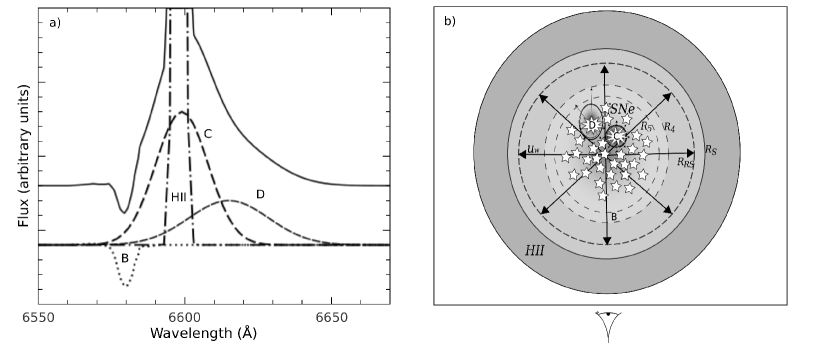
Figure 1 displays the emission and absorption components required to match the HII spectra of PHL 293B (see Figure 2 of Terlevich et al. 2014 or Figure 3 of Izotov et al. 2011), together with a sketch showing the structure of the galaxy and of its ionizing cluster, as well as the observers location. Various regions in the galaxy sketch and in the composed spectra are labeled (HII and B-D) to indicate their proposed correspondence. In this way, the narrow emission line component, centered at the redshift of the galaxy and showing its low metal abundance, results from the general ionization of the galaxy ISM (region HII). The narrow absorption line components are due to a fast ( km s-1) strongly radiative cluster wind (region B) and the broadest components arise from rapidly evolving remnants cause by the off-centered explosion of the most recent type II supernovae (regions C and D).
2.1 The cluster wind
In order to reproduce the absorption and emission line components in the spectra of PHL 293B, we have performed several hydrodynamic calculations and made analytical estimates of the feedback generated within the central star cluster. In all cases it was assumed that massive stars follow a generalized Schuster stellar density distribution (Palouš et al., 2013); in particular, with the form with , where is the distance from the center and is the core radius of the stellar distribution. This special case of the Schuster distribution appears as an asymptotic case to King’s surface formula (King, 1962) when projected onto the sky (Ninkovic, 1998). We assume the stationary presence of dust grains within the matter reinserted by massive stars as due to its continuous deposition by core-collapse supernovae and use the hydrodynamic treatment described by Tenorio-Tagle et al. (2013). We employed the equilibrium cooling function for an optically thin plasma obtained by Raymond et al. (1976) for solar metallicity and the contribution to the cooling due to gas-dust grain collisions for which we follow the prescription given by Dwek & Werner (1981). The latter is the dominant source of cooling for a gas with temperatures K (about two orders of magnitude larger than the gas cooling for a gas in collisional ionization equilibrium, as originally calculated by Ostriker & Silk (1973).
For the calculations we consider clusters close to the critical line in the mechanical luminosity (or cluster mass) vs size and that lead, as mentioned in section 2, to strongly radiative winds and thus to recombination of the stationary flow close to the cluster surface. In all cases we fixed the cluster half-mass radius, , and the cluster core radius, , and then calculate the corresponding cut-off radius, . Other input parameters are: the star cluster mechanical luminosity, and the adiabatic terminal speed . The mass deposition rate is then: . The mechanical luminosity is assumed to scale with the total mass of the star cluster as erg s-1 (Leitherer et al., 1999). Following the cluster mass estimates given in Terlevich et al. (2014) we considered star clusters with typical mechanical luminosity erg s-1. Table 1 summarizes the input parameters for our models A, B, C and D. Models A and B have the same radii, and a factor of two different mechanical luminosity. Models C and D have larger radii and the same mechanical luminosity as Model B. Models A-C are applicable once supernovae begin to take place within the cluster volume ( 3 Myr of evolution) and a continuous presence of dust within the reinserted matter is established (see Tenorio-Tagle et al., 2013). In models A-C, the dust to gas mass ratio, , was set to , dust grains were assumed to be spherical and with a radius of m. We also explored, for the sake of comparison, a model (D) with the same input parameters as model C, but without dust radiative cooling.
| Models | ||||||
|---|---|---|---|---|---|---|
| (pc) | (pc) | (pc) | (erg s-1) | (km s-1) | ||
| A | 1 | 1000 | ||||
| B | 1 | 1150 | ||||
| C | 2 | 1000 | ||||
| D | 2 | 1000 |
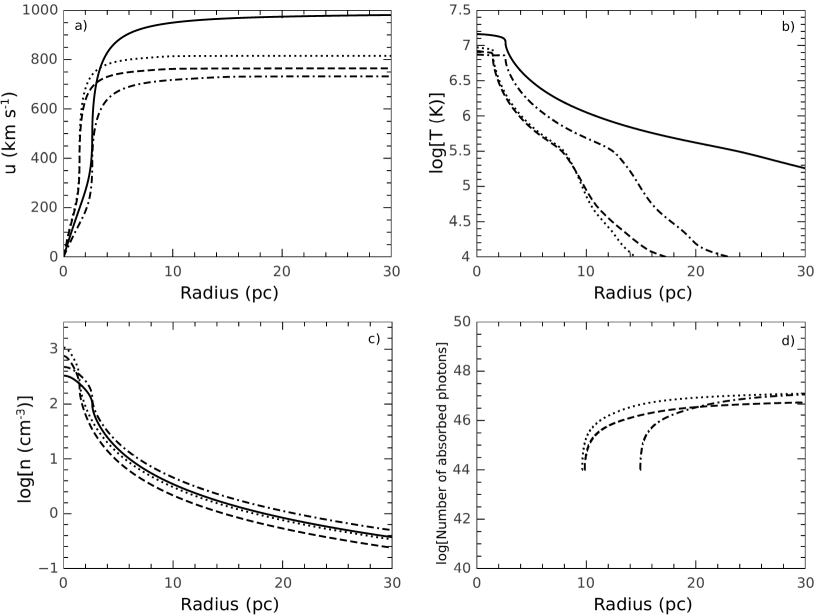
Figure 2, shows the results from the hydrodynamical calculations for models A-D. The dusty models A-C, were selected, among many models, because their stationary wind terminal velocity, , is able to reach a value km s-1 and further because strong radiative cooling is able to bring the wind temperature down to the range K, what allows for H recombination, to a short distance from the star cluster surface. The selected models are all for compact star clusters, with a central wind density value cm-3 and a temperature K (see Figure 2). In all cases, once outside the cluster the density drops as , it reaches values of a few (cm-3) when the wind temperature is K (at = ) between 10 pc and 15 pc, and then values 1 cm-3 when the cluster wind temperature reaches K, at a distance () between and pc. It is within this temperature range that hydrogen recombination takes place.
We then used the distributions of density, temperature and velocity presented in Figure 2 to calculate the outward flux of ionizing photons (cm-2 s-1) and the degree of ionization , where and are the ionized and neutral gas number densities, in the free wind region. The transport of ionizing radiation and the ionization balance equations (Goldsworthy, 1958) are then reduced to:
| (1) | |||
| (2) |
where cm2 and cm3 s-1 are the H absorption cross section for ionizing radiation and the recombination coefficient to all but the ground level, respectively, is the mean mass per particle. We solve these equations numerically assuming that the ionizing radiation is not depleted in the hot wind region until the temperature drops to K (at ) and thus that the degree of ionization and the total ionizing photon flux are kept and s-1, up to this radius.
In all our models the degree of ionization is close but not equal to unity. Note also that the number of ionizing photons is large and the wind density has a moderate value when the wind temperature reaches about K and recombination to all energy levels becomes significant. Consequently, in cases A - C the number of neutral atoms which absorb the ionizing radiation at any time is not negligible. To sustain the value of 1, some 10 ionizing photons s-1 are depleted from the radiation field to balance recombination within the volume enclosed between and (see the last panel of Figure 2). Further out, the density continues to fall in all cases, inhibiting recombination in the outer volumes and thus the number of depleted ionizing photons s-1 reaches an asymptotic value (see panel d in Figure 2). It is within this region () that radiation from the non-ionizing stellar continuum, blue-shifted from the emission line centers by some 800 km s-1, finds the neutral atoms at different energy levels that produce the weak absorption lines seen in the spectra of PHL 293B. In the dustless case D the temperature drops to K at a much larger distance from the star cluster center ( pc). By then the wind density has fallen sufficiently as to inhibit recombination, therefore this case is not presented on the last panel of Figure 2.
One can also calculate the photoionized () and neutral () hydrogen column densities taking into account that the degree of ionization is close to unity in the whole free wind region: and , where is the wind number density at the radius . In all models with dust cooling the calculated values of fall in the range cm cm-2, in good agreement with the observational estimate cm-2 by Terlevich et al. (2014). The value of changes from 0 at to the asymptotic value of (model A), (model B) and (model C) at a distance from the star cluster center. The upper limit to the neutral hydrogen column density then is: , where is the asymptotic value of the factor. This leads to neutral hydrogen column densities within the range cm cm-2 which is also in good agreement with the observational estimates (see section 1 and Terlevich et al., 2014). One can compare now these results with the dustless model D, which exhibits a quasi-adiabatic behavior, to note that despite the similar density and velocity distributions, model D does not present the drastic temperature fall at a short distance from the star cluster center and therefore it would not lead to the high velocity blue-shifted absorption features predicted for models A-C.
Finally, we have used the calculated model profiles to estimate the expected diffuse X-ray emission:
| (3) |
where and are the electron and ion number densities, is the X-ray emissivity used by Strickland & Stevens (2000), is the metallicity of the X-ray plasma in solar units and marks the X-ray cut-off radius (the radius where the temperature in the wind drops below K). For we found that in cases A and D the 0.3 keV - 2.0 keV diffuse luminosity ( erg s-1 and erg s-1, respectively) are in reasonable agreement with the observed upper limit of erg s-1 (Terlevich et al., 2014) whereas models B and C predict a somewhat larger X-ray emission: erg s-1 and erg s-1, respectively. scales almost linearly with and brings it into better agreement with the observational limits if the metallicity of the hot gas is subsolar. For example, in model A it falls to erg s-1 when .
A hot dusty plasma radiates mainly in the X-ray and IR regimes. Thus one can obtain the upper limit for the IR luminosity expected in cases A, B and C if one compares the star cluster mechanical luminosity with the energy flux through a sphere of radius at which the X-ray emission vanishes and assume that all energy lost within this volume is radiated away either in the IR or in the X-ray regime:
| (4) |
where is the ratio of specific heats and all hydrodynamical variables (the density , velocity and the value of thermal pressure ) are calculated at . This leads to IR luminosities erg s-1, erg s-1 and erg s-1 in cases A, B and C, respectively. The dusty wind models thus lead to IR luminosities which exceed the cluster wind diffuse X-ray emission by about an order of magnitude ( 8.0, 10.1 and 6.8 in models A, B and C, respectively). In the dustless case D the hot wind cools only through X-ray radiation. presents % of the total radiated energy in this case.
2.2 The broad emission lines
The broad emission components in the spectra of PHL 293B, depicted for example in Figure 2 of Terlevich et al. (2014), are here ascribed to two rapidly evolving SN remnants resultant from the most recent type II supernova explosions that had taken place within the ionizing cluster volume (see Figure 1). Furthermore, both explosions have occurred on the far side of the cluster, to account for the intrinsic redshifted emission of the evolving remnants that should expand with slower velocities into regions of higher density (towards us and the cluster center) and faster into lower density regions (towards the cluster edge). As we know the FWZI of the broadest component ( km s-1) and have a good estimate of the background density (see Figure 2, panel c) one can estimate the size of such remnants as well as their cooling time which mark the time when photoionization will lead to their strong emission at optical wavelengths. The size of such SN-driven shells from the energy conservation relation is:
| (5) |
where erg is the energy of the explosion, is the fraction of the explosion energy which is transformed into kinetic energy of the swept-up gas ( during the Sedov phase), and , and are the mass, expansion velocity and radius of the swept-up gas, respectively. Taking = 1/2 FWZI = 2 km s-1 and the average gas density within the star cluster volume as g cm-3 (see Figure 2) results into a remnant size pc, which warrants a strong SN remnant evolution within the cluster volume.
From the jump conditions across a strong shock one can derive the temperature of the swept up gas: km s, required to estimate the cooling rate, and the shocked gas density, (cm-3), equal to 4 times the background density. The above relations yield a shocked gas temperature K and a shocked gas density cm-3. These together with the value of the cooling rate, erg cm3 s-1 (see Figure 2 of Tenorio-Tagle et al., 2013) lead to the cooling time:
| (6) |
Thus the supernova remnants expanding within the cluster environment experience a strong evolution and after cooling become exposed to the cluster ionizing radiation which makes them shine at optical wavelengths. The number of ionizing photons absorbed by such a remnant is
| (7) |
where is the flux of ionizing photons per unit area of the supernovae remnant, and the factor is (see Palouš et al., 2014). If , the ratio of broad to narrow emission lines components is:
| (8) |
This ratio varies with the supernova remnant size. For pc and pc it is about 13%. Given the fact that the remnant is expected to be elongated, as it expands into gas with different densities inside the cluster volume, it may easily reach the 20% value measured by Terlevich et al. (2014).
2.3 The narrow emission line components
As depicted in Figure 1, the narrow emission line components in the spectra of PHL 293B arise from the extended HII region that surrounds the central cluster. At first glance, the narrowness of the emission lines and the low metallicity derived from the various line intensity ratios, imply that such an extended HII region is still unaffected by the mechanical energy of the central cluster. Note however that the interaction of the cluster wind with the galaxy background would unavoidably lead to the formation of a hot ( K) wind driven bubble and its surrounding supershell. The hot wind driven bubble results from the thermalization of the wind at a reverse shock and the surrounding super shell from the matter swept up by the leading shock. One expects the velocity of the supershell to decay as the evolution proceeds and more mass is gathered while it acquires a larger dimension. Estimates of both the expansion speed and the size of a supershell at a given time, can be made if one knows the cluster mechanical luminosity () the age () and the background density (). And thus, if one uses the data for PHL 293B i.e. an erg s-1, an evolution time Myr and a background density cm-3 (Terlevich et al., 2014), equations 1 and 2 of Mac Low & McCray (1988), for example, lead to an expansion speed of about 20 km s-1 and a radius of 176 pc. This implies a supershell well contained within the galaxy. However, such an expansion speed, similar to the sound speed in the photoionized region ( K, see Izotov et al. 2011) also implies that the shell is presently being disrupted by the random speed of motions in the ISM, what makes the supershell spectroscopically undetectable in PHL 293B.
3 Conclusions
A thorough study of different observational data sets of PHL 293B that span over the last two decades (Terlevich et al., 2014) has shown a lack of variability, what rules out the possibility of a luminous blue variable star or a type IIn SN as the primary source of the spectra detected in this galaxy. The idea of an expanding ( 800 km s-1) supershell causing the absorption components can also be discarded as its dynamical time will place it way out of the dwarf galaxy. On the other hand, we have shown here that a powerful, strongly radiative, stationary cluster wind is able to produce a stationary high velocity recombining layer that causes blue-shifted absorption features similar to those observed in the spectra of PHL 293B. We have taken into consideration the mass, mechanical luminosity, age and flux of ionizing photons from the central cluster of PHL 293B to built a grid of possible models of the stationary cluster wind. From these we have selected as favorites some of those that lead to a terminal velocity around 800 km s-1 and that cause a rapidly recombining stationary layer close to the cluster surface. The dusty cluster wind models, with strong radiative cooling, predict an ionized and neutral gas column density as well as a diffuse X-ray emission in very good agreement with the observed values. We thus claim that the absorption features PHL 293B present the first observational evidence for a strongly radiative stationary cluster wind, as originally discussed in Silich et al. (2004).
We have also shown that the impact of the cluster wind on the galactic environment leads to an expanding supershell which after 5 Myr of evolution presents a velocity similar to the sound speed of the photoionized gas and has become spectroscopically undetectable.
The remnants of two recent type II supernova explosions, that burst on the far side of the stellar cluster environment, have been claimed in our model as responsible for the broad redshifted emission components in the H spectra of PHL 293B. We have shown that even the fastest of these remnants undergoes a rapid evolution, reaching its cooling time while evolving well within the cluster volume. After such a time, the remnants become a target of the stellar ionizing radiation that allows us to trace them as the fastest structures in the galaxy.
4 Acknowledgments
We thank our anonymous referee for many suggestions that greatly improved the clarity of the paper. This study has been supported by CONACYT - México, research grants 167169, 131913 and 2005-4984, 2008-103365 and by the Spanish Ministry of Science and Innovation under the collaboration ESTALLIDOS (grants AYA2007-67965-C03-01, AYA2007-67965-C03-0, AYA2010-21887-C04-03 and AYA2010-21887-C04-04). GTT also acknowledges the Cátedra Jesús Serra at the Instituto de Astrofísica de Canarias (IAC, Tenerife Spain) and SS appreciates the hospitality of his colleagues during his stay at the IAC.
References
- Asplund et al. (2009) Asplund, M., Grevesse, N., Sauval, A. J., & Scott, P. 2009, ARA&A, 47, 481
- Cairós et al. (2001) Cairós, L. M., Vílchez, J. M., González Pérez, J. N., Iglesias-Páramo, J., & Caon, N. 2001, ApJS, 133, 321
- Dwek & Werner (1981) Dwek, E., & Werner, M. W. 1981, ApJ, 248, 138
- French (1980) French, H. B. 1980, ApJ, 240, 41
- Geha et al. (2006) Geha, M., Blanton, M. R., Masjedi, M., & West, A. A. 2006, ApJ, 653, 240
- Goldsworthy (1958) Goldsworthy, F. A. 1958, Reviews of Modern Physics, 30, 1062
- Izotov et al. (2011) Izotov, Y. I., Guseva, N. G., Fricke, K. J., & Henkel, C. 2011, A&A, 533, A25
- Izotov et al. (2007) Izotov, Y. I., Thuan, T. X., & Stasińska, G. 2007, ApJ, 662, 15
- King (1962) King, I. 1962, AJ, 67, 471
- Kunth & Östlin (2000) Kunth, D., & Östlin, G. 2000, A&A Rev., 10, 1
- Leitherer et al. (1999) Leitherer, C., Schaerer, D., Goldader, J. D., et al. 1999, ApJS, 123, 3
- Mac Low & McCray (1988) Mac Low, M.-M., & McCray, R. 1988, ApJ, 324, 776
- Ninkovic (1998) Ninkovic, S. 1998, Serbian Astronomical Journal, 158, 15
- Ostriker & Silk (1973) Ostriker, J., & Silk, J. 1973, ApJ Let, 184, L113
- Palouš et al. (2014) Palouš, J., Wünsch, R., & Tenorio-Tagle, G. 2014, ApJ, 792, 105
- Palouš et al. (2013) Palouš, J., Wünsch, R., Martínez-González, S., et al. 2013, ApJ, 772, 128
- Raymond et al. (1976) Raymond, J. C., Cox, D. P., & Smith, B. W. 1976, ApJ, 204, 290
- Silich et al. (2004) Silich, S., Tenorio-Tagle, G., & Rodríguez-González, A. 2004, ApJ, 610, 226
- Tenorio-Tagle et al. (2013) Tenorio-Tagle, G., Silich, S., Martínez-González, S., et al. 2013, ApJ, 778, 159
- Tenorio-Tagle et al. (2007) Tenorio-Tagle, G., Wünsch, R., Silich, S., & Palouš, J. 2007, ApJ, 658, 1196
- Terlevich et al. (2014) Terlevich, R., Terlevich, E., Bosch, G., et al. 2014, MNRAS, in press