119–126
Mechanisms of plasma disruption and runaway electron losses in tokamaks
Abstract
Based on the analysis of data from the numerous dedicated experiments on plasma disruptions in the TEXTOR tokamak the mechanisms of the formation of runaway electron beams and their losses are proposed. The plasma disruption is caused by strong stochastic magnetic field formed due to nonlinearly excited low-mode number magneto–hydro–dynamics (MHD) modes. It is hypothesized that the runaway electron beam is formed in the central plasma region confined by an intact magnetic surface due to the acceleration of electrons by the inductive toroidal electric field. In the case of plasmas with the safety factor the most stable runaway electron beams are formed by the intact magnetic surface located between the magnetic surface and the closest low–order rational surface ( , , …). The thermal quench time caused by the fast electron transport in a stochastic magnetic field is calculated using the collisional transport model. The current quench stage is due to the particle transport in a stochastic magnetic field. The runaway electron beam current is modeled as a sum of toroidally symmetric part and a small amplitude helical current with a predominant component. The runaway electrons are lost due to two effects: () by outward drift of electrons in a toroidal electric field until they touch wall and () by the formation of stochastic layer of runaway electrons at the beam edge. Such a stochastic layer for high–energy runaway electrons is formed in the presence of the MHD mode. It has a mixed topological structure with a stochastic region open to wall. The effect of external resonant magnetic perturbations on runaway electron loss is discussed. A possible cause of the sudden MHD signals accompanied by runaway electron bursts is explained by the redistribution of runaway current during the resonant interaction of high–energetic electron orbits with the MHD mode.
1 Introduction
One of the severe consequences of the plasma disruptions in tokamaks is the generations of the runaway electron (RE) beams (see, e.g., Wesson et al. (1989); Gill (1993); Schüller (1995); Gill et al. (2000, 2002); Wesson (2004); Boozer (2012); Papp et al. (2013) and references therein). The REs generated during the disruptions of tokamak plasmas may reach several tens of MeV and may contribute to the significant part of post–disruption plasma current. The prevention of such RE beams is of a paramount importance in future tokamaks, especially in the ITER operation, since it may severely damage a device wall (Bécoulet et al., 2013).
At present there are several proposals to mitigate REs generated during plasma disruptions. The mitigation of REs by the gas injections has been discussed (see, e.g., Refs. (Hender et al., 2007; Whyte et al., 2002, 2003; Bakhtiari et al., 2002, 2005; Granetz et al., 2007; Bozhenkov et al., 2008; Pautasso et al., 2009; Lehnen et al., 2009; Hollmann et al., 2010; Reux et al., 2010; Lehnen et al., 2011)). Suppression of REs by the resonant magnetic perturbations (RMPs) has been also intensively discussed since late 1990s (see, e.g., Refs. (Kawano et al., 1997; Tokuda & Yoshino, 1999; Helander et al., 2000; Yoshino & Tokuda, 2000; Lehnen et al., 2008, 2009; Hollmann et al., 2010; Papp et al., 2011, 2012)). However, up to now there is no a regular strategy to solve this problem. One of the reasons is that the physical mechanisms of the formation of REs during plasma disruptions is still not well–known. The different scenarios of runaway formation during plasma disruptions are discussed in literature. Particularly, in Refs. (Fülöp et al., 2009; Fülöp & Newton, 2014) the possible roles of whistler waves on the generation of REs and Alfvénic wave instabilities driven by REs have been discussed.
There were numerous dedicated experiments to study the problem of runaway current generation during plasma disruptions triggered by massive gas injections (MGI) in the TEXTOR tokamak (see, e.g., (Forster et al., 2012; Zeng et al., 2013; Wongrach et al., 2014)), in KSTAR tokamak (Chen et al., 2013), the JET tokamak (Plyusnin et al., 2006; Lehnen et al., 2011), in DIII-D (Hollmann et al., 2010; Commaux et al., 2011; Hollmann et al., 2013), Alcator C-Mod (Olynyk et al., 2013), and others. In these works the dependencies of RE generation on the toroidal magnetic field, on the magnetic field fluctuations, on the species of injection gases have been investigated. Particularly, in KSTAR tokamak (Chen et al., 2013) it has been found that there is no the toroidal magnetic field threshold T as was indicated by previous experiments in other tokamaks. In Ref. (Izzo et al., 2011, 2012) MHD simulations have been performed to study the confinement REs generated during rapid disruptions by MGI in DIII-D, Alcator C-Mod, and ITER. Such simulations with two different MHD codes have been carried out by Izzo et al. (2012) to analyze shot–to–shot variability of RE currents in DIII-D tokamak discharges.
These numerous experiments show the complex nature of plasma disruption processes especially the formation of RE beams, and its evolution. One of the important features of this event is its irregularity and variability of RE beam parameters from one discharge to another one. This indicates the sensitivity of disruption processes and RE beam formations on initial conditions which is the characteristic feature of nonlinear processes, particularly, the deterministic chaotic system. Therefore, ab initio numerical simulations of these processes may be not always successful to understand their mechanisms because of the complexity of computer simulations of nonlinear processes (Kadanoff, 2004). The problems of numerical simulations of plasma disruptions is comprehensively discussed by Boozer (2012).
In this work we intend to approach to this problem from the point of view of Hamiltonian chaotic systems, mainly the magnetic stochasticity in a magnetically confined plasmas (Abdullaev, 2014). Based on the ideas of these systems and analyses of numerous experimental results, mainly obtained in the TEXTOR tokamak we propose possible mechanisms of formation and evolution of RE beams created during plasma disruptions. Since a self–consistent theoretical treatment of all these processes is very complicated we developed theoretical models for each stages of a plasma disruption. These models are used to estimate the characteristic times of the thermal and current quenches, the spatial size of runaway plasma beam and their decay times, the speed of RE radial drifts, the effect of magnetic perturbations.
It is believed that the plasma disruption starts due to a large–scale magnetic stochasticity caused by excited of MHD modes with low poloidal and toroidal numbers, (, ) (see, e.g., (Wesson, 2004; Kadomtsev, 1984; Gill, 1993; Schüller, 1995) and references therein). The heat and particle transports in the strongly chaotic magnetic field causes the fast temperature drop and ceases the plasma current. However, at the certain spectrum of magnetic perturbations, for example, at the sufficiently small amplitude of the mode the chaotic field lines may not extend to the central plasma region due to the creation of an intact magnetic surface. In the case of plasmas with the safety factor at magnetic axis the intact magnetic surface can be located between magnetic surface and the nearest low–order rational surface [or , …]. This intact magnetic surface confines particles in the central plasma region and serves as a transport barrier to particles during the current quench. Electrons in the confined region are accelerated due to large toroidal electric field and forms the relatively stable of RE beams.
This occurs, for instance, when the plasma disruption initiated by the heavy Ar gas injection which does not penetrate deep into the plasma, therefore it does not excite the mode with the sufficiently large amplitude. In contrary, the injection of the lighter noble gases neon and helium does not generate runaways. The reason is that light gases penetrate deeper into the plasma and excite the large–amplitude () mode.
The existence of an intact magnetic surface and its location depends on the radial profile of the safety factor and the spectrum of magnetic perturbations. The latter sensitively depend on the plasma disruption conditions and vary unpredictably from one discharge to another during plasma disruptions. This makes RE formation process unpredictable and may explain a shot–to–shot variability of the parameters of RE beams.
The role of the safety factor profile in the formation of RE beams can be pronounced during disruptions of plasmas with the reversed magnetic shear. In the plasmas with the non-monotonic radial profiles of the safety factor it has been observed an improved confinement of energy and particles due to the internal transport barrier located near the minimal value of the safety factor, i.e., near the shearless magnetic surface (Levinton et al., 1995; Strait et al., 1995). During disruptions this magnetic surface acts as a robust magnetic barrier that separates a chaotic magnetic field formed in outer region from the penetration into the central plasma region. Electrons confined by the shearless magnetic surface can form a stable RE beam with a relatively large transversal size. Recently published results of the disruption experiments in the TFTR tokamak with the reversed magnetic shear indeed show the formation of a large RE beam with long confinement times (Fredrickson et al., 2015).
Based on this mechanism we study the main three stages of the post–disruption plasma evolution: the fast thermal quench (TQ), the current quench (CQ), and the RE beam evolution. The physical processes during each of these stages will be studied by theoretical models. These processes are the formation of stochastic magnetic field, heat and particle transport in a stochastic magnetic field, the acceleration of electrons by inductive electric field, the lost mechanisms of REs, and the effect of internal and external magnetic perturbations. The short report on this study is to publish in Abdullaev et al. (2015).
The paper consists of eight sections. Mathematical tools and models employed to study the problems are given in Supplementary part. The numerous data obtained during the dedicated experiments in the TEXTOR tokamak are analyzed in Sec. 2. Possible mechanisms of plasma disruptions with a RE beam formation is proposed and analyzed in Sec. 3. The transport of heat and particles during the fast TQ and the CQ stages of plasma disruption are studied in Sec. 4. The model of a post–disruption plasma beam is proposed in Sec. 5. Using this model a time–evolution of guiding–center (GC) orbits of electrons accelerating by the inductive toroidal electric field is studied in Sec. 6. Particularly, the change of RE confinement conditions with decreasing the plasma current and increasing the electron energy and the outward drift of GC orbits are investigated. The effect of external and internal magnetic perturbations on the RE confinement are discussed in Sec. 7. In the final Sec. 8 we give the summary of obtained results and discuss their consequences.
2 Description of plasma disruptions
The TEXTOR was a middle size limiter tokamak with the major radius m, the minor radius cm. The toroidal field can be varied up to 2.8 T, and the plasma current take up to 600 kA. In the experiments the plasma disruptions were triggered in a controlled way by gas injections using a fast disruption mitigation valve (DMV) (Bozhenkov et al., 2007; Finken et al., 2008, 2011; Bozhenkov et al., 2011). Particularly, the disruptions with REs were triggered by argon (Ar) injection. The runaway-free disruptions were triggered either by helium or neon (He/Ne) injection performed by the smaller valve. The effect of the externally applied RMPs on the REs generations has been investigated using the dynamic ergodic divertor (DED) installed in the TEXTOR tokamak.
Below we analyze the experimental results of discharges with the predisruption plasma current kA and the toroidal field T. Figure 1 (a) illustrates typical disruptions of the discharges of the TEXTOR tokamak with and without RE generations. Specifically, it shows the time evolution of plasma parameters (the loop voltage , the electron cyclotron emission (ECE), the soft X-ray (SXR) signal, the Mirnov signal, and scintillation probe signals (ScProbe) during disruptions of the discharges with REs (#117434, #117859, #119978, #120140) and without (#117444) REs.
There are also some discharges with untypical RE currents and shorter current decay times. The two examples of such discharges are shown in Fig. 1 (b). We will discuss some features of these discharges at the end of the section.
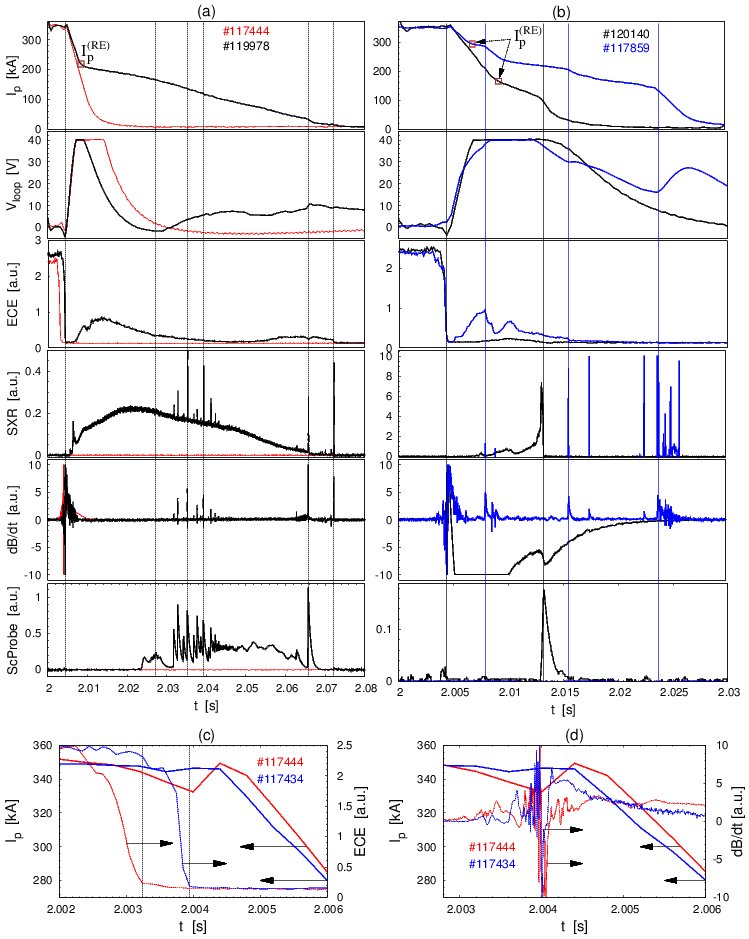
The typical behavior of the plasma during the disruptions is following. The gas (Ar or Ne/He) was injected at the time instant s. One can distinguish three stages of the disruption with the REs: the first (or fast) stage in which a sudden temperature drop occurs, in the second stage the plasma current starts to decay with a higher rate, and in the third stage the current decay slows down and the current beam with the REs is formed.
2.1 Thermal quench stage
The first fast stage starts after a few milliseconds (between 2 ms and 5 ms) after the gas injection and ends with a sudden temperature drop (a thermal quench) in a time interval about one ms as seen from the ECE signals shown in a detail in Fig. 1 (c). The Mirnov signals indicating magnetic activities start just before of this time interval and they last a few milliseconds until a significant decay of the plasma current for the RE–free discharges or establishing the current with the REs (see Fig. 1 (a)). The close–up views of the ECE signals and the Mirnov signals in this stage for the discharges with REs (#117434) and without REs (#117444) are shown in Figs. 1 (c) and (d), respectively.
For our study it is of importance to analyze in details the difference in the time development of the TQ stage of disruptions without REs and with REs, initiated by the massive injection of lighter (Ne) and heavier (Ar) noble gases. (i) In Fig. 1 (c) one can see that the TQ stars roughly s, in the former case, and s, in the latter one, after the initiation of injection. The ratio of these delay times is of and can be well explained by the difference in the atomic weight of gases in question. Indeed, the flow velocity of neon atoms is by a factor of higher than that for argon and, thus, atoms enter the plasma after a respectively shorter time.
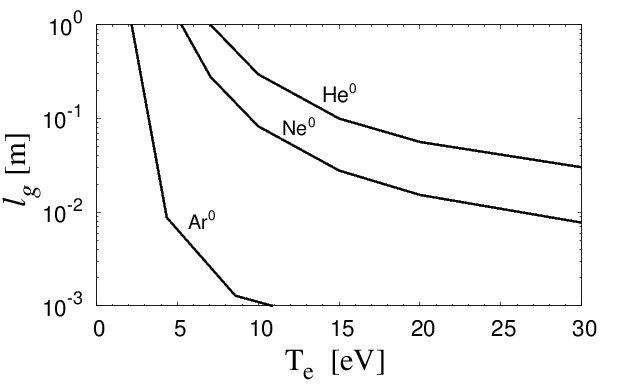
(ii) By comparing Figs. 1 (c) and 1 (d) we find that by injection of neon the TQ stage is finished before MHD perturbations are triggered. That is in this case TQ is completely due to cooling induced by the presence of impurity atoms squeezed in a narrow jet and penetrating deep enough into the plasma core. The penetration depth of gas atoms, , where is the ionization rate coefficient. Figure 2 displays versus the electron temperature with the electron m-3 computed for He, Ne and Ar, by using open atomic data base ADAS111OPEN–ADAS: Atomic Data and Analysis Structure. http://open.adas.ac.uk/. for and assuming that the gas jet has a radial velocity of 2 sound speeds at the room temperature. One can see that for light gases, He and Ne, can exceed the minor radius of TEXTOR of m if inside the gas jet the plasma is cooled down to a temperature of several by energy losses on excitation and ionization of gas atoms and thermalization of generated electrons, as it is demonstrated in Koltunov & Tokar (2011). The rest of magnetic surfaces is cooled down by the heat conduction along magnetic field lines to the jet area (Tokar & Koltunov, 2013). Thus, the plasma is cooled down as a whole during a time of ms. Only later tearing modes are exited on numerous resonant magnetic surfaces due to the growth, as , of the plasma resistivity.
(iii) In the case of Ar the penetration depth is much smaller, mostly due to much larger ionization rate, than for He and Ne atoms and Ar gas is ionized at the plasma edge. Due to edge cooling very sharp radial gradients of the plasma resistivity and plasma current density are generated. Since the growth rate of tearing modes (Wesson, 2004), MHD modes resonant mostly on outer magnetic surfaces with the safety factor noticeably large 1 are triggered. The magnetic field stochastization due to these modes leads to the fast cooling of the main plasma volume during a time of ms (see Sec. 4.1). This explains why in shot 117434 with Ar injection the temperature drop happens although later but faster than in shot 117444 with Ne, and MHD activity starts to develop even before the TQ, see Figs. 1 (c) and (d).
2.2 Current quench stage
The second stage of the plasma disruption begins with the current decay within a millisecond after the TQ. Particularly, for the discharges #117434 and #117444 the current decay starts in s and s, respectively, after the temperature drop (see Figs. 1 (a) and (c)). In discharges without the RE formation the current decays with the same rate until it completely disappears in a few millisecond. In the discharges with the RE formation the strong current decay stops at the certain value of and replaced by slower decay. The initial RE current is shown in Figs. 1 (a) and (b). In this stage the loop voltage starts to rise due to inductive electric field opposing to the current decay.
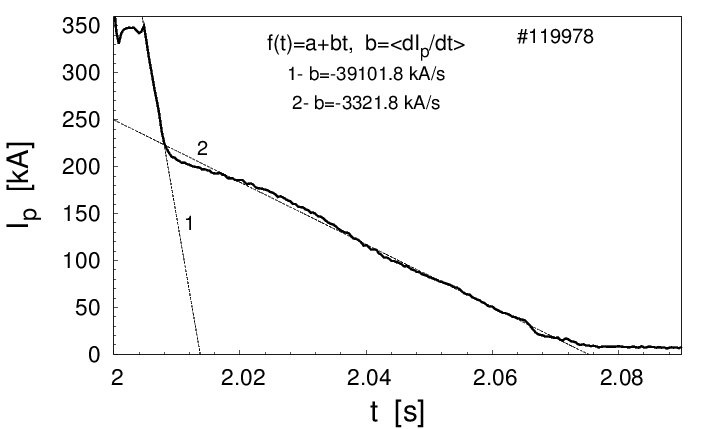
The time dependence of the plasma current in this stage for all discharges is well approximated by the linear function of time , where the coefficient determines the average current decay rate. The scheme of determination of is shown in Fig. 3.
The values of the current decay rate during the CQ and RE plateau regimes, the initial RE current for a number of discharges are listed Table 1. It also shows the time when the applied RMPs, i.e., the DED current reaches its maximal value, and the toroidal mode of the RMPs.
(a) (b)
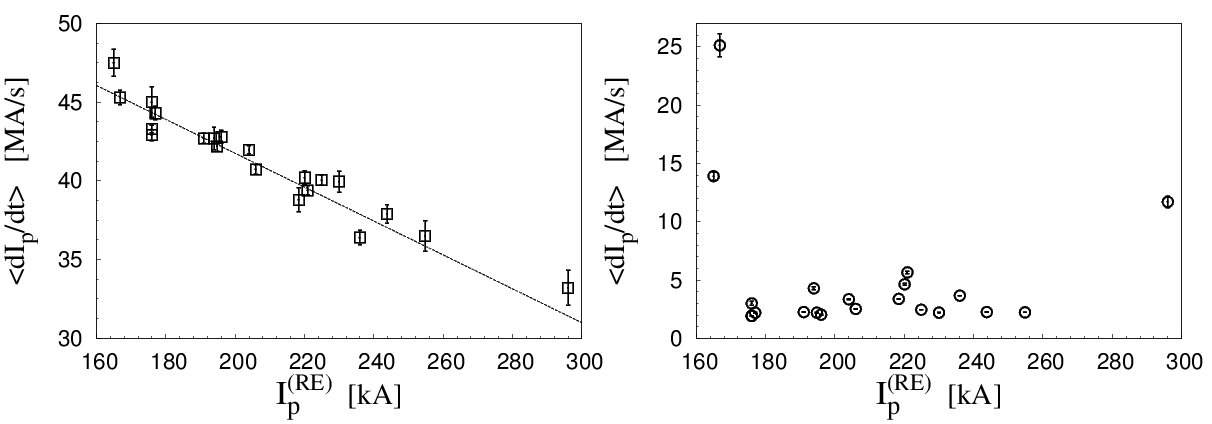
The dependencies of on the initial RE current for a number of discharges are plotted in Fig. 4 (a) and (b) in the CQ regime and the RE current decay stage, respectively. The current decay rate for all discharges are the same order and lies between and [MA/s] as listed in the 2-nd column of Table 1 and shown in Fig. 4 (a). The highest values of is observed for the discharges without REs and with the lowest values of the RE current . As can see from Fig. 4 there is a clear regular dependence of the current decay rate on the initial RE current, which can be fitted by a linear function, with constant parameters . In Sec. 4.2 we will discuss the possible mechanism of such a current decay related with the transport of particles in a stochastic magnetic field.
| Discharge No. | nd stage | rd stage | [kA] | DED , , |
|---|---|---|---|---|
| 117434 | 220.1 | no | ||
| 117444 | N/A | N/A | no | |
| 117507 | 193.9 | no | ||
| 117527 | 220.9 | no | ||
| 117543 | NA | N/A | no | |
| 117859 | 296.0 | no | ||
| 119868 | 224.9 | no | ||
| 119869 | 230.0 | 2.02 s, , 1 kA | ||
| 119870 | 254.8 | 2.02 s, , 1.5 kA | ||
| 119874 | 243.8 | no | ||
| 119877 | 166.8 | s, , 2 kA | ||
| 119978 | 218.4 | no | ||
| 119990 | 204.0 | no | ||
| 120106 | 196.0 | s, , 4 kA | ||
| 120107 | 206.0 | s, , 4 kA | ||
| 120108 | 191.0 | s, , 4 kA | ||
| 120109 | 176.0 | s, , 4 kA | ||
| 120123 | 236.0 | no | ||
| 120126 | 176.0 | s, , 7 kA | ||
| 120134 | 176.0 | s, , 7 kA | ||
| 120135 | 177.0 | s, , 7 kA | ||
| 120140 | 165.0 | s, , 6 kA | ||
| 120141 | 194.8 | s, , 6 kA |
2.3 RE plateau stage
In the third stage (RE plateau) of the disruption the rapid current decay is replaced by it’s slow decay and it starts the formation of the REs due to the acceleration of electrons in the inductive toroidal electric field and the secondary generation of REs. The values of the current decay rate along with the initial values of the plasma current in this stage for several discharges are listed in the 3–rd and the 4–th columns of Table 1 and plotted in Fig. 4 (b). The average values of for almost all discharges are confined in the interval (2.2, 5.6) MA/s, i.e., in one order lower than the current decay rate in the second stage. The values of are also confined in the range between 170 kA and 260 kA, except of some untypical discharges, which will be discussed in the next subsection. These values of and are close to the ones observed in the similar experiments in the DIII-D tokamak (see, e.g., (Hollmann et al., 2010, 2013)).
One should also note that in the RE plateau stage at certain time instants one observes also a sudden current drop accompanied by magnetic activity and RE bursts as seen from Figs. 1 (a) and (b) (see also e.g., Refs. (Gill et al., 2000; Forster et al., 2012)). These events are probably related to the nonlinear interaction of high–energetic electrons with MHD modes which leads formation a stochastic layer at the beam edge open to the wall. We will discuss this phenomenon in Sec. 7.3. In the final termination stage one observes the quick RE current losses accompanied by magnetic activity.
2.4 Untypical discharges with REs
As was mentioned above there are several untypical discharges for which the rates take highest or lowest values (see Figs. 1 (b), Fig. 4 (b), and Table 1). Particularly, the current decay rate (in the 2-nd stage) for #117859 is lowest and highest for discharges #119877, #120140. The RE current decay rate (in the 3-rd stage) for these discharges takes highest values. The quantity takes the lowest value for the discharges #119877, #120140 and the highest value for #117859 as shown in Fig. 4 (b). One can notice strong spikes in the SXR signals of these discharges in compared to typical discharges (see Fig. 1 (a) and (b)). Moreover, the above mentioned bursts of REs accompanied by magnetic activities are more pronounced in these discharges. We will discuss the peculiarity of these discharges in Secs. 3 and 5.
2.5 Effect of the RMPs on RE generation
In a number of discharges the effect of the DED of the TEXTOR (see Sec. 5.2 of Supplementary Part) on the RE generation has been studied. It was found that the RMPs do not completely eliminate the RE formation, but it can increase the decay rate and decrease . This effect depends on the operational mode , the amplitude of the DED current , on the time when the maximal DED current is reached. As seen from Table 1 the maximal effect is obtained when the maximal is reached before the gas injection at s, i.e., s. However, at s the RMPs does not affect at al or it is a very weak. Other experimental observations in the TEXTOR also confirm these observations (Koslowski et al., 2014). We will discuss this problem in Sec. 7.2.
3 Formation of a confined plasma beam
3.1 Main conjecture
It is believed that the plasma disruption is caused by a large scale magnetic stochasticity of field lines due to interactions of nonlinearly destabilized MHD modes (Carreras et al., 1980; Kadomtsev, 1984; Lichtenberg, 1984; Fukuyama et al., 1993; Wesson, 2004; Kruger et al., 2005; White, 2014)). The global stochasticity are mainly due to the interactions of coupled MHD modes with low () numbers: (), (). The structure of a stochastic magnetic field mainly depends of the amplitudes of MHD modes and the radial profile of the safety factor , where is the minor radius of a magnetic surface. Depending on these parameters the stochastic magnetic field may fill entirely plasma region so that the plasma particles are transported out along chaotic magnetic field lines which leads to cease of a plasma current. However, at certain conditions the stochastic magnetic field may not extend up to the central plasma region due to the formation of a magnetic barrier by the outermost intact magnetic surface at . The electrons confined by this magnetic surface are accelerated by the toroidal electric field induced the current decay from outer plasma region, and thus forming a RE beam. Let be the plasma current flowing inside the magnetic surface of radius ,
| (1) |
where is the current density. Then the initial RE current is mainly determined by the predisruption plasma current distribution confined by the intact magnetic surface , i.e., .
As will be shown in Secs. 6 and 7 the decay of the RE beam mainly depends on the two effects: the outward drift of RE orbits induced by the toroidal electric field and their resonant interactions with helical magnetic perturbations. The outward drift velocity is determined of and the RE current,
| (2) |
The most stable RE beams are expected to form when the corresponding drift velocity is lowest and the low–order rational magnetic surfaces within the RE beam are absent or only one.
3.2 Possible generic structures of stochastic magnetic fields
Below we study possible structures of the stochastic magnetic field which may lead to the formation of the RE beams. We consider the two type of the safety factor profiles of : () the monotonic radial profile and () the non–monotonic radial profile, corresponding to the plasmas with the reversed magnetic shear.
The models for the radial profiles of the plasma current , the safety factor of the pre-disruption equilibrium plasma, and the MHD magnetic perturbations are given in Sec. 3 of Supplementary part. The perturbation magnetic field simulating low–mode number MHD modes is given by the toroidal component of the vector potential
| (3) | ||||
| (4) |
with the mode amplitudes and rotation frequencies . Here is toroidal field strength, is the major radius , and the functions describes the radial profiles of modes.
One should note that the structure of magnetic field lines in the presence of magnetic perturbations is less sensitive to the radial profiles of . It is mainly determined by the safety factor profiles and the mode amplitudes at the resonant surfaces , (see Sec. 7.2 of Supplementary part).
Monotonic radial profile of : The case . The typical TEXTOR plasma has the monotonic safety factor profile with the value at the magnetic axis . In this plasma, the mode should play an important role on the structure of stochastic field lines near the plasma center. At low amplitudes of this mode the global stochastic field lines may not reach magnetic surface and may form a confined region about the plasma center where REs can be generated. At high amplitudes of the mode the stochastic field lines may cover entire plasma region with no confined particles.
As was mentioned above in TEXTOR experiments plasma disruptions with REs were deliberately caused by the injection of Ar gas while the RE–free disruptions are triggered by He/Ne injection. Experiments show that the penetration lengths of atoms depends on their atomic weights (Bozhenkov et al., 2008): He (or Ne) atoms penetrate deeper into plasma than Argon atoms. The injection of these gases may finally give rise to different spectra of amplitudes of MHD modes. One can expect that the amplitude of the MHD mode excited by the He/Ne injection is higher than in the case of Argon gas injection.
The two possible distinct generic structures of a stochastic magnetic field before the current quench with the RE-free discharge and with the RE discharge are shown in Figs. 5 (a) and (b) by the Poincaré sections of magnetic field lines. It is assumed that the perturbation field contains several MHD modes: (), (), (), and (). In the case shown in Fig. 5 (a) the normalized mode amplitudes are , and in Fig. 5 (b): . The toroidal field magnitude is T and the dimensionless perturbation parameter . As seen from Fig. 5 (a) for the larger amplitude of the () mode the stochastic magnetic field extends up to the central plasma region destroying the separatrix of the island. For the low–amplitude of the () mode shown in Fig. 5 (b) the stochastic magnetic field does not reach the magnetic surface and covers the region outer the magnetic surface. The last intact magnetic surface (red curve) is located between the resonant surfaces and (blue curves).
(a) (b)
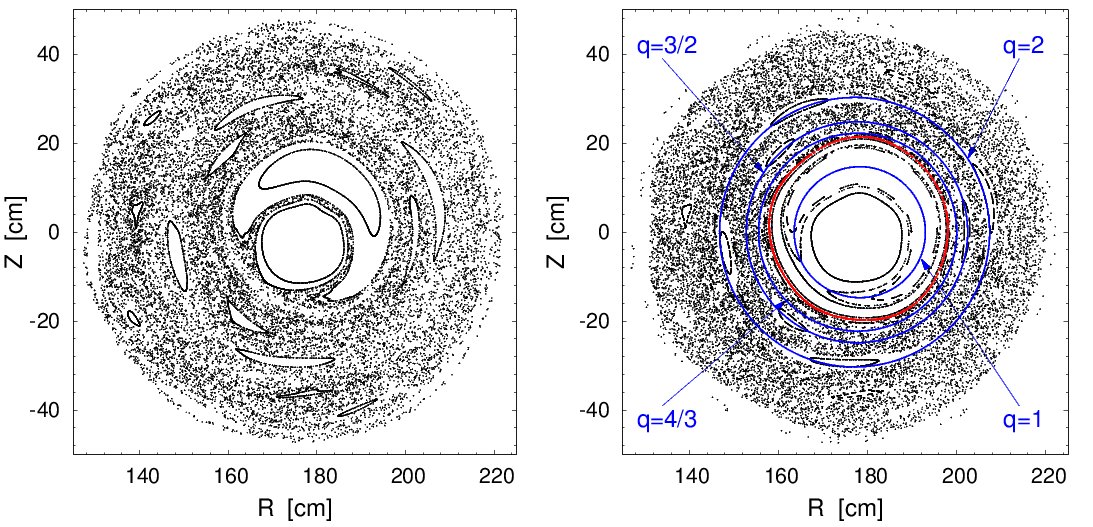
As seen from Fig. 5 particles in the plasma core are confined by intact magnetic surfaces located between resonant surfaces and . Plasma beam confined in this area is relatively stable. It contains only the MHD mode which does not lead to a global stochasticity. The radial transport of particles from the confined area can take place only due to small–scale turbulent fluctuations and therefore it has much smaller rate than those in the stochastic zone. The confinement time of these electrons is sufficiently long enough to be accelerated by the inductive electric field, thus creating a RE beam. The modeling of the current of this confined plasma will be discussed in Sec. 5.
Monotonic radial profile of : The case . In this case the mode does not play significant role in the formation of the stochastic zone in the plasma center. However, the modes with contribute much to the growth of stochastic zone and shrinkage of the intact magnetic surface . The examples of such stochastic magnetic fields are shown in Fig. 6 (a) and (b) corresponding to the values and , respectively.
(a) (b)
The outward drift velocity of such RE beams is significantly larger than the one in the case . This is because of the smaller RE beam radius and the higher toroidal electric field . Such RE beams decay in shorter times.
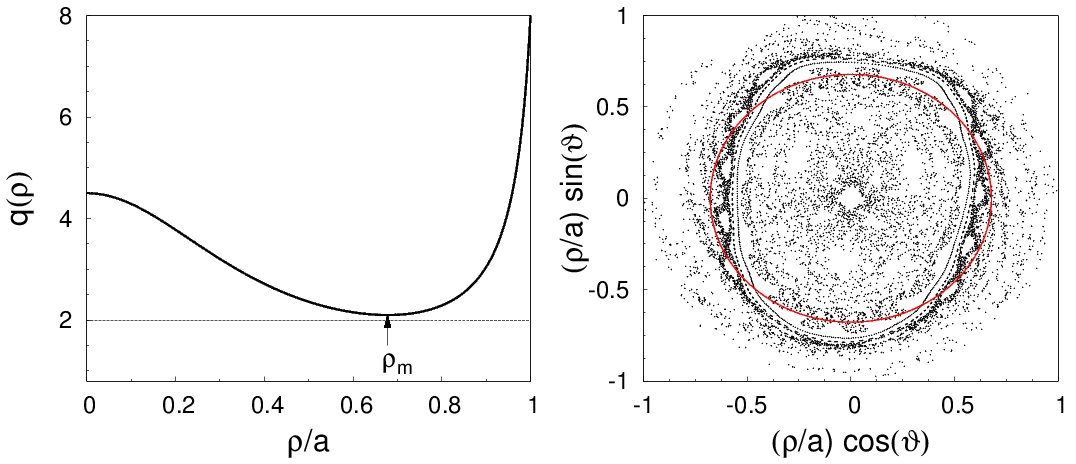
Plasma with reversed magnetic shear. In this case the safety factor has a minimal value located at normalized radius 0.4-0.6 and increases towards the center and the plasma edge. Figure 7 (a) and (b) show the example of the non–monotonic radial profile of the safety factor and the corresponding Poincaré section of stochastic magnetic field lines (More detailed description of this case is given Sec. 7.3 of the Supplementary Part). The intact magnetic surface located near the shearless magnetic surface (red curve), i.e. the magnetic surface with a minimal value of the safety factor , is not broken even at the relatively large magnetic perturbations. And it confines electrons in the central plasma region.
Due to the relatively large confined area the RE beam would carry a large current . According to (2) the decay rate of this RE beam owing to the outward drift would be small. This effect probably explains the large RE current with a long lifetime observed in the TFTR tokamak during the disruption of plasmas with the reversed magnetic shear (Fredrickson et al., 2015).
(a) (b)
3.3 Experimental evidences
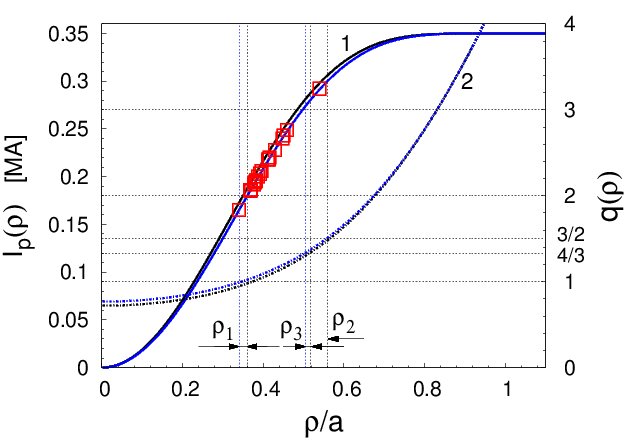
Existence of the finite interval of the RE currents . It follows from the conjecture above that the RE current is mainly determined by the current distribution in the predisruption plasma confined by the intact magnetic surface , i.e., . Since is located between the magnetic surfaces and corresponding to and , the RE current should be in a finite range. This expectation is in line with the experimental data presented in Fig. 4. One can see that the range of stable values shown in Fig. 4 b corresponds well to the space between resonant magnetic surfaces with and [or ]. In Fig. 8 the radial profile of the pre–disruption plasma current and the corresponding safety factor profile are plotted. Also values of found in other experiments on TEXTOR, see Ref. (Zeng et al., 2013), lie in the same range.
Since the -value the plasma axis is one of the major causes for uncertainties in the -profile, in Fig. 8 we show and profiles for and . These are in the range of values experimentally measured between sawtooth crashes in the TEXTOR tokamak (Soltwisch & Stodiek, 1987; Soltwisch et al., 1987) (see also(Wesson, 2004), page 372). The values of measured after pellet injection in the DIII-D tokamak experiments are also close to these values (Izzo et al., 2012). Thus, small changes in still keeps the RE currents in the interval . The highest and lowest values of shown in Fig. 8 corresponding to the discharges #117859 and #120140, respectively, lie at the border of region . They have the shortest duration time for the RE current decay (see Table 1 and Figs. 1 (b), 4). The presence of a several low–order , , and resonant magnetic surfaces within the RE beam may lead to excitations of the corresponding MHD modes. The interactions of these modes may lead to the quick loss of REs due to the formation of stochastic zone at the edge of the RE beam (see Sec. 7).
Dependence on the level of magnetic perturbations. The existence of the intact magnetic surface between the and (or ) rational magnetic surfaces and its location depends on the level magnetic perturbation (more exactly on the spectrum ). With increase of the radius shrinks and it can be broken at the certain critical perturbation level . It leads to the total destruction of the confinement of plasma particles. This is in agreement with experimental observations on the existence of a critical magnetic perturbation level above which the runaway beams are not formed (Zeng et al., 2013).
The shrinkage of with increasing the magnetic perturbation leads to the decrease of the RE current since . On the other hand if one assumes that the plasma current decay is caused by the radial transport of particles in the stochastic magnetic field, its decay rate should be proportional to the square of the magnetic perturbation level , (see Sec. 4.2). Therefore, one expects that to the higher values of correspond the lower values of the RE current . This expectation is in agreement with the experimental values of these quantities presented in Fig. 4 (a).
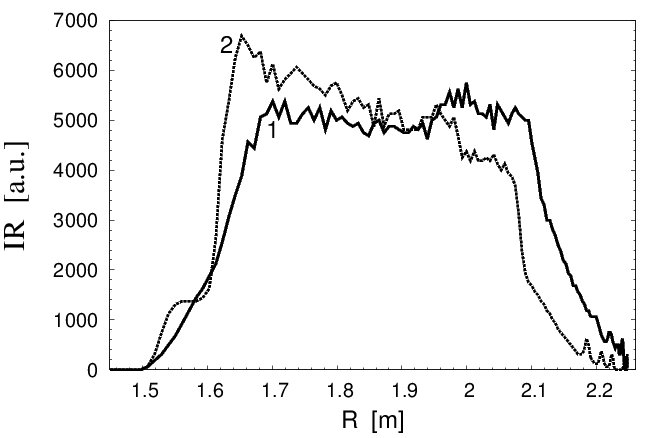
Synchrotron radiation pattern. The formation of the RE beam inside the intact magnetic surface can be also confirmed by the spatial profiles of the synchrotron radiation of high–energy REs with energies exceeding 25 MeV. Figure 9 shows the radial profiles of infrared radiation of the REs at the equatorial plane for the two TEXTOR discharges. One can see that radiation is localized inside finite radial extent corresponding to the central region of plasma within the magnetic surface (see Fig. 5 (b)). One should note the radiation from the plasma edge regions, and is due to thermal radiation of the wall elements. The outward shift of the radiation pattern is explained to some extend by the drift of RE beams discussed in Sec. 6.1.
Another indication of the formation of confined plasma beam is the rise of the temperature at the initial stage of the beam formation as seen in the ECE signals shown in Figs. 1 (a) and(b). It may occur due to the Ohmic heating of confined plasma by the induced toroidal electric field or by superthermal emission from high energy electrons. As thermal electrons are converted into runaway ones the beam temperature goes down.
4 Thermal and current quench stages
Our analysis in section 2.1 reveals that both the processes induced directly by injected atoms and strong radial transport along stochastic magnetic field lines created by MHD-perturbations can lead to heat losses from the plasma in the TQ stage of disruption. During this stage the temperature drops on a timescale of several hundreds of microseconds; current decay time is of ms in RE–free discharges and increases up to 0.1 s in discharges with RE generations.
As one can see in Fig.1 the CQ stage before the formation of RE beams coincides well with the time interval where magnetic perturbations are significant and the particle transport in stochastic magnetic field leads to the current decay. To study these processes we use the models for stochastic magnetic field and collisional transport of test particle described in Sec. 7 of Supplementary part.
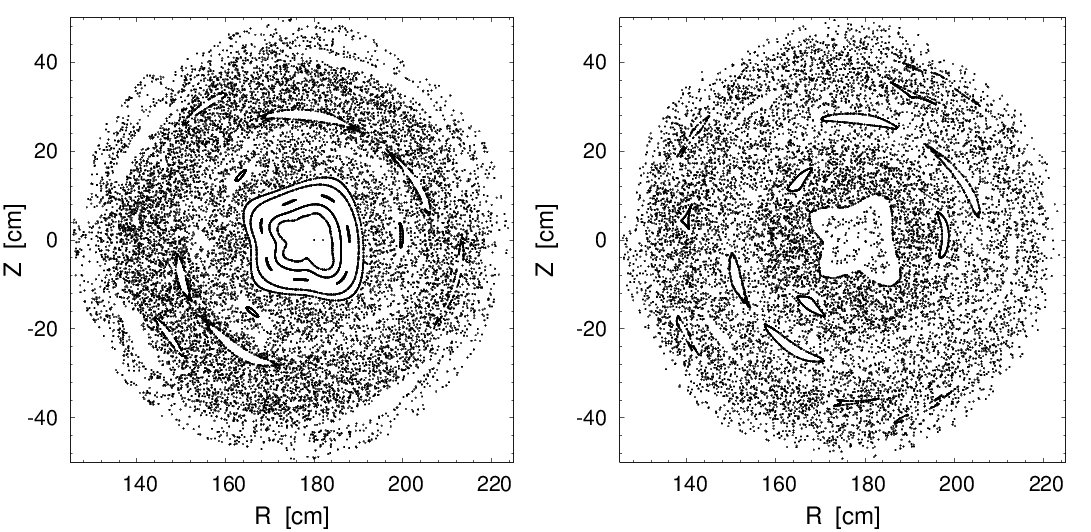
Figures 10 (a) and (b) shows the typical Poincaré sections of field lines of this model in the runaway-free disruption case (a) and the case with RE generation (b). The perturbation amplitudes of all MHD modes, except mode, correspond to the twice larger value of than the case shown in Fig. 5. For the mode corresponds to the same value of . The relation between and is , where is the toroidal magnetic flux at the plasma edge (see Sec. 7 of Supplementary part).
(a) (b)
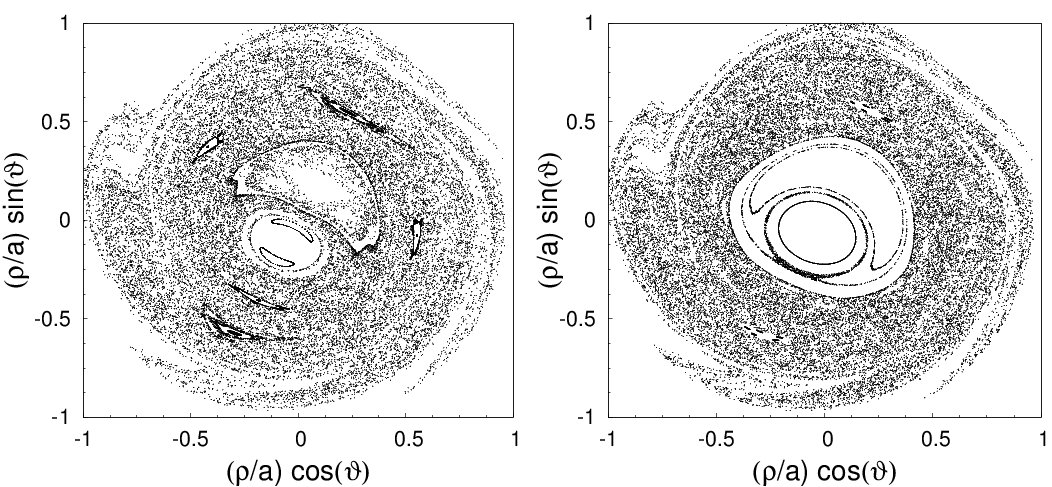
In general the transport of heat and particles in the presence of RMPs is a three–dimensional problem. Particularly, a stochastic magnetic field with the topological structures like ones in Figs. 10 leads to poloidally and toroidally localized heat and particle deposition patterns on wall (Kruger et al., 2005). This is a general feature of open chaotic systems which has been observed in ergodic divertor tokamaks (see, e.g., (Finken et al., 2005; Jakubowski et al., 2006; Abdullaev, 2014)). The problem can be simplified when we are interested only in radial transport rate. It can be done by introducing the radial diffusion coefficient averaged over a poloidal angle.
4.1 Heat transport
The electron heat conductivity in a stochastic magnetic field has been assessed by diverse approaches. We apply here the following formula for the electron heat diffusion deduced on the basis of simulations for transport of test particles, by taking into account coulomb collisions with background plasma species (Abdullaev, 2013) (see also Sec. 10.4 in (Abdullaev, 2014)):
| (5) |
where is the thermal velocity of electrons, the diffusion coefficient of field lines (m), the mean free path length of electrons with the temperature and density measured in keV and , respectively, and is the characteristic connection length.
A characteristic heat diffusion time one can estimate as , where for we assume it’s magnitude at the radial position a. Before the disruption the local temperature here is of keV. This provides m2/s and s, i.e. of the order of the experimentally observed time for the plasma temperature drop during the TQ after disruption.
For a quantitative analysis we have modeled the time evolution of the radial profile for the electron temperature averaged over the poloidal and toroidal angles, . This is done by solving numerically the following diffusion equation:
| (6) |
where the heat diffusivity is given by equation (5) and the applied boundary conditions are: at and at the plasma edge , where is the characteristic e-folding length for the temperature decay in the scrape-off layer.
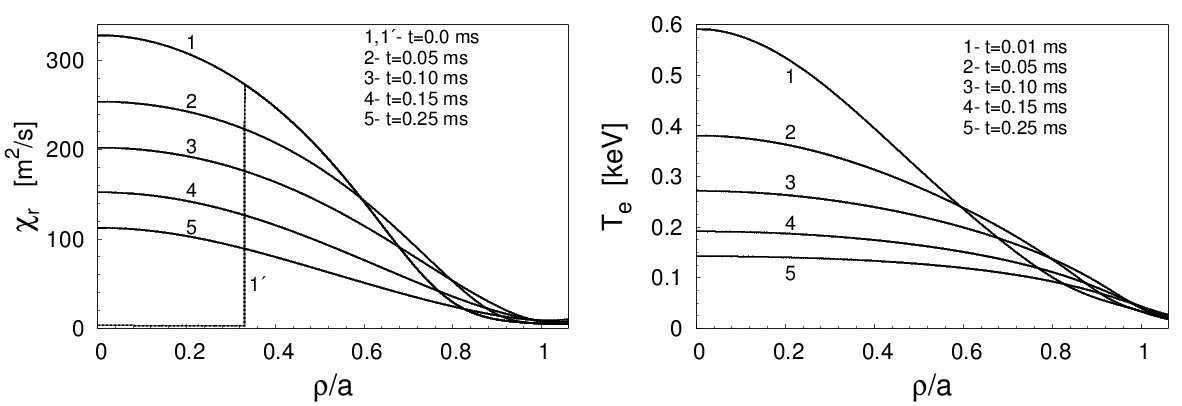
Below we consider an example of heat transport in a fully chaotic magnetic field shown in Fig. 10 (a). Figures 11 (a) and (b) show the radial profiles of the heat conductivity and the temperature at different times. One can see in this case the temperature drops and almost flattens within a time interval of order of 0.5 ms.
(a) (b)
In the situation with partially stochastic magnetic field, see Fig. 10 (b), anomalous turbulent transport in the very plasma core, , with intact magnetic surfaces is by two orders of magnitude smaller than in the outer region. In this case the temperature drop in the central plasma region could be explained by the effect of parallel transport in the magnetic island created by the MHD mode and some level of stochastization in a thin layer near the island separatrix (see a review by Schüller (1995) for more details).
4.2 Current quench stage
As was discussed in Sec. 3.3 the current decay rate depends on the initial RE current which in turn depends on the level of magnetic perturbations. Therefore, one can assume that the current decay rate may implicitly depend on the level of magnetic perturbations. This assumption, however, may contradict to the traditional view that the current decay rate is determined by the time , i.e., by the ratio of the plasma resistivity to it’s inductance : . In the simplest case when and are constants it leads to the exponential decay law . However, in many tokamaks, particularly in the TEXTOR tokamak, the current decay evolution is better fitted by the linear function rather than by the exponential function (see Fig. 3). At present the reason of such a dependence is not quite clear. So other mechanisms may also play role in the CQ (see, e.g., Kadomtsev (1984); Gerhardt et al. (2009); Shibata et al. (2010) and references therein).
Particularly, one cannot exclude that the poloidal and toroidal variations of the plasma current imposed by the initial MHD modes in the TQ stage do not disappear immediately with the temperature drop (see also Sec. 5 and Eqs. (7) and (11)). This leads to the corresponding variations of the poloidal magnetic field which acts as non–axisymmetric magnetic perturbations. Below we discuss a possible role of the radial transport of particles in a stochastic magnetic field created by such magnetic perturbations.
The magnetic field structure before the CQ has been assumed similar to the one shown in Fig. 10. The level of magnetic perturbations may be different from that during and after the thermal quench when strong magnetic fluctuations are present, see Fig. 1 (d).
The timescale of the current decay is determined by the rate of radial particle transport in a stochastic magnetic field. This process has the ambipolar nature and it is strongly collisional due to the low plasma temperature. On other hand one expects that the toroidal electric field induced by the current decay also strongly affects the particle transport. Below we give a rough estimation of the particle transport rate based on the collisional test particle transport model.
| [keV] | [m2/s] | [s] |
|---|---|---|
| 0.005 | 0.0986057 | 1.072 |
| 0.050 | 0.386249 | 2.739 |
| 0.100 | 1.01251 | 1.045 |
| 0.500 | 6.46228 | 1.637 |
| 1.000 | 9.51915 | 1.111 |
| 2.000 | 13.1030 | 8.074 |
| 4.000 | 17.8366 | 5.932 |
| 5.000 | 23.7424 | 4.456 |
| 10.00 | 27.0265 | 3.915 |
In Table 2 we have listed the ambipolar diffusion coefficients and the characteristic diffusion times of particles at the different plasma temperatures in a stochastic magnetic field shown in Fig. 10. The typical plasma temperature after the TQ is about from 5 eV to 50 eV. The average particle confinement time at this temperature changes from 1 s to 0.3 s. These time scales are shortened if the magnetic perturbation level is larger. Since the diffusion coefficient and therefore , then can be reduced to one order smaller value for three times larger perturbation than in Fig. 10. This timescale is still much longer than the experimentally observed values. However, this collisional model does not takes account the effect of the inductive toroidal electric field. One expects that the acceleration of electrons and ions by the electric field increases the radial transport of particles. To include this effect in the collisional model one can assume that the effective temperature of the plasma is higher than the measured one. The particle diffusion time for the effective temperature 2 keV is about s. This timescale gives the average current decay rate MA/s which is of the order of the experimental measured rates given in Table 1.
More rigorous approach to the particle transport in a stochastic magnetic field during the current decay stage would require a three–dimensional treatment of the problem. It should take into account not only the formation of the ambipolar electric potential (Spizzo et al., 2014) but also the inductive toroidal electric field which accompanies the process. The latter may lead to the directionality of the particle transport that eventually may influence on the random vertical displacement of runaway beams. Of course, the study of these complicated processes is out of the scope of the present work.
5 Modeling of post–disruption plasma
The described scenario of plasma disruption with a RE beam allows one to model a post-disruption plasma. After establishing the runaway beam the current is localized inside the area enclosed by the last intact magnetic surface. In general the distribution of the current density would depend not only on the radial coordinate but also vary along the poloidal and the toroidal angles due to the presence of the () magnetic island. Such a post–disruption plasma current can be presented as a sum of two parts,
| (7) |
where is the current density depending only on the radial coordinate , and is the helical current which is a periodic function of the poloidal and toroidal angles.
The radial dependence of can be also modeled by assuming that after the disruption the current is uniformly distributed over confined area with the steep gradient at the beam edge . Calculations show that electron orbits does not significantly depend on the specific of the radial profile of . For our calculations of GC orbits we choose the following profile
| (8) |
where is the constant determined by the full current of the beam and is the steepness parameter. The current flowing inside magnetic surface , i.e., is given by
| (9) |
where is the full current of the confined area.
One should also note the fact that after the TQ the plasma beam is shifted inwardly because of drop of plasma pressure. In the modeling this fact can be taken into account by assuming that the radial position of the center of the post–disruption plasma is different from the one of the pre–disruption plasma. The safety factor of the corresponding plasma is then given by
| (10) |
where is the safety factor of the cylindrical plasma, the function is a function which takes into account the toroidicity of plasma. The coefficients , () depends on the plasma pressure (Abdullaev et al., 1999; Abdullaev, 2006).
Figure 12 shows the radial profiles of (solid curves 1–3 on the l.h.s. axis) (9) and the safety factor (10) (dashed curves on the r.h.s. axis) for the three discharge parameter, respectively. Solid black curve 4 corresponds to the pre–disruption plasma current profile. We set the toroidal field magnitude T, the beam center at m. The plasma radius is found from the condition where is the current profile of the pre–disruption plasma. The vertical dashed color arrows show the radial positions of the , , and magnetic surfaces and the vertical solid arrows indicate the plasma radii .
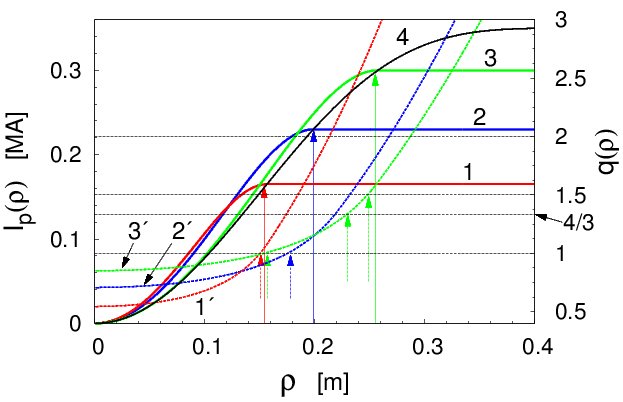
Note that that the red curves 1 and and green curves 3 and in Fig. 12 correspond to the discharges with the lowest and highest values of shown in Fig. 1 (b). For the lowest value of the radial position of the magnetic surface is very close to the RE beam radius . For the highest value of the magnetic surfaces with , , and are located inside the plasma region . However, the radial position of the magnetic surface is at the plasma edge. For the typical discharges like the one shown by blue curves the magnetic surface is located relatively far from the plasma edge.
The Fourier expansion of the helical current, ,
| (11) |
is mainly dominated by the component. This assumption is based on the analysis of numerous disruptions in the JET tokamak (Gerasimov et al., 2014).
We should assume that the value of the safety factor at the beam axis is less than unity. This assumption is supported by a number of experimental measurements of the current profile after the sawtooth crashes in the TEXTOR, the TFTR, and JET tokamaks (Soltwisch et al., 1987; Yamada et al., 1994; Soltwisch & Koslowski, 1995; O’Rourke, 1991; Koslowski et al., 1996; Soltwisch & Koslowski, 1997).
This model of the post–disruption plasma current describes only the initial stage of RE beam. During acceleration of electrons in the toroidal electric the RE orbits drift outward and their form evolves from the circular one to oval one. This process changes in turn the RE beam form and its current. The self–consistent description of the time evolution of the RE beam is a difficult problem. It is beyond of the scope of this present study.
6 Evolution of GC orbits during acceleration
Now we discuss the dynamics of RE orbits during the acceleration of electrons induced by the toroidal electric field in a toroidal post–disruption plasma. Mainly we study the outward drift of RE orbits and it’s role in the RE losses. However, we will not consider the processes of the generation and the proliferation of the RE population, the problems of stability of RE beams and related issues. These problems have been much discussed in literature.
6.1 Outward drift of RE orbits
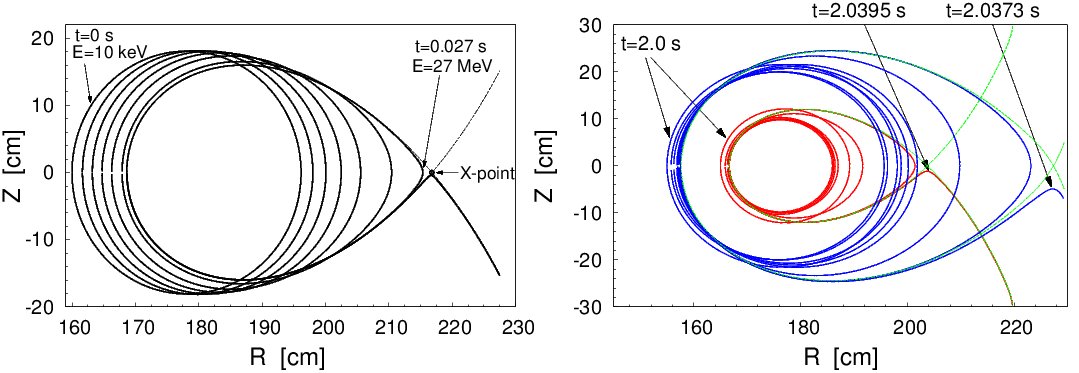
First we consider the case of the axisymmetric plasma beam neglecting the helical magnetic perturbations. The inductive toroidal electric field generated due to the current decay during the plasma disruption accelerates thermal electrons. This is an adiabatic process since the characteristic time of significant variation of energy is much larger than the transit time of electrons. Therefore the GC orbit slowly drifts outward without changing the area of GC orbit in the poloidal plane which is an adiabatic invariant or the action variable (see Sec. 6.1 of Supplementary part)). With increasing electron energy the topology of GC orbits also slowly changes from the circular one to the oval one. Starting from the certain critical energy the adiabaticity of the process breaks and the GC orbit bifurcates by creating the unstable stagnation point (or X-points) inside the plasma region. With the further increase of energy the GC orbit crosses the separatrix (a homoclinic orbit associated the X-point) and becomes unconfined. The value depends on the plasma current . The described phenomenon is an addition mechanism of confinement loss of REs. Figure 13 (a) shows a typical evolution of a GC orbit in the presence of the toroidal electric field with the constant beam current kA and the loop voltage V.
One should note that the formation of the separatrix of RE GC orbits during the acceleration process in tokamaks has been first predicted in Ref. (Zehrfeld et al., 1981). The numerical study of this process in a realistic tokamak configuration has been carried out in Ref. (Wongrach et al., 2014). Particularly, it was shown that with increasing electron energy the area confined by the separatrix decreases and it vanishes when the energy exceeds a certain critical value , i.e. such electrons cannot be confined. The critical energy is proportional to the square root of the plasma current , .
The described evolution of RE orbits is in agreement with the experimental observation of the IR radiation patterns observed in the experiment in the TEXTOR tokamak (Wongrach et al., 2014) and in the DIII-D tokamak (Hollmann et al., 2013). The observations clearly show the evolution of the spatial form of RE beam from crescent ones into oval ones with increasing the electron energies.
The example of the time–evolution of GC orbits in the plasma beam with a time–varying current and the loop voltage corresponding to the TEXTOR discharge #117527 is shown in Fig. 13 (b). To simplify the calculations of orbits we have assumed that the loop voltage is uniform in the poloidal section, i.e., it does not depend on the radial coordinate and equal to the experimentally measured value at the limiter. However, this assumption only approximately describe the situation. To find more the exact magnitudes of the toroidal electric field during the runaway current decay one should solve the corresponding Maxwell equations.
(a) (b)
One of the important parameter of the GC orbit is the effective safety factor defined as a ratio where is the increment of the toroidal angle per one poloidal turn. It is a function of the action variable and particle energy . For low–energy electrons the quantity coincides with the safety factor of the equilibrium magnetic field. With increasing the electron energy the effective safety factor strongly deviates from . With approaching RE energy to the critical one it diverges as
| (12) |
Figure 14 shows the typical time evolutions of the effective safety factors of two GC orbits during the electron acceleration in the conditions of the TEXTOR discharge #117527.
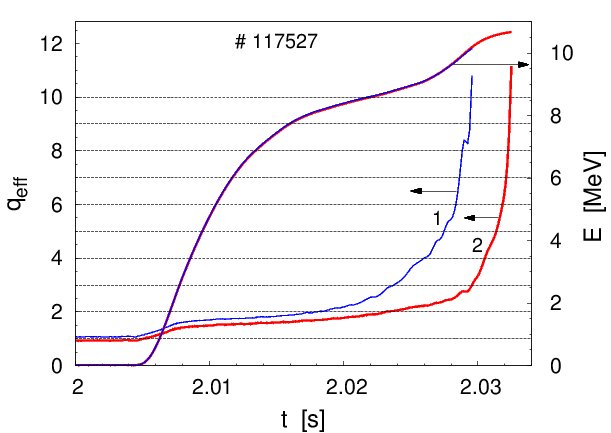
Figure 15 shows the time–evolution of the outward drift velocity calculated numerically for the three different RE beam currents. It is quite well described by formula derived in Ref. (Abdullaev, 2015)) (see also Sec. 4 of Supplementary part)
| (13) |
where is the effective poloidal magnetic field, is the component of the poloidal magnetic field at the equatorial plane , is the term depending on a particle energy. The quantity
| (14) |
is the average transit time, is the toroidal electric field strength, is the transit time of orbit, is the toroidal velocity.
The expression (13) describes the creation of the X-point and the separatrix of RE orbits at the critical energy . This phenomenon is related with the appearance of zeroes of the effective poloidal magnetic field at and the certain radial distance within the plasma region (see Abdullaev (2015) for details).
At , and the formula (13) is reduced to
| (15) |
obtained by Guan et al. (2010); Qin et al. (2011) for the circular orbits. Here is the safety factor of magnetic field. As seen from Fig. 15 the formulas (13) and (15) give the correct dependence of on the plasma current , because .
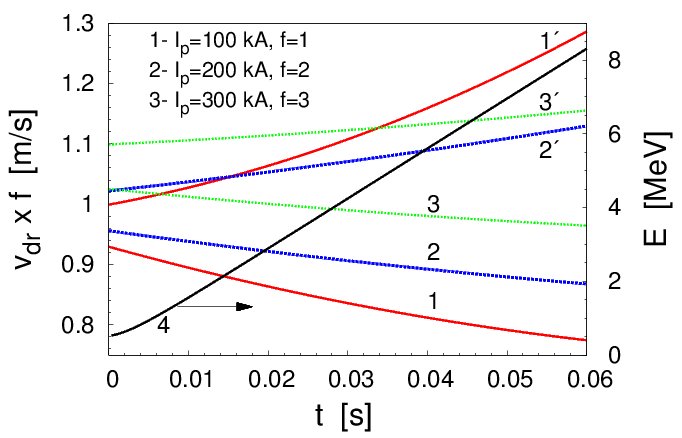
However, the formula (15) does not describe the situation when the GC orbits take an oval form with increasing the energy similar to the ones shown in Figs. 13 (a) and (b). From the latter it follows that the average outward velocity of the innermost part of the orbit is approximately equal 0.6 m/s and 8 m/s of the outermost part of the orbit.
6.2 RE current decay
The rate of the runaway current loss due to described outward drift of orbits can be roughly estimated as follow. This loss mechanism is mainly caused by the shrinkage of the beam radius . The rate of such a shrinkage is of order of the average outward velocity . Since , we have
| (16) |
For the typical values of , m, and m/s one has MA/s. This estimation is of order of the experimentally measured average decay rate of the runaway current listed in Table 1.
Since the safety factor , as well as of RE beams is about unity, then the outward drift may slowdown for the higher values of the toroidal magnetic field . However, much the higher toroidal electric field may compensate this effect so that the decay time of RE currents in large tokamaks, like ITER, may have the same order as in smaller tokamaks.
One should also note that the outward drift velocity is proportional to the inverse aspect ratio of tokamaks, (Abdullaev, 2015). It means that the RE current loss due to the outward drift of orbits in spherical tokamaks would be larger than in standard tokamaks, so that the RE electron would cease faster. This effect could be one of reasons of the absence of REs during disruptions in NSTX tokamaks (Gerhardt et al., 2009).
Beside of outward orbit drifts the RE current losses is also caused by the internal MHD mode which be discussed in the next section. The collisions of REs with neutral particles may also contribute to the RE losses.
7 Effect of magnetic perturbations
The effect of the magnetic perturbations on electrons in the post–disruption current beam strongly depends on its safety factor profile , the spectrum of magnetic perturbations, and the electron energy. To explain this effect we consider the simplified version of GC motion equations in the presence of magnetic perturbations. (The rigorous consideration of this problem is given in Sec. 6 of Supplementary Part).
The particle drift motion in the presence perturbations can be presented by Hamiltonian equations similar to the equations for magnetic field lines,
| (17) |
with the Hamiltonian with the canonical variables , and the toroidal as the time–like variable. In the absence of perturbations GC orbits wound the drift surfaces const and the poloidal angle is a linear function , . In the presence of perturbations Hamiltonian can be presented as a sum
| (18) |
Since the perturbation are periodic in poloidal and toroidal angles and in time it can be presented by a Fourier series
| (19) |
The strongest influence of perturbation on particles takes place on the () resonant drift surfaces, i.e.,
| (20) |
originating from the () term in (19) with the amplitude . They are determined by the magnetic perturbation spectrum ,
| (21) |
where the poloidal angle associated with magnetic field lines is a function of as well as particle energy .
For low–energy electrons (up to 5 MeV) the spectrum of amplitudes weakly depends on energy and close to the spectrum of magnetic perturbations of th modes. With increasing the energy the spectrum of perturbations deviates from and acquires more higher poloidal harmonics . The example of the poloidal spectra of perturbation for different particle energies is shown in Fig. 16 (a). The corresponding unperturbed orbits are plotted in Fig. 16 (b). It is assumed that the magnetic perturbation contains a single mode.
(a) (b)
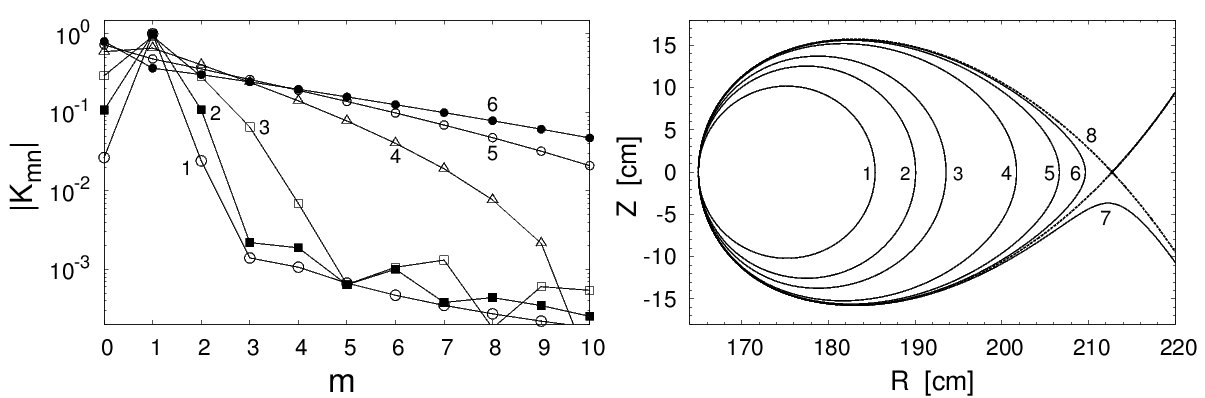
For the low energy electrons with MeV the spectrum contains the predominant mode.
With increasing the energy the amplitudes of higher also grow and the width of the poloidal spectrum in becomes wider as shown in Fig. 16 (b). For the spectrum one can obtain the following asymptotical formula for the orbits close to the separatrix (see Sec. 3.4 in (Abdullaev, 2014))
| (22) |
where is a finite constant, and the effective safety factor diverges as (12).
As was shown in Sec. 5 (see also Fig. 12) the typical values of varies between at the magnetic axis and at the plasma edge. Therefore, the strongest effect of the RMPs on electron orbits may expect if its spectrum contains a sufficient number of components that are resonant to the magnetic surfaces with in the interval that would create a stochastic zone of magnetic field lines. The electrons from this stochastic layer would be then radially transported to wall.
Below we discuss the influence of magnetic perturbations on RE orbits for the two specific cases. First we consider the effect of internal single helical magnetic field, and then we analyze the effect of the external RMPs, namely, the TEXTOR-DED on the confinement of REs.
7.1 Effect of a single helical magnetic field
Assume the magnetic perturbation (3) contains the single MHD mode as was proposed in the model of the post–disruption current beam described in Sec. 5. For the low–energy electrons it creates a single island structure since the deviations of their GC orbits from the magnetic surfaces is small. Such a system is stable because the single MHD mode does not create stochasticity of magnetic field lines. The example of this case is shown in Fig. 17 (a) by the Poincaré sections of RE orbits (red dots) and magnetic field lines (blue dots).
With increasing the energy of electrons and decreasing the beam current the electron’s GC orbits strongly deviate from the magnetic field lines. The effective safety factor of the GC orbit increases as the electron energy grows as was shown in Fig. 14. At certain time instants the value of reaches the integer value so that the resonant condition may be satisfies for the higher harmonics of the GC orbits with the magnetic perturbation. This generates a number of island chains of GC orbits. The interaction of several such island structures may even lead to the formation of the stochastic layer near the separatrices [see Figs. 13 (a) and (b)].
(a) (b)
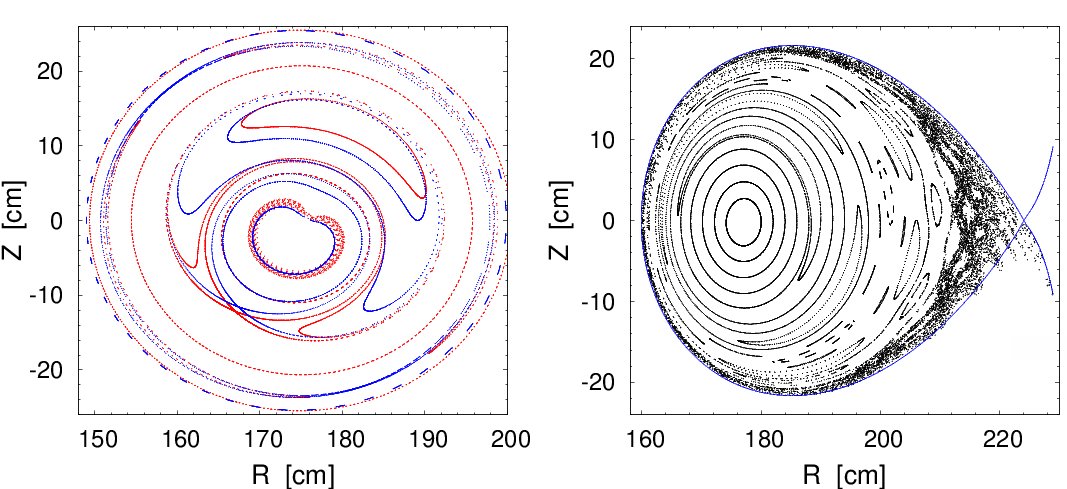
Figure 17 (b) illustrates the typical structure of high–energy electrons in the presence of the internal helical magnetic field with a single mode. Such a structure leads to the widening area of lost electrons and decreasing the critical energy . The characteristic escape time of REs from the stochastic layer is of order of 10 s. Sudden RE bursts in many discharges is probably related with the loss REs from the stochastic layer. Occurrence of the MHD mode signals accompanied these events will be discussed in the next Sec. 7.3.
As was discussed above in Secs. 2 and 5 (also Figs. 1 (b) and 12) there are some exceptional discharges (for example #117859) with the highest RE current and several low–order rational surfaces within plasma beam. Such a beam can be easily destabilized by the magnetic perturbations containing several MHD modes with low–order () numbers. Such a magnetic perturbation may affect strongly on electrons creating the chaotic zone at the beam edge open to wall. Such an effect probably explains the sudden lost of REs at certain times seen in Fig. 1 (b).
7.2 Influence of the TEXTOR–DED
The coil configuration of the TEXTOR–DED is designed to have the poloidal spectra of magnetic perturbations localized near the magnetic surface of the flat–top plasma discharges (see Sec. 5.2 of Supplementary part). Therefore, these perturbations do not contain a necessary number of resonant components to create a stochastic zone of magnetic field lines in the post–disruption current beam with the safety factor lying between and .
In the so–called 3/1 operational mode with the predominant toroidal mode toroidal there is only one component resonant to the magnetic surface . The similar situation takes place in the 6/2 mode () with the resonant component . [There are no magnetic surfaces in the plasma region that are resonant to the components and ]. On the other hand this resonant component of the DED field is weak since it is located away from the maximum of the spectrum. Therefore, the effect of the DED on the RE beam does not create the stochastic zone of magnetic field lines from which electrons would escape to wall as in the case of the stochastic zone in a flat–top plasma operation. The only component of the DED perturbations may create an island structure near the magnetic surface similar to one shown in Fig. 17 (a).
With increasing the energy of REs and decreasing the plasma current the DED perturbation starts to affect on REs because of appearance of high–mode resonances similar to the case discussed in Sec. 7.1. It generates the structures with islands and a stochastic layer. Figures 18 (a) and (b) show the typical Poincaré sections of GC orbits of energetic electrons affected by the TEXTOR–DED: (a) corresponds to the mode with the DED current kA; (b) corresponds to the mode with kA. The particle energy is taken MeV, the plasma current kA, and the toroidal field T. These structures explain the fast decay of RE current in its final stage accompanied by spikes in the scintillation probe (see Fig. 1 (b)).
(a) (b)
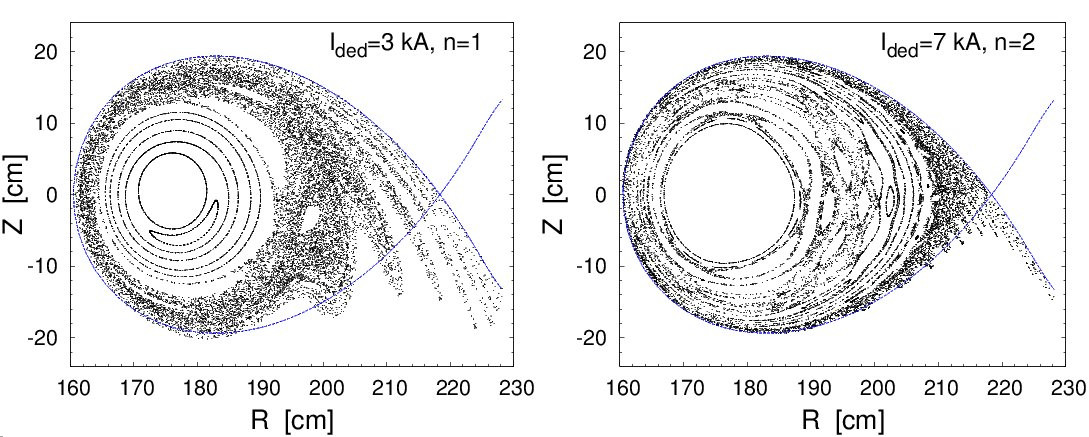
The structures of RE orbits shown in Figs. 17 (b) and 18 correspond to the final termination stages of RE current. They have features which are characteristic for the so–called stable and unstable manifolds created by the splitting of separatrices (see, e.g., (Abdullaev, 2014)). They lead to the toroidally and poloidally localized deposition patterns of REs on wall. Toroidal peaking and spatial–temporal evolution of hard X-ray emission in the final stage of RE current loss observed in DIII-D experiments (James et al., 2012) is consistent the described topology of REs.
The experimental observations in the TEXTOR-DED have indeed showed that the RMPs field which switched on just after the TQ does not affect on the radial transport and the loss of low–energy electrons (Koslowski et al., 2014; Wongrach et al., 2015) (see also Table 1). This is mainly because of the mentioned features of the poloidal and toroidal spectra of the DED field.
7.3 Generation of magnetic perturbations by high–energy electrons
The above mentioned in Sec. 2 the occurrence of the MHD activities during the sudden RE bursts can be explained by the nonlinear interaction of high–energy electrons with the MHD mode. The MHD magnetic perturbations with mode numbers higher than the initial mode can be generated during the acceleration process of the REs. At certain energy of REs their orbits strongly deviate from the magnetic surfaces which creates in turn higher harmonics, , of the MHD () mode (21). The resonant interaction of RE orbits with these harmonics leads to the redistribution of corresponding current near these orbits according to the helicity of these modes. Therefore, the current density (11) acquires higher components which in turn generates the corresponding MHD modes. The bursts of magnetic activities accompanied by accompanied by sudden runaway current drops observed in experiments (see Figs. 1 (a) and (b)) are probably related to the described phenomenon.
8 Summary
Based on the analysis of numerous experimental data obtained in the TEXTOR tokamak we have proposed a possible mechanism of the plasma disruption with the formation of RE beams. The plasma disruption starts due to a large–scale magnetic stochasticity caused by nonlinearly excited of MHD modes with low numbers (, ). The RE beam is formed in the central plasma region confined by the intact magnetic surface. Its location depends on the safety factor profile and the spectrum of MHD modes. In the cases of plasmas with the monotonic profile of and at the sufficiently small amplitude of the mode the most stable RE beams are formed by the intact magnetic surface located between the magnetic surface and the closest low–order rational surface . Depending on the spectrum of magnetic perturbations this rational magnetic surface could be one of these ones: , or .
Such an outermost intact magnetic surface forms the transport barrier for particles in the central plasma region. Electrons in this confined region are accelerated by the inductive toroidal electric field. Such a situation occurs, for instance, in plasma disruptions with runaway beams initiated by the Argon gas injection. Heavy Ar atoms do not penetrate sufficiently deep into the plasma and therefore they do not excite the mode with the amplitude necessary to create the fully chaotic magnetic field. On the other hand the injection of the lighter noble gases neon and helium does not generate runaways since the light gases penetrate deeper into the plasma and excite the large–amplitude () mode.
During disruptions of tokamak plasmas with the reversed magnetic shear RE beams can be formed in the central plasma region confined by the shearless magnetic surface. The latter cannot be broken even at the relatively large magnetic perturbations and it acts as a robust transport barrier to the parallel motion of particles along chaotic magnetic field lines. One expects that electrons confined by this intact magnetic surface form a relatively stable RE beam with a large transversal size. Experimental observations of RE beams with long confinement times during disruptions of plasma with the reversed magnetic shear in the TFTR tokamak (Fredrickson et al., 2015), probably, supports this expectation.
Based on this scenario we proposed the models of the pre-disruption and post–disruption plasmas with REs to study the processes of thermal and currents quenches, the runaway current losses. The model of magnetic field was proposed to describe the large–scale magnetic stochasticity due to interaction of low–mode–number MHD modes. The radial transport of heat and particles in a stochastic magnetic field are studied using the collisional diffusional models. It was shown that the temperature drop during the fast phase of disruption is caused by the radial heat transport determined by the collisional electron transport in a stochastic magnetic field. We have estimated a current decay time using the ambipolar collisional particle transport model. The dynamics of RE orbits in a post–disruption plasma in the presence of the inductive toroidal electric field is investigated by integrating the equations of guiding center motion. We analyzed the effect of the internal MHD mode and external RMPs on the topology of RE orbits.
The new model reproduces for the first time remarkably well the essential features of the measurements:
-
(a)
The outer part of the plasma is clearly ergodized while the inner section is still intact. This agrees with the observation that the runaways are only seen in the inner half of the torus while they are obviously quickly lost from the outer part.
-
(b)
one observes a short tiny spike during the energy quench; we have described this spike previously; this spike is attributed to the loss of runaways born at the start up of the discharge from the ergodic zone.
-
(c)
In the case of disruptions caused by injection of light He and Ne gases the energy quench is due to processes directly related to the penetration of neutral impurity into the plasma; if heavier argon is injected fast electron transport in stochastic magnetic field is of more importance. Stochastic motion of plasma particles is also responsible for the current decay; however due to the ambipolarity of particle losses the ion motion essentially affects the duration of the CQ stage. The estimations of the energy quench and the current decay times based on the models presented agree well with observations.
-
(d)
The slow decay of the RE current in the plateau phase is explained by the loss of runaways due to two effects: () an outward shift of the runaways due to their continuous acceleration and the subsequent loss at the wall; () by the formation of a stochastic layer of high–energy REs at the beam edge in the presence of the MHD mode.
-
(e)
The effect of the external resonant magnetic perturbations on low-energy electrons (up to 5-10 MeV) is weak and does not cause their loss.
The new mechanism explains well the observed disruptions in present day tokamaks. One can expect the following consequences, e.g., for ITER.
-
(1)
The structure of the stochastic zone during the TQ allows persistence of preexisting runaways through this phase such that they act as seeds during the following phase of high loop voltage.
-
(2)
The decay phase of the REs is rather long such that REs can acquire very high energy.
-
(3)
External magnetic perturbations acting on REs seems are little promising unless the core of a RE beam can be ergodized.
-
(4)
A means for eliminating the REs completely is the injection of about molecules H2 or D2 into the discharge (Hender et al., 2007). This massive gas injection may impose a heavy load on the cryo–pumping system.
Acknowledgments
The authors gratefully acknowledge valuable discussions with W. Biel, S. Brezinsek, O. Marchuk, Ph. Mertens, D. Reiser, D. Reiter, A. Rogister, and U. Samm. S.S.A. thanks to V. Igochine for consulting on the MHD mode structure in tokamaks. We also thank the anonymous referees for their constructive criticisms, comments, and valuable suggestions.
References
- Abdullaev (2006) Abdullaev, S. S. 2006 Construction of Mappings for Hamiltonian Systems and Their Applications. Heidelberg: Springer.
- Abdullaev (2013) Abdullaev, S. S. 2013 On collisional diffusion in a stochastic magnetic field. Phys. Plasmas 20, 082507.
- Abdullaev (2014) Abdullaev, S. S. 2014 Magnetic Stochasticity in Magnetically Confined Fusion Plasmas. Cham–Heidelberg: Springer-Verlag.
- Abdullaev (2015) Abdullaev, S. S. 2015 Drifts of electron orbits induced by toroidal electric field in tokamaks . Phys. Plasmas 22, 030702.
- Abdullaev et al. (1999) Abdullaev, S. S., Finken, K. H. & Spatschek, K. H. 1999 Asymptotical and mapping methods in study of ergodic divertor magnetic field in a toroidal system. Phys. Plasmas 6, 153–174.
- Abdullaev et al. (2015) Abdullaev, S. S., Finken, K. H., Wongrach, K., Tokar, M., Koslowski, H.R., Willi, O., Zheng, L. & the TEXTOR team 2015 Mechanism of runaway electron formation during plasma disruptions in tokamaks. Phys. Plasmas (submitted).
- Bakhtiari et al. (2002) Bakhtiari, M., Kawano, Y., Tamai, H., Miura, Y., Yoshino, R. & Nishida, Y. 2002 Fast plasma shutdown scenarios in the JT-60U tokamak using intense mixed gas puffing. Nucl. Fusion 42 (10), 1197–1204.
- Bakhtiari et al. (2005) Bakhtiari, M., Tamai, H., Kawano, Y., Kramer, G .J., Isayama, A., Nakano, T., Kamiya, Y., Yoshino, R., Miura, Y. & Nishida, Y. 2005 Study of plasma termination using high-Z noble gas puffing in the JT-60U tokamak. Nucl. Fusion 45 (10), 318–325.
- Bécoulet et al. (2013) Bécoulet, A., et al. 2013 Science and technology research and development in support to ITER and the Broader Approach at CEA. Nuclear Fusion 53 (10), 104023.
- Boozer (2012) Boozer, A. H. 2012 Theory of tokamak disruptions. Phys. Plasmas 19, 058101.
- Bozhenkov et al. (2007) Bozhenkov, S. A., Finken, K. H. & Lehnen, M. Wolf, R. C. 2007 Main characteristics of the fast disruption mitigation valve. Rev. Sci. Instrum. 78, 033503.
- Bozhenkov et al. (2011) Bozhenkov, S. A., Lehnen, M., Finken, K. H., Bertschinger, G., Koslowski, H.R., Reiter, D., R.C.Wolf & TEXTOR Team 2011 Fuelling efficiency of massive gas injection in TEXTOR: mass scaling and importance of gas flow dynamics. Nuclear Fusion 51, 083033.
- Bozhenkov et al. (2008) Bozhenkov, S. A., Lehnen, M., Finken, K. H., Jakubowski, M. W., Wolf, R. C., Jaspers, R., Kantor, M., Marchuk, O. V., Uzgel, E., VanWassenhove, G., Zimmermann, O., Reiter, D. & TEXTOR Team 2008 Generation and suppression of runaway electrons in disruption mitigation experiments in TEXTOR. Plasma Phys. Control. Fusion 50, 105007.
- Carreras et al. (1980) Carreras, B., Hicks, H. R., Holmes, J. A. & Waddell, B. V. 1980 Nonlinear coupling of tearing modes with self‐consistent resistivity evolution in tokamaks. Phys. Fluids 23 (9), 1811–1826.
- Chen et al. (2013) Chen, Z. Y., Kim, W.C., Yu, Y.W., England, A.C., Yoo, J.W., Hahn, S.H., Yoon, S.W., Lee, Y.K., Oh, Y. K., Kwak, J.G. & Kwon, M. 2013 Study of runaway current generation following disruptions in KSTAR. Plasma Phys. Control. Fusion 55, 035007 (6 pp).
- Commaux et al. (2011) Commaux, N., et al. 2011 Novel rapid shutdown strategies for runaway electron suppression in DIII-D. Nuclear Fusion 51 (10), 103001.
- Finken et al. (2005) Finken, K. H., Abdullaev, S. S., Jakubowski, M., Lehnen, M., Nicolai, A. & Spatschek, K. H. 2005 The structure of magnetic field in the TEXTOR-DED, Energy Technology, vol. 45. Jülich, Germany: Forschungszentrum Jülich.
- Finken et al. (2008) Finken, K. H., Lehnen, M. & Bozhenkov, S.A. 2008 Gas flow analysis of a disruption mitigation valve (DMV). Nucl. Fusion 48, 115001.
- Finken et al. (2011) Finken, K. H., Lehnen, M. & Bozhenkov, S.A. 2011 A new disruption mitigation valve (DMV) and gas flow in guiding tubes of different diameter. Nucl. Fusion 51, 033007.
- Forster et al. (2012) Forster, M., Finken, K.H., Kudyakov, T., Lehnen, M., Willi, O., Xu, Y., Zeng, L. & the TEXTOR team 2012 Temporal and spectral evolution of runaway electron bursts in TEXTOR disruptions. Phys. Plasmas 19, 092513.
- Fredrickson et al. (2015) Fredrickson, E.D., Bell, M.G., Taylor, G. & Medley, S.S. 2015 Control of disruption-generated runaway plasmas in TFTR. Nuclear Fusion 55 (1), 013006.
- Fukuyama et al. (1993) Fukuyama, A., Itoh, K., Itoh, S.I, Tsuji, S. & Lichtenberg, A.J. 1993 Stochasticity driven disruptive phenomena in tokamaks. In Proc. 14-th IAEA Int. Conf. on Plasma Physics and Controlled Nuclear Fusion Research; Würzburg (Germany); 30 Sep-7 Oct 1992, , vol. 2, pp. 363–370. Vienna: IAEA, IAEA-CN–56/D-4-21.
- Fülöp & Newton (2014) Fülöp, T. & Newton, S. 2014 Alfvénic instabilities driven by runaways in fusion plasmas. Phys. Plasmas 21 (8), 080702.
- Fülöp et al. (2009) Fülöp, T., Smith, H. M. & Pokol, G. 2009 Magnetic field threshold for runaway generation in tokamak disruptions. Phys. Plasmas 16, 022502.
- Gerasimov et al. (2014) Gerasimov, S. N., Hender, T.C., Morris, J., Riccardo, V., Zakharov, L.E. & JET EFDA Contributirs 2014 Plasma current asymmetries during disruptions in JET. Nucl. Fusion 54 (7), 073009.
- Gerhardt et al. (2009) Gerhardt, S. P., Menard, J. E. & the NSTX team 2009 Characterization of the plasma current quench during disruptions in the National Spherical Torus Experiment. Nucl. Fusion 49 (2), 025005.
- Gill (1993) Gill, R. D. 1993 Generation and loss of runaway electrons following disruptions in JET. Nucl. Fusion 33 (11), 1613–1625.
- Gill et al. (2002) Gill, R. D., Alper, B., de Baar, M., Hender, T. C., Johnson, M. F., Riccardo, V. & contributors to the EFDA-JET Workprogramme 2002 Behaviour of disruption generated runaways in JET. Nucl. Fusion 42, 1039–1046.
- Gill et al. (2000) Gill, R. D., Alper, B., Edwards, A. W., Ingesson, L. C., Johnson, M. F. & Ward, D. J. 2000 Direct observations of runaway electrons during disruptions in the JET tokamak. Nucl. Fusion 40 (2), 163–174.
- Granetz et al. (2007) Granetz, R. S., Hollmann, E. M., Whyte, D. G., Izzo, V. A., Antar, G. Y., Bader, A., Bakhtiari, M., Biewer, T., Boedo, J. A., Evans, T. E., Hutchinson, I. H. & Jernigan, T. C. 2007 Gas jet disruption mitigation studies on Alcator C-mod and DIII-D. Nucl. Fusion 47, 1086.
- Guan et al. (2010) Guan, X., Qin, H. & Fisch, N.J. 2010 Phase-space dynamics of runaway electrons in tokamaks. Phys. Plasmas 17 (9), 092502.
- Helander et al. (2000) Helander, P., Eriksson, L.-G. & Andersson, F. 2000 Supperssion of runaway electron avalanches by radial diffusion. Phys. Plasmas 7 (10), 4106–4111.
- Hender et al. (2007) Hender, T. C., et al. 2007 Progress in the ITER Physics Basis. Chapter 3: MHD stability, operational limits and disruptions. Nucl. Fusion 47, S128–S202.
- Hollmann et al. (2010) Hollmann, E.M., et al. 2010 Experiments in DIII-D toward achieving rapid shutdown with RE suppression. Phys. Plasmas 17 (5), 056117.
- Hollmann et al. (2013) Hollmann, E. M., et al. 2013 Control and dissipation of runaway electron beams created during rapid shutdown experiments in DIII-D. Nuclear Fusion 53 (8), 083004.
- Izzo et al. (2011) Izzo, V.A., Hollmann, E.M., James, A.N., Yu, J.H., Humphreys, D.A., Lao, L.L., Parks, P.B., Sieck, P.E., Wesley, J.C., Granetz, R.S., Olynyk, G.M. & Whyte, D.G. 2011 Runaway electron confinement modelling for rapid shutdown scenarios in DIII-D, Alcator C-Mod and ITER. Nuclear Fusion 51 (6), 063032.
- Izzo et al. (2012) Izzo, V. A., Humphreys, D. A. & Kornbluth, M. 2012 Analysis of shot-to-shot variability in post-disruption runaway electron currents for diverted DIII-D discharges. Plasma Phys. Control. Fusion 54 (9), 095002.
- Jakubowski et al. (2006) Jakubowski, M. W., Schmitz, O., Abdullaev, S. S., Brezinsek, S., Finken, K. H., Krämer-Flecken, A., Lehnen, M., Samm, U., Spatschek, K. H., Unterberg, B., Wolf, R. C. & the TEXTOR team 2006 Change of the magnetic-field topology by an ergodic divertor and the effect on the plasma structure and transport. Phys. Rev. Lett. 96, 035004.
- James et al. (2012) James, A.N., et al. 2012 Measurements of hard x-ray emission from runaway electrons in DIII-D. Nuclear Fusion 52 (1), 013007.
- Kadanoff (2004) Kadanoff, L. P. 2004 Excellence in computer simulation. Perspectives in Computational Science pp. 57–67.
- Kadomtsev (1984) Kadomtsev, B. B. Behavior of disruptions in tokamaks. Plasma Phys. Control. Fusion 26, 217–226.
- Kawano et al. (1997) Kawano, Y., Yoshino, R., Kondoh, T., Isei, N., Ishida, S., Tobita, K., Hatae, T., Itami, K., Sakasai, S. & the JT-60 team 1997 Suppression of runaways - electrons generation during disruptive discharge - termination in JT-60U. In Controlled Fusion and Plasma Physics. Proc. 24-th Eur. Conf. Berchtesgaden, 1997, , vol. 21A, pp. 501–504. Geneva: European Physical Society.
- Koltunov & Tokar (2011) Koltunov, M. & Tokar, M. Z. 2011 Modification of local plasma parameters by impurity injection. Plasma Physics and Controlled Fusion 53 (6), 065015.
- Koslowski et al. (1996) Koslowski, H. R., Soltwisch, H. & Stodiek, W. 1996 Polarimetric measurement of sawtooth precursor oscillations in the TEXTOR tokamak. Plasma Phys. Control. Fusion 38 (3), 271–278.
- Koslowski et al. (2014) Koslowski, H. R., Zeng, L., Lehnen, M., Lvovskiy, A., Wongrach, K. & TEXTOR Team 2014 Influence of massive gas injection and resonant magnetic perturbations on the generation of runaway electrons during disruptions in TEXTOR. In Proc. 41st EPS Conf. on Plasma Physics (Berlin, June 22-28, 2014). P5.028.
- Kruger et al. (2005) Kruger, S. E., Schnak, D. D. & Sovinec, C. R. 2005 Dynamics of the major disruption of a DIII-D plasma. Phys. Plasmas 12, 056113.
- Lehnen et al. (2009) Lehnen, M., Abdullaev, S. S., Arnoux, G., Bozhenkov, S. A, Jakubowski, M. W., Jaspers, R., Plyusnin, V. V., Riccardo, V., Samm, U., JET EFDA Contributors & the TEXTOR team 2009 Runaway generation during disruptions in JET and TEXTOR. J. Nucl. Mater. 390-391, 740–746.
- Lehnen et al. (2011) Lehnen, M., et al. 2011 Disruption mitigation by massive gas injection in JET. Nuclear Fusion 51 (12), 123010.
- Lehnen et al. (2008) Lehnen, M., Bozhenkov, S. A, Abdullaev, S. S., Jakubowski, M. W. & the TEXTOR team 2008 Suppression of runaway electrons by resonant magnetic perturbations in TEXTOR disruptions. Phys. Rev. Lett. 100, 255003.
- Levinton et al. (1995) Levinton, F. M., Zarnstorff, M. C., Batha, S. H., Bell, M., Bell, R. E., Budny, R. V., Bush, C., Chang, Z., Fredrickson, E., Janos, A., Manickam, J., Ramsey, A., Sabbagh, S. A., Schmidt, G. L., Synakowski, E. J. & Taylor, G. 1995 Improved Confinement with Reversed Magnetic Shear in TFTR. Phys. Rev. Lett. 75 (24), 4417–4420.
- Lichtenberg (1984) Lichtenberg, A. J. 1984 Stochasticity as the mechanism for the disruptive phase of the tokamak oscillations. Nuclear Fusion 24, 1277–1289.
- Olynyk et al. (2013) Olynyk, G.M., Granetz, R.S., Reinke, M.L., Whyte, D.G., Golfinopoulos, T., Hughes, J.W., Walk, J.R., Izzo, V.A., Combs, S.K., Milora, S.L. & Brookman, M.W. 2013 Rapid shutdown experiments with one and two gas jets on Alcator C-Mod. Nuclear Fusion 53 (9), 092001.
- O’Rourke (1991) O’Rourke J. 1991 The change in the safety factor profile at a sawtooth collapse. Plasma Phys. Control. Fusion 33, 289–296.
- Papp et al. (2011) Papp, G., Drevlak, M., Fülöp, T., Helander, P. & Pokol, G-I. 2011 Runaway electron losses caused by resonant magnetic perturbations in ITER. Plasma Phys. Control. Fusion 53, 095004.
- Papp et al. (2012) Papp, G., Drevlak, M., Fülöp, T. & Pokol, G-I. 2012 The effect of resonant magnetic perturbations on runaway electron transport in ITER. Plasma Phys. Control. Fusion 54, 125008 (10 pp).
- Papp et al. (2013) Papp, G., Fülöp, T., Fehér, T., de Vries, P.C., Riccardo, V., Reux, C., Lehnen, M., Kiptily, V., Plyusin, V. V., Alper, B. & JET-EFDA contributors 2013 The effect of ITER-like wall on runaway electron generation in JET. Nucl. Fusion 53, 123017.
- Pautasso et al. (2009) Pautasso, G., et al. 2009 Disruption studies in ASDEX Upgrade in view of ITER. Plasma Phys. Control. Fusion 51, 124056.
- Plyusnin et al. (2006) Plyusnin, V. V., et al. 2006 Study of runaway electron generation during major disruptions in JET. Nucl. Fusion 46, 277–284.
- Qin et al. (2011) Qin, H., Guan, X. & Fisch, N. J. 2011 Neoclassical drift of circulating orbits due to toroidal electric field in tokamaks. Tech. Rep. PPPL-4639. Princeton Plasma Physics Laboratory, Princeton.
- Reux et al. (2010) Reux, C., Bucalossi, J., Saint-Laurent, F., Gil, C., Moreau, P. & Maget, P. 2010 Experimental study of disruption mitigation using massive injection of noble gases on Tore Supra. Nuclear Fusion 50, 095006.
- Schüller (1995) Schüller, F.C. 1995 Disruptions in tokamaks. Plasma Phys. Control. Fusion 37, A135–A162.
- Shibata et al. (2010) Shibata, Y., Watanabe, K.Y., ans N. Ohno, M. Okamoto, Isayama, A., Kurihara, K., Nakano, T., Oyama, N., Kawano, Y., Matsunaga, G., Sakakibara, S., Sugihara, M., Kamada, Y. & the JT-60 team 2010 Study of current decay time during disruption in JT-60U tokamak. Nucl. Fusion 50, 025015.
- Soltwisch & Koslowski (1995) Soltwisch, H & Koslowski, H R 1995 Sawtooth modulation of the poloidal field in TEXTOR under ohmic heating conditions. Plasma Phys. Control. Fusion 37 (6), 667–678.
- Soltwisch & Koslowski (1997) Soltwisch, H & Koslowski, H R 1997 Observation of magnetic field perturbations during sawtooth activity in tokamak plasmas. Plasma Phys. Control. Fusion 39 (5A), A341–A349.
- Soltwisch & Stodiek (1987) Soltwisch, H. & Stodiek, W. 1987 In Proc. 29-th Annual Meeting of the APS Division of Plasma Physics. San Diego.
- Soltwisch et al. (1987) Soltwisch, H., Stodiek, W., Manickam, J. & Schlüter, J. 1987 Current density profiles in the TEXTOR tokamak. In Proc. 11-th IAEA Conf. on Plasma Physics and Controlled Fusion Research, Kyoto, 13–20 November, 1986, , vol. 1, pp. 263–273. Vienna: IAEA, IAEA-CN-47/A-V-1.
- Spizzo et al. (2014) Spizzo, G. et al. 2014 Edge ambipolar potential in toroidal fusion plasmas. Phys. Plasmas 21 (5), 056102 (11pp).
- Strait et al. (1995) Strait, E. J., Lao, L. L., Mauel, M. E., Rice, B. W., Taylor, T. S., Burrell, K. H., Chu, M. S., Lazarus, E. A., Osborne, T. H., Thompson, S. J. & Turnbull, A. D. 1995 Enhanced confinement and stability in DIII-D discharges with reversed magnetic shear. Phys. Rev. Lett. 75 (24), 4421–4424.
- Tokar & Koltunov (2013) Tokar, M. Z. & Koltunov, M. 2013 Modelling of the plasma global response to a local cooling. Plasma Physics and Controlled Fusion 55 (4), 045013.
- Tokuda & Yoshino (1999) Tokuda, S. & Yoshino, R. 1999 Simulation study on collisionless loss of runaway electrons by magnetic perturbations in a tokamak. Nucl. Fusion 39, 1123–1132.
- Wesson (2004) Wesson, J. 2004 Tokamaks, 3rd edn., Oxford: Clarendon Press.
- Wesson et al. (1989) Wesson, J.A., et al. 1989 Disruptions in JET. Nucl. Fusion 29 (4), 641–666.
- White (2014) White, R. B. 2014 The Theory of Toroidally Confined Plasmas, 3rd edn. London: Imperial College Press.
- Whyte et al. (2002) Whyte, D. G., Jernigan, T. C., Humphreys, D. A., Hyatt, A. W., Lasnier, C. J., Parks, P. B., Evans, T. E., Rosenbluth, M. N., Taylor, P. L., Kellman, A. G., Gray, D. S., Hollmann, E. M. & Combset, S. K. 2002 Mitigation of tokamak disruptions using high-pressure gas injection. Phys. Rev. Lett. 89 (5), 055001.
- Whyte et al. (2003) Whyte, D. G., Jernigan, T. C., Humphreys, D. A., Hyatt, A. W., Lasnier, C. J., Parks, P. B., Evans, T. E., Taylor, P. L., Kellman, A. G., Gray, D. S. & Hollmannet, E. M. 2003 Disruption mitigation with high-pressure noble gas injection. J. Nucl. Meter. 313-316, 1239.
- Wongrach et al. (2014) Wongrach, K., Finken, K.H., Abdullaev, S.S., Koslowski, R., Willi, O., Zeng, L. & the TEXTOR team 2014 Measurement of synchrotron radiation from runaway electrons during TEXTOR tokamak disruptions. Nucl. Fusion 54, 043011.
- Wongrach et al. (2015) Wongrach, K., Finken, K.H., Abdullaev, S.S., Koslowski, R., Willi, O., Xu, Y., Zeng, L. & the TEXTOR team 2015 Effects of runaway electrons during induced disruptions in the TEXTOR tokamak. Nucl. Fusion 55, [submitted].
- Yamada et al. (1994) Yamada, M., Livinton, F.M., Pomphrey, N., Budny, R., Manickam, J. & Nagayama, Y. 1994 Investigation of magnetic reconnection during a sawtooth crash in a high–temperature tokamak plasmas. Phys. Plasmas 1, 3269–3276.
- Yoshino & Tokuda (2000) Yoshino, R. & Tokuda, S. 2000 Runaway electrons in magnetic turbulence and runaway current termination in tokamak discharge. Nucl. Fusion 40 (7), 1293–1309.
- Zehrfeld et al. (1981) Zehrfeld, H.P., Fussmann, G. & Green, B. J. 1981 Electric field effects on relativistic charged particle motion in tokamaks. Plasma Phys. 23 (5), 473.
- Zeng et al. (2013) Zeng, L., Koslowski, H. R., Liang, Y., Lvovskiy, A., Lehnen, M., Nicolai, D., Pearson, J., Rack, M., Jaegers, H., Finken, K. H., Wongrach, K. & Xu, Y. 2013 Experimental observation of a magnetic-turbulence threshold for runaway generation in the TEXTOR tokamak. Phys. Rev. Lett. 110, 235003.