New Extinction and Mass Estimates from Optical Photometry of the Very Low Mass Brown Dwarf Companion CT Chamaeleontis B with the Magellan AO System***This paper includes data gathered with the 6.5 m Magellan Clay Telescope at Las Campanas Observatory, Chile.
Abstract
We used the Magellan adaptive optics (MagAO) system and its VisAO CCD camera to image the young low mass brown dwarf companion CT Chamaeleontis B for the first time at visible wavelengths. We detect it at , , , and . With our new photometry and K derived from the shape its band spectrum, we find that CT Cha B has mag, and a mass of according to the DUSTY evolutionary tracks and its Myr age. The overluminosity of our detection indicates that the companion has significant H emission and a mass accretion rate , similar to some substellar companions. Proper motion analysis shows that another point source within of CT Cha A is not physical. This paper demonstrates how visible wavelength AO photometry (, , , ) allows for a better estimate of extinction, luminosity, and mass accretion rate of young substellar companions.
graphicsx
1 INTRODUCTION
As more and more brown dwarfs and planetary companions are being discovered, characterizing them in the visible regime yields a more complete picture of the spectral energy distribution (SED) and more insight into physical properties as well as formation scenarios. For instance, a better estimate of extinction helps to derive bolometric luminosity and mass—especially for young objects ( Myr) which may still have primeval dust and gas around them and suffer significant obscuration. However, extinction is problematic to measure because most of the high-contrast adaptive optics (AO) observations are done in the near-infrared, which is times less sensitive to dust at versus . One simple treatment is to assume that the companion has the same amount of extinction as its host star (Patience et al., 2012), since in the early stages of star formation the binary might be embedded in a common envelope. For more evolved, fragmented systems both components may have their own disks, so this assumption might be invalid. Ideally one would like to acquire visible spectra or at least broad-band visible photometry to supplement near-IR measurements because visible wavelengths are a better probe for dust extinction. Yet high contrast optical observations on companions are very rare due to decreased contrast (Males et al., 2014) and the difficulty of correcting atmospheric turbulence at visible (defined here as m) wavelengths. We therefore need an advanced AO system which can work in the visible to suppress the halo.
Here we present the first optical AO photometry of CT Chamaeleontis system with the Magellan adaptive optics (MagAO) system, a powerful new 585-element AO system commissioned on the 6.5 m Clay Telescope (Close et al., 2013, 2014; Follette et al., 2013; Wu et al., 2013; Males et al., 2014). CT Cha A, a K7 classical T Tauri star (Weintraub, 1990; Gauvin & Strom, 1992), is located in the Chamaeleon I star-forming region. This region is close ( pc; Whittet et al. 1997; Bertout et al. 1999; Luhman 2008) and is as young (median age Myr; Luhman 2004) as the Taurus star-forming region and IC 348. It also has relatively low extinction (typical mag; Cambrsy et al. 1997), enabling clear view of young stars. The companion CT Cha B at 2.67″(430 AU) projected separation was discovered by Schmidt et al. (2008) in their VLT NACO survey. Based on its near-IR spectrum, the companion was estimated to be an M8-to-L0 ( K) low mass ( ) brown dwarf with mag. Schmidt et al. (2008) also imaged another closer object termed “cc2”, whose true nature has remained puzzling (Schmidt et al., 2009; Robberto et al., 2012). In this paper we present new visible AO observations providing a better measurement of and of the mass of CT Cha B. Our accurate astrometry allows us to determine that cc2 is, in fact, a background source.
2 OBSERVATIONS and REDUCTION
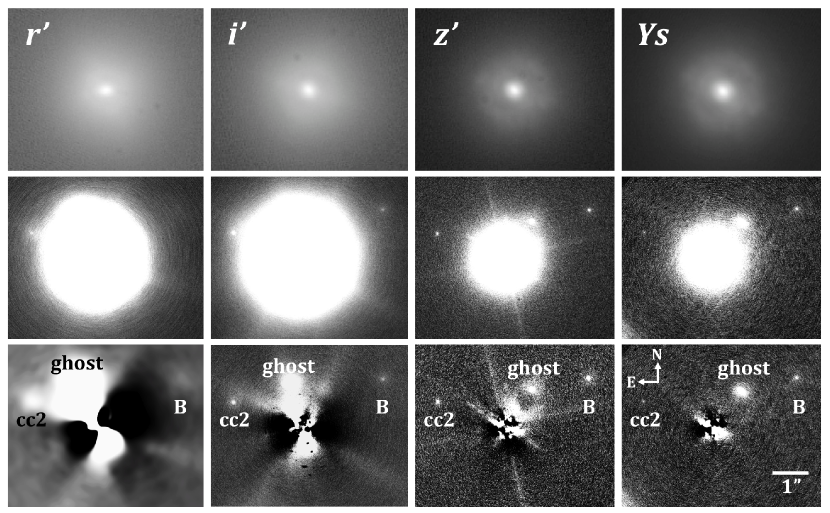
MagAO observations with its VisAO camera (Close et al., 2013; Males et al., 2014) at m), m), m), and m) were performed on 2013 April 6 (UT) during the second commissioning run. Seeing was stable, ranging from 0.6″to 0.8″. We locked the AO system on CT Cha A ( mag) at 100 modes and 625 Hz.§§§The faintness of this guide star prevented us from using all 378 modes at 1000 Hz which typically requires mag guide stars. The achieved FWHMs were 0.1″, 0.08″, 0.06″, 0.06″ for , , , , respectively. Strehl ratios were low due to only correcting 100 modes, since the guide star was somewhat faint for VisAO. We obtained saturated images to boost signal-to-noise ratio, with unsaturated datasets for relative photometry (top row in Figure 1). As a young accreting star, CT Cha A varies its brightness by mag in the near-IR and mag in the optical (Batalha et al., 1998; Ghez et al., 1997; Lawson et al., 1996). In order to calibrate the brightness of CT Cha A, we also obtained absolute photometry by observing the optical photometric standard star LTT 3864.
We carried out standard data reduction with IRAF tasks. After dark-subtraction, flat-field correction, and cross-correlation between frames, we rotated counterclockwise the saturated data by 89.11°+parallactic angle to make north up and east left (middle row in Figure 1). This was following the calibration of VisAO camera based on astrometry of the Trapezium cluster (Close et al., 2013). We further rotated each of these images by 20, 40, …, 340° and took the median of them to approximate the halo of the primary. Then we subtracted the halo from the original images to further bring out any faint point source object (bottom row in Figure 1) without any loss of flux from self-subtraction. Anisoplanatic effects are still small at this small separation (). Only our bluest filter showed some sign of anisoplanatism, so we smoothed the reduced image with a gaussian (width ) to enhance signal-to-noise ratio. Next we constructed a master PSF from unsaturated images of A, used it to fit CT Cha B profile in the deep images, and measured the PSF fitting flux with the DAOPHOT task. We note here that the on-axis CT Cha A PSF was still an excellent fit to the 2.7″ off-axis PSF of B. Table 1 summarizes our observations and PSF fitting photometry on CT Cha B. Uncertainties of B are mag for , , and , and mag for due to low S/N. Near-IR (, , ) photometry and the mag uncertainty were adopted from Schmidt et al. (2008).
To increase the accuracy of our astrometry, we also corrected for image distortion ( mas). The exact formulae to correct any residual distortions for separation from are listed in Close et al. (2013) and reproduced here: and , where and . We also retrieved archive HST and VLT NACO data for proper motion analysis. The HST data were already reduced by the OPUS pipeline and the MultiDrizzle software, as described in Robberto et al. (2012). We reduced NACO raw frames by shift-and-add, without flat-field correction and dark-subtraction. NACO image distortion is very small and only up to 3 mas at field edges (Neuhäuser et al., 2008). The error budget of our measurements includes platescale and centroid uncertainties. Table 2 lists our astrometric measurements.
3 RESULTS
3.1 Optical Images
Figure 1 shows the CT Cha system seen with our broad-band filters, with CT Cha B and cc2 visible in all four. This is the first optical detection of CT Cha B, as it was not detected in previous HST narrow-band optical observations (Robberto et al., 2012). Judging from its color, cc2 is relatively blue () so unlikely to be another low-mass companion. Robberto et al. (2012) also speculated that a faint “object” seen at [OI] to the south of CT Cha A could be real, but we cannot confirm any other faint object in our images, especially at where a narrow band [OI] or H source might have been visible. Thus, it is unlikely to be a real object.
3.2 Astrometry
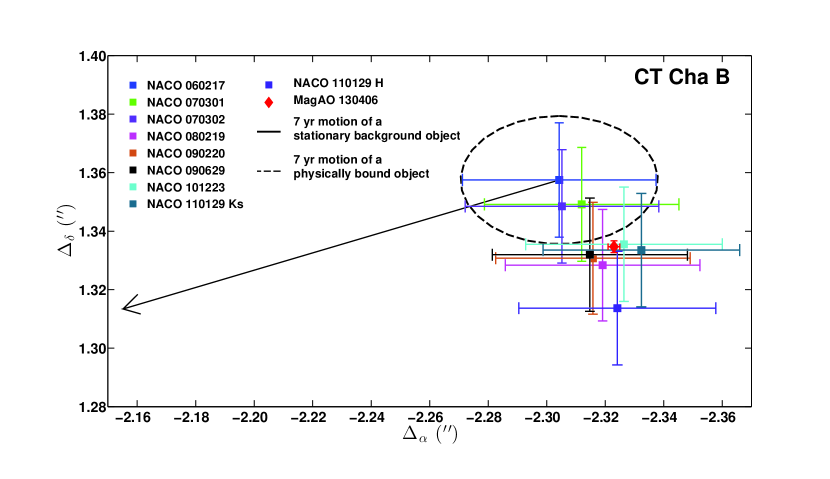
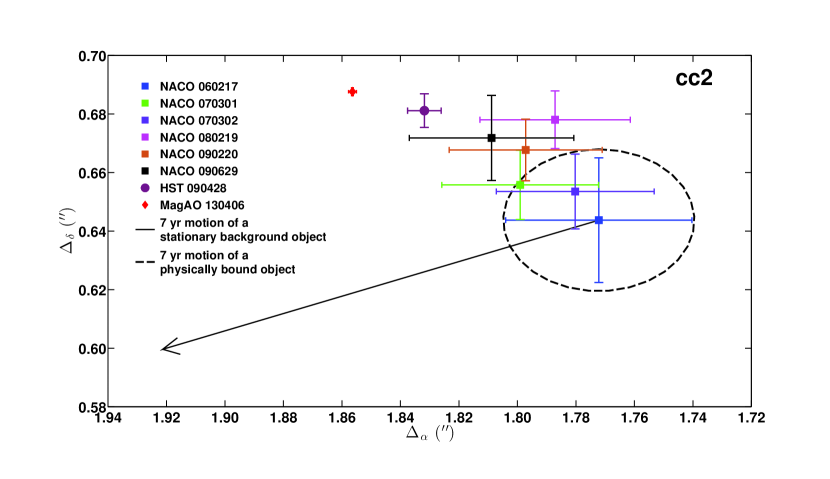
The nature of cc2 is not fully settled in literature. Schmidt et al. (2009) presented two-year astrometry, showing that it is likely to be a background star. But Robberto et al. (2012) suggested that cc2 may be physically associated based on their single epoch HST observations. We measured the positions of cc2 and CT Cha B in images taken by various instruments over year time span (Figure 2). Significant common-proper motion has been found for CT Cha B, confirming it is physically bound. However, we detected a significant non-common mas/yr northwestward motion for cc2, unambiguously demonstrating that it is not a co-moving companion but instead a background star, and not a member of Chamaeleon I.
3.3 SED Fitting and Derived Properties
3.3.1 Effective Temperature
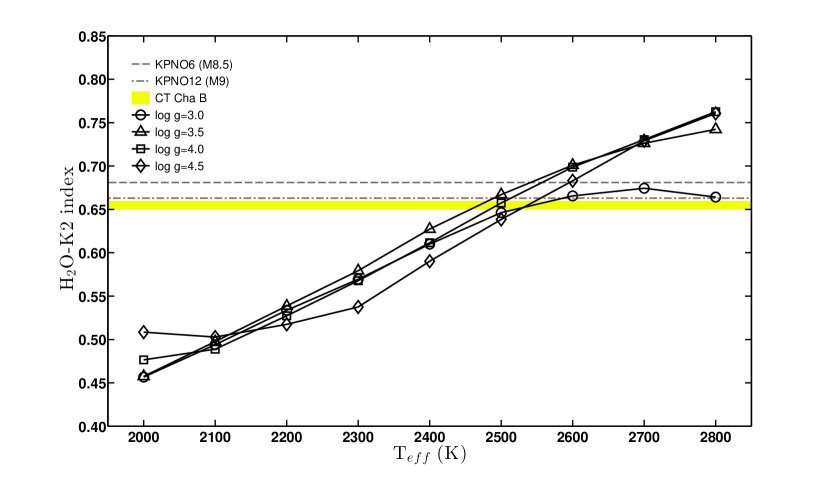
To further narrow down the uncertainty of , we retrieved the spectrum taken with the VLT SINFONI spectrograph (Schmidt et al., 2008), and calculated the O-K2 index following the prescription of Rojas-Ayala et al. (2012). Assuming solar metallicity, we found that for CT Cha B this index is almost independent of extinction, ranging from 0.65 to 0.66 for to 5.5 mag. In Figure 3, we plotted the variation of the index with a range of surface gravity for K BT-Settl atmospheric models (Allard et al., 2011). Within this temperature range, O-K2 index is rather insensitive to log . Hence we are free to use it for young cool objects like CT Cha B. Our best fit to the index corresponds to a spectral type M with K.
3.3.2 Extinction, Bolometric Luminosity, and Mass
CT Cha B was previously estimated from near-IR spectroscopy to have an extinction higher than its host star (5.2 mag versus 1.3 mag; Schmidt et al. 2008). Our data benefit from the fact that visible wavelengths are more sensitive to dust extinction, so we can determine at higher precision with MagAO’s VisAO camera.
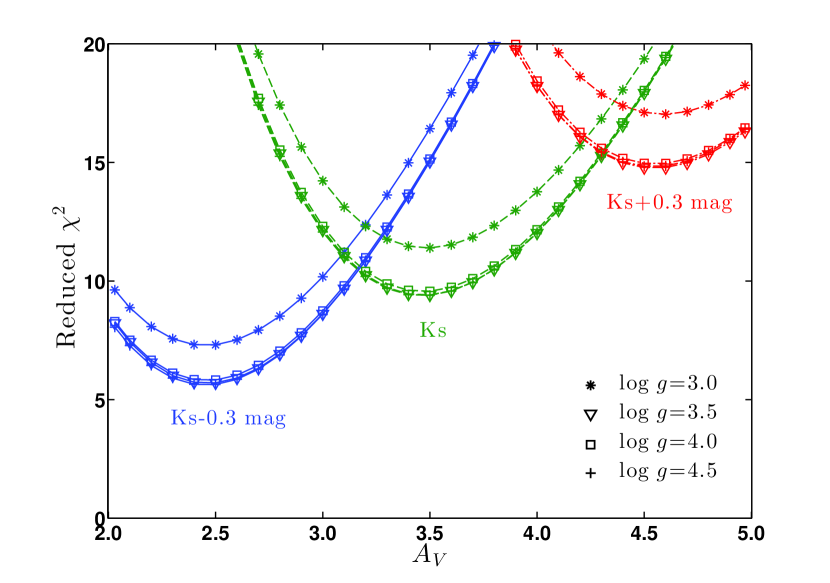
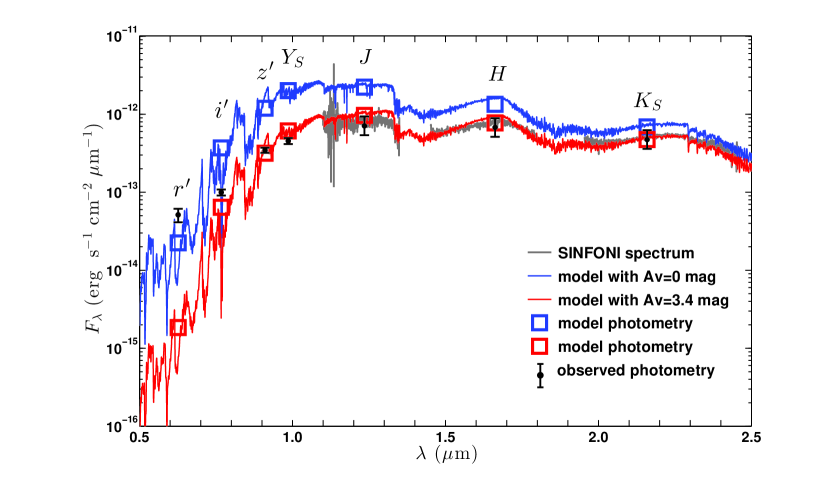
We applied multiple values of following the extinction law in Fitzpatrick (1999) to redden the 2500 K BT-Settl synthetic spectra normalized at (Figure 4). Minimization of the reduced is based on the reddened models fit to the observed , , , , and photometry (black points in Figure 5). We found that while the result is independent of surface gravity, remains high even after including the mag uncertainty at . Some systematic errors may come into play. For example, the adopted extinction law might be invalid due to grain growth in the disk, or there could be multiple dust components. On the other hand, scattered light from the disk or outflow gas may contribute to our photometry, as in the case of R Mon (Close et al., 1997). In this picture, blue light follows indirect paths to the observer, avoiding passing through the disk and making our extinction estimate likely a lower limit. Another possible cause for higher is that an overall offset mag might exist between the visible and near-IR data because they were taken on different nights and CT Cha A is a well-known variable. Finally, the companion itself could also be variable in the visible just like the primary due to accretion. In any case, with no prior knowledge of the material around CT Cha B, our current data yield a best fit to a lower extinction mag. We plotted the reddened synthetic spectrum together with the observed photometry in Figure 5.
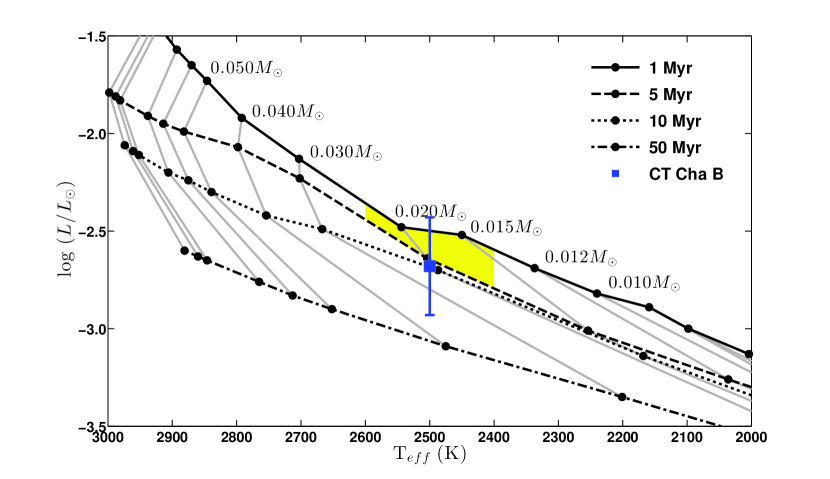
We followed the approach in Hillenbrand (1997) to calculate the bolometric luminosity. We converted our photometry to Cousins , de-reddened it by mag, applied the bolometric correction from Tinney et al. (1993) and Bessell (1995), and obtained log. As a comparison, we also calculated from the flux following Close et al. (2007) and had a similar value log. Both values are consistent with log in Schmidt et al. (2008). We also calculated CT Cha B’s radius using and obtained . Then we applied the DUSTY evolutionary tracks (Chabrier et al., 2000; Baraffe et al., 2001) to derive a mass estimate of based on the Myr age and (Figure 6). Therefore, CT Cha B is most likely a very low mass brown dwarf, just above the planetary mass limit.
3.3.3 Accretion Rate
Pa emission, an accretion signature, has been seen in CT Cha B’s band spectrum (Schmidt et al., 2008). Since CT Cha B is widely separated from the host star, it may harbor its own disk and still be actively accreting at this time. Figure 5 shows that our detection is about 20 times brighter than its predicted continuum. This significant excess seems to imply strong H emission from accretion, allowing us to calculate the mass accretion rate. Attributing of the flux to H and following the prescription of Close et al. (2014), we estimated , which is reasonable as it implies that a few of brown dwarf mass could be accreted in a few million years at the end of the gas-rich disk phase. The accretion rate we derived is also consistent with recent HST observations by Zhou et al. (2014), who measured for three substellar companions GSC 6214-210 B, GQ Lup B, and DH Tau b based on their optical excess.
3.4 Implications
The different extinction between the primary and the secondary may imply that both objects have their own disks likely with different inclination angles, resembling conceptually the configuration of HK Tau A and B (Jensen & Akeson, 2014). CT Cha B’s excess, together with other accreting objects in Zhou et al. (2014), suggest that accretion disks could be common among young low-mass companions and favor the “star-like” formation via gravitational collapse and fragmentation of molecular clouds. The survival of these significant disks also implies that substellar companions form near their current locations rather than being ejected there (Kraus et al., 2014). Strategic H surveys such as MagAO’s ongoing Giant Accreting Proto-planets Survey (GAPplanetS) may have the potential to probe accreting giant planets and shed light on the earliest stage of planet formation (Close et al., 2014).
4 Summary
MagAO observations on CT Cha at , , , and have improved the accuracy of the extinction towards CT Cha B. The companion is detected in all of our optical filters, whereas no detections were made by HST. It is over-luminous at , indicating active accretion at a rate of . The O-K2 index derived from the spectrum is consistent with a K brown dwarf. Using the BT-Settl model, we show that CT Cha B is best fit by mag, which is lower than previous estimate and translates to a mass estimate of based on the DUSTY tracks. We do not see the faint southern [OI] source seen in previous HST observations, so it is unlikely to be real. Finally, our astrometry on cc2 is incompatible with a previous claim that it is a co-moving object.
References
- Allard et al. (2011) Allard, F., Homeier, D., & Freytag, B. 2011, in ASP Conf. Ser. 448, 16th Cambridge Workshop on Cool Stars, Stellar Systems, and the Sun, ed. C. Johns-Krull, M. K. Browning, & A. A. West (San Francisco, CA: ASP), 91
- Baraffe et al. (2001) Baraffe, I., Chabrier, G., Allard, F., & Hauschildt, P. 2001, A&A, 382, 563
- Batalha et al. (1998) Batalha, C. C., Quast, G. R., Torres, C. A. O., et al. 1998, A&AS, 128, 561
- Bertout et al. (1999) Bertout, C., Robichon, N., & Arenou, F. 1999, A&A, 352, 574
- Bessell (1995) Bessell, M. S. 1995, in Proc. ESO, The Bottom of the Main Sequence–and Beyond, ed. C. G. Tinney (Berlin: Springer), 123
- Cambrsy et al. (1997) Cambrsy, L., Epchtein, N., Copet, E., D., et al. 1997, A&A, 324, L5
- Chabrier et al. (2000) Chabrier, G., Baraffe, I., Allard, F., & Hauschildt, P. 2000, ApJ, 542, 464
- Close et al. (1997) Close, L. M., Roddier, F., Hora, J. L., et al. 1997, ApJ, 489, 210
- Close et al. (2007) Close, L. M., Thatte, N., Nielsen, E. L., et al. 2007, ApJ, 665, 736
- Close et al. (2013) Close, L. M., Males, J. R., Morzinski, K., et al. 2013, ApJ, 774, 94
- Close et al. (2014) Close, L. M., Follette, K. B., Males, J. R., et al. 2014, ApJL, 781, L30
- Fitzpatrick (1999) Fitzpatrick, E. L. 1999, PASP, 111, 63
- Follette et al. (2013) Follette, K., Close, L. M., Males, J. R., et al. 2013, ApJL, 775, L13
- Gauvin & Strom (1992) Gauvin, L. S., & Strom, K. M. 1992, ApJ, 385, 217
- Ghez et al. (1997) Ghez, A. M., McCarthy, D. W., Patience, J. L., & Beck, T. L. 1997, ApJ, 481, 378
- Hillenbrand (1997) Hillenbrand, L. A. 1997, AJ, 113, 1733
- Jensen & Akeson (2014) Jensen, E. L. N., & Akeson R. 2014, Nature, 511, 567
- Kraus et al. (2014) Kraus, A. L., Ireland, M. J., Cieza, L. A., et al. 2014, ApJ, 781, 20
- Lawson et al. (1996) Lawson, W. A., Feigelson, E. D., & Huenemoerder, D. P. 1996, MNRAS, 280, 1071
- Luhman (2004) Luhman, K. L. 2004, ApJ, 602, 816
- Luhman (2008) Luhman, K. L. 2008, Handbook of Star Forming Regions, II, The Southern Sky, ed. B. Reipurth, 169
- Males et al. (2014) Males, J. R., Close, L. M., Morzinski, K., et al. 2014, ApJ, 786, 32
- Muench et al. (2007) Muench, A. A., Lada, C. J., Luhman, K. L., Muzerolle, J., & Young, E. 2007, AJ, 134, 411
- Neuhäuser et al. (2008) Neuhäuser, R., Mugrauer, M., Seifahrt, A., Schmidt, T. O. B., & Vogt, N. 2008, A&A, 484, 281
- Patience et al. (2012) Patience, J., King, R. R., Rosa, R. J. D., et al. 2012, A&A, 540, A85
- Robberto et al. (2012) Robberto, M., Spina, L., Da Rio, N., et al. 2012, AJ, 144, 83
- Rojas-Ayala et al. (2012) Rojas-Ayala, B., Covey, K. R., Muirhead, P. S., & Lloyd, J. P. 2012, ApJ, 748, 93
- Schmidt et al. (2008) Schmidt, T. O. B., Neuhäuser, R., Seifahrt, A., et al. 2008, A&A, 491, 311
- Schmidt et al. (2009) Schmidt, T. O. B., Neuhäuser, R., Mugrauer, M., Bedaloy, A., & Vogt, N., 2009, AIP Conf. Proc., 1094, 852
- Tinney et al. (1993) Tinney, C. G., Mould, J. R., & Reid, I. N. 1993, AJ, 105, 1045
- Weintraub (1990) Weintraub, D. A. 1990, ApJS, 74, 575
- Whittet et al. (1997) Whittet, D. C. B., Prusti, T., Franco, G. A. P., et al. 1997, A&A, 327, 1194
- Wu et al. (2013) Wu, Y.-L., Close, L. M., Males, J. R., et al. 2013, ApJ, 774, 45
- Zhou et al. (2014) Zhou, Y., Herczeg, G. J., Kraus, A. L., Metchev, S., & Cruz, K. L., 2014, ApJ, 783, L17
| Filter | aaRelative to CT Cha A, measured with PSF fitting photometry. | bbCalibrated with the standard LTT 3864 taken at a similar air mass to CT Cha in photometric conditions (errors are due to different air masses from model atmosphere). We used photometry calibrations of Close et al. (2013) and Males et al. (2014). | ||||
|---|---|---|---|---|---|---|
| (s) | (s) | (mag) | (mag) | ( erg ) | ||
| 9.80 | ||||||
| 9.22 | ||||||
| 7.96 | ||||||
| … | 7.59 |
| Filter | Plate Scale (″/pixel) | Name | Separation (″) | P.A. (°) |
|---|---|---|---|---|
| B | ||||
| cc2 | ||||
| B | ||||
| cc2 | ||||
| B | ||||
| cc2 | ||||
| B | ||||
| cc2 |
 |
 |