The Infrared Jet in 3C 31
Abstract
We report the detection of infrared emission from the jet of the nearby FR I radio galaxy 3C 31. The jet was detected with the IRAC instrument on Spitzer at 4.5 m, 5.8 m, and 8.0 m out to 30 (13 kpc) from the nucleus. We measure radio, infrared, optical, and X-ray fluxes in three regions along the jet determined by the infrared and X-ray morphology. Radio through X-ray spectra in these regions demonstrate that the emission can be interpreted as synchrotron emission from a broken power-law distribution of electron energies. We find significant differences in the high energy spectra with increasing distance from the nucleus. Specifically, the high energy slope increases from 0.86 to 1.72 from 1 kpc to 12 kpc along the jet, and the spectral break likewise increases in frequency along the jet from 10-100’s of GHz to 20 THz. Thus the ratio of IR to X-ray flux in the jet increases by at least an order of magnitude with increasing distance from the nucleus. We argue that these changes cannot simply be the result of spectral aging and that there is ongoing particle acceleration through this region of the jet. The effects of mass loading, turbulence, and jet deceleration, however these processes modify the jet flow in detail, must be causing a change in the electron energy distribution and the efficiency of particle acceleration.
Subject headings:
galaxies: individual(NGC 383)— galaxies: active — galaxies: jet — infrared: galaxies1. Introduction
Extended radio emission in galaxies is the observable manifestation of powerful, collimated outflows from supermassive black holes. Only 10% of active galaxies are radio loud and contain well-formed jets, but in all but the most luminous systems, the mechanical power of the jets generally dwarfs any radiative losses from an accretion disk (Bîrzan et al. 2004). It is now well established that jets play an important role in feedback between the central supermassive black hole (SMBH) and its larger scale environment. However, in spite of several decades of research, both observational and theoretical, basic issues related to jet physics, including particle content, velocity structure, the role of magnetic fields, and a host of other problems, remain unresolved. Extragalactic jets in low-power Fanaroff-Riley type I (FR I) sources are generally only observable at frequencies above the radio band via the synchrotron radiation from ultra-relativistic particles accelerated at shocks or other disturbances in the flow, although at X-ray energies, inverse Compton emission can sometimes be important. The significant numbers of detections of FR I jets in the IR, optical, and X-ray regimes has given us new insights into jet dynamics and particle acceleration (see e.g. Worrall 2009, for a review).
The radio, optical, and X-ray emission from FR I jets can normally be modeled as synchrotron emission from a single electron energy distribution described by a broken power law. Electrons emitting synchrotron radiation have lifetimes that vary inversely with their energy, so multi-wavelength observations are expected to show that higher-energy electrons are concentrated closer to the sites of particle acceleration than their lower-energy counterparts. In typical equipartition magnetic fields of FR I radio galaxies, the lifetimes of IR/optical and X-ray emitting particles are 104 and 102 yrs, respectively (e.g. Worrall 2009). Light travel times for kiloparsec jets demonstrate that the ultra-relativistic particles must be accelerated in situ. Proposed acceleration mechanisms include magnetohydrodynamic turbulence and shock acceleration, among others (e.g. Worrall 2009).
3C 31 is a nearby twin-jet radio source hosted within the early-type galaxy NGC 383, the dominant member of a small group of galaxies that also includes the nearby companion NGC 382. At a redshift of 0.0168 (=72.9 Mpc) (de Vaucouleurs et al. 1991)111We adopt a cosmology with km s-1 Mpc-1, , and , resulting in a linear projected scale of kpc per arcsec at the source. We deproject distances assuming the jet is 52∘ from the line of sight (Laing & Bridle 2002b)., 3C 31 was one of the earliest FR I galaxies to be studied in depth in the radio (Burch 1977, Fomalont et al. 1980) and remains a canonical example of this class. The twin jets are aligned roughly along a north-south axis. The northern jet is significantly brighter at GHz frequencies in the central 10 kpc (Lara et al. 1997), suggesting, that in this regime at least, the flow is moderately relativistic and this jet is oriented towards us (Laing et al. 2008). The northern jet is straight and narrow within 45′′ (19 kpc) of the nucleus, but beyond this distance, flares dramatically suggesting that it is losing kinetic energy (Burch 1977). On larger scales, both the forward and reverse jets extend at least 20 (500 kpc) from the nucleus (Laing et al. 2008). The radio morphology of the jet becomes wavy and diffuse at these distances. Subsonic motions of the external medium are probably important in determining the large scale radio morphology of the jet (e.g. Loken et al. 1995). The inner 8.5 kpc of the northern jet has been detected in the optical (Croston et al. 2003, Butcher et al. 1980), and the inner 2.7 kpc in the X-ray (Hardcastle et al. 2002). It has also previously been detected at lower spatial resolution in the infrared (Tansley 1997). Hardcastle et al. (2002) modeled the jet emission as synchrotron radiation from a population of ultra-relativistic electrons.
The relatively regular two-sided nature of 3C 31 in radio has permitted detailed kinematic modeling of the jets. In particular, Laing and Bridle (2002a, 2002b, 2004) created a 2-dimensional model of the jet flow to determine the velocity profile as a function of distance down the jet axis. Laing and Bridle (2002a, 2004) extended their work to include dynamical modeling by incorporating the pressure of the exterior gas as a function of distance based on X-ray measurements. They divided the inner jet into three regions: an inner region (extending to (1.1 kpc)) wherein the jet expands as a cone with a half-opening angle of , a flaring region (; 1.1 - 3.6 kpc) with gradually larger opening angle, and an outer region (; 3.6 - 12.2 kpc) wherein the jet once more expands conically, but with a half-opening angle of . They found that these regions have distinct kinematic properties and that the jet deceleration is consistent with the entrainment of gas from the X-ray emitting medium.
In this paper, we present a detection of infrared emission from the jet of 3C 31 as imaged by the Spitzer Space Telescope Infrared Array Camera (IRAC). Spitzer has detected infrared jets in a few nearby galaxies, including M87 (Shi et al. 2007, Forman et al. 2007) and Cen A (NGC 5128) (Hardcastle et al. 2006, Brookes et al. 2006). We discuss 3C 31’s inner jet morphology in the infrared, X-ray, and radio. We measure jet IR flux densities in the IRAC and MIPS bands in the flaring and outer regions defined by Laing & Bridle (2002a). We use the resulting energy distribution for each region to constrain particle acceleration in the jet. Images have North to the top and East to the left, angles are given counterclockwise from North, and spectral indices are defined such that flux density at frequency . We use the angle to the line of sight for the jet determined by Laing & Bridle (2002b) (hereafter L02) to give linear distances as deprojected distances.
2. Observations and Data Reduction
2.1. Spitzer Data
IRAC (Fazio et al. 2004) observations of 3C 31 were obtained on 2006 February 15 and 22 (Spitzer PID 3418) at 3.6 m, 4.5 m, 5.8 m, and 8.0 m. Each observation consisted of 24 frames of 30 s integrations covering the galaxy and the nearby field obtained using a medium cycling dither. For our analysis, we retrieved the Basic Calibrated Data (BCD) version S14.0 pipeline products from the Spitzer archive. For the 8.0 m observation, light scattered from the galaxy nucleus along the detector-array rows was fit and subtracted from the BCD frames using custom software as in Ashby et al. (2009). We then coadded the 30 s BCD frames using version 4.1.2 of IRACproc (Schuster et al. 2006) into mosaics having 12 pixels, i.e., the native IRAC pixel size. A region centered on the galaxy was selected for analysis in each IRAC mosaic.
To detect and determine the jet’s infrared morphology, we needed to
subtract the bright infrared stellar emission. We modeled the stellar emission
using the 3.6 m emission, as has been done for other galaxies
(e.g. Pahre et al. 2004, Tang et al. 2009). After subtracting a constant background
determined in the frames far from NGC 383 and NGC 382, we used GALFIT
(Peng et al. 2002) to fit the ellipticity and position angle of the galaxy.
The 3.6 m image was scaled to correct for differing instrumental parameters
between the different IRAC bands, specifically different aperture correction
factors for an infinite aperture and the different photometric
zeropoints222IRAC Instrument Handbook Tables 4.1 and 4.7:
http://ssc.spitzer.caltech.edu/irac/iracinstrumenthandbook/.
We then performed photometry using elliptical annuli on the 4.5 m, 5.8 m, and
8.0 m background-subtracted images and the associated scaled 3.6 m images.
We measured the flux in each annulus and used these to calculate the colors
between 3.6 m and each of the longer IRAC bands in each annulus, resulting
in color profiles for NGC 383. We fit these profiles in the annuli from
to centered on the nucleus. When extrapolated to the galaxy core,
the fits were used to color-correct the scaled 3.6 m images to be the
stellar models at 4.5 m, 5.8 m, and 8.0 m. This method does not take into account
differences in colors due to central features, so we expect that some residual
emission may be present from either the AGN or the dust disk described by Martel et al. (2000).
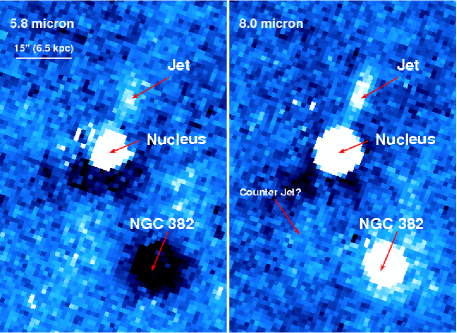
We detected nonstellar jet emission in the 4.5 m, 5.8 m, and 8.0 m bands, after
the stellar model was subtracted. The residual images at 5.8 m and 8.0 m are shown
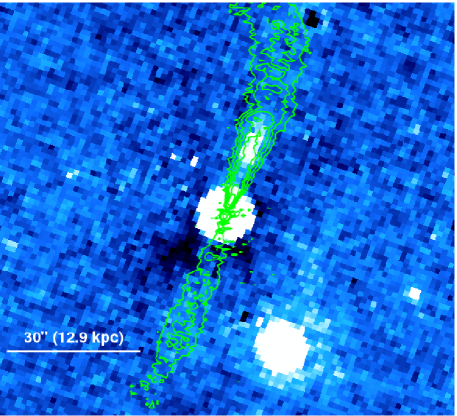
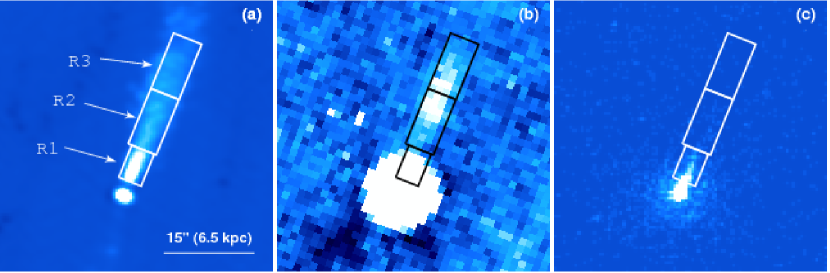
in Figure 1. The 8.0 m image is also shown in Figure 2
with contours of radio emission in order to localize the infrared emission within the
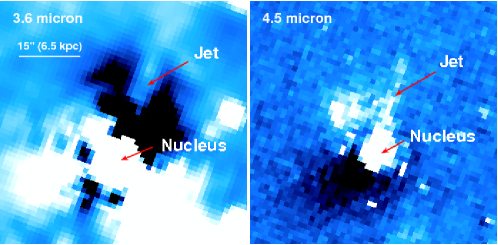
larger radio jet. Figure 3 shows the 4.5 m residual image along with
a 3.6 m image, where an azimuthally smoothed version of that image has been subtracted
in order to detect the jet. While the jet is less clearly present at 4.5 m than in the two longer
IRAC bands, these residual images in the two shorter IRAC bands contain emission
at the location of the jet. The technique used to subtract the stellar emission of
NGC 383 results in different residuals for NGC 382, but does not impact our study of the jet. We also modeled the stellar emission using
2MASS K-band emission. Finally, we used the IRAF ELLIPSE package
to model the galaxy emission (Bliss et al., in preparation). The resulting nonstellar
images show similar morphology to those in Figures 1-3.
We also obtained a mosaic at 24 m taken with the MIPS instrument (Rieke et al. 2004) on 2004 December 26 (Spitzer PID 82). We used GALFIT to fit the emission with a galaxy model along with two point sources for the nuclear emission of 3C 31 and for the companion galaxy NGC 382.
2.2. Chandra, GALEX, Hubble, 2MASS, and VLA Data
3C 31 was observed for 44.41 ks on 2000 November 6 (ObsID 2147) with the Chandra Advanced CCD Imaging Spectrometer (ACIS; Weisskopf et al. 2000). This observation was previously analyzed by Hardcastle et al. (2002). GALEX observed 3C 31 on 2006 November 9 (AIS 42) for 109 seconds in both the NUV and FUV filter (Martin et al. 2005). We obtained the intensity maps in these filters from the Multimission Archive at STScI (MAST). We retrieved mosaics of 3C 31 taken by the Wide Field Planetary Camera 2 (WFPC2) (Holtzman et al. 1995) on the Hubble Space Telescope (HST) from the Hubble Legacy archives. 3C 31 was observed through the F555W and F814W filters on the PC1 chip for 460 seconds each on 1998 September 23 and through the FR680N filter on the WF2 chip for 600 seconds on 1995 September 01. 2MASS All-Sky Survey Atlas images through all three filters were obtained from the NASA/IPAC Infrared Science Archive (IRSA)333 http://irsa.ipac.caltech.edu/applications/2MASS/IM/. The data we use here are observations for 6.5 hrs at 8.4 GHz on 1994 June 14 in the B configuration and for 25.5 minutes at 1.4 GHz on 1999 July 18 in the A configuration. We used the Astronomical Image Processing System (AIPS; version 31DEC09) to generate maps with beam sizes of at 8.4 GHz and at 1.4 GHz.
3. Results
3.1. Jet Morphology

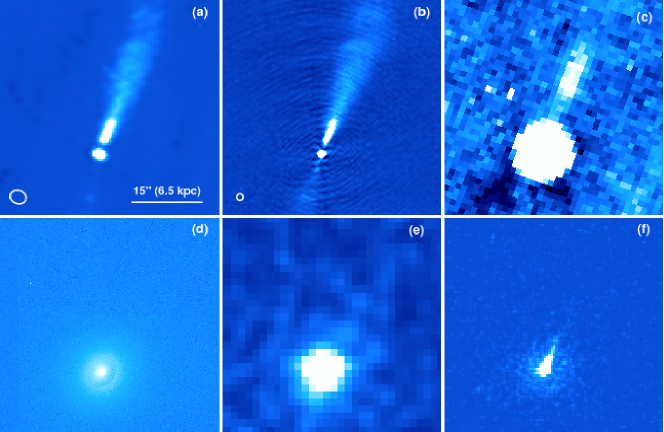
The infrared jet emission detected at 5.8 m and 8.0 m is shown in Figure 1. The jet and nucleus are identified with red arrows. The northern jet is detected from 8 (3.5 kpc) to 24 (10.3 kpc), with a position angle of . The X-ray emission from the northern radio jet has previously been described by Hardcastle et al. (2002). It extends approximately 8 (3.5 kpc) from the nucleus. We have a 3.5 detection of X-ray emission from 8 (3.5 kpc) to 15 (6.5 kpc). Burch (1977) mapped 3C 31 at 5 radio frequencies between 0.4 GHz and 15 GHz. More recently, Laing et al. (2008) obtained high resolution VLA images from 1365-8440 MHz. An infrared image of the jet with 8.4 GHz contours of the inner radio emission is shown in Figure 2. The radio emission shows a pair of jets, whose width increases with distance from the nucleus. The northern jet is brighter than the southern jet by about an order of magnitude between (1.1-2.6 kpc) and remains straight for 45 before gently bending to the north, while the southern jet extends before exhibiting a strong bend. The jet is not detected in the Hubble or GALEX observations. Croston et al. (2003) detected jet emission using the 4 m Mayall Telescope in the B and R bands. Images of the jet emission in the radio, IR, and X-ray, as well as the corresponding region in the optical (with HST) and UV (with GALEX), are shown in Figure 4.
To quantify the significance of the detection of the northern jet in the infrared, we measured the azimuthal surface brightness profile in an elliptical annular sector with an ellipticity of 0.87 and with inner and outer semi-major axes of 12 (5.2 kpc) and 20 (8.6 kpc), where the peak of the infrared jet emission is located based on the residual images shown in Figure 1. The total 8.0 m surface brightness in this annulus is shown in Figure 5. The statistically significant surface brightness enhancement between 330∘ and 350∘ is due to the northern jet emission.
In contrast to the northern jet, the counterjet is only marginally detected in the two longest wavelength IRAC bands. Faint IR emission is noted in the Spitzer image shown in Figure 2, but the statistical significance of this emission is low (less than 3). The point estimate of the flux density of the counterjet is sensitive to the details of the model used to subtract the stellar emission, but the statistical significance of the detection is insensitive to the stellar model. We measured the flux in the IRAC bands in a (4.3 kpc2.2 kpc) aperture beginning 15 from the nucleus centered in the radio contours. We find flux densities with 1 uncertainties of Jy at 5.8 m and Jy at 8.0 m. In comparison, the forward jet flux density at the same distance from the nucleus is significantly greater at Jy at 5.8 m and Jy at 8.0 m.
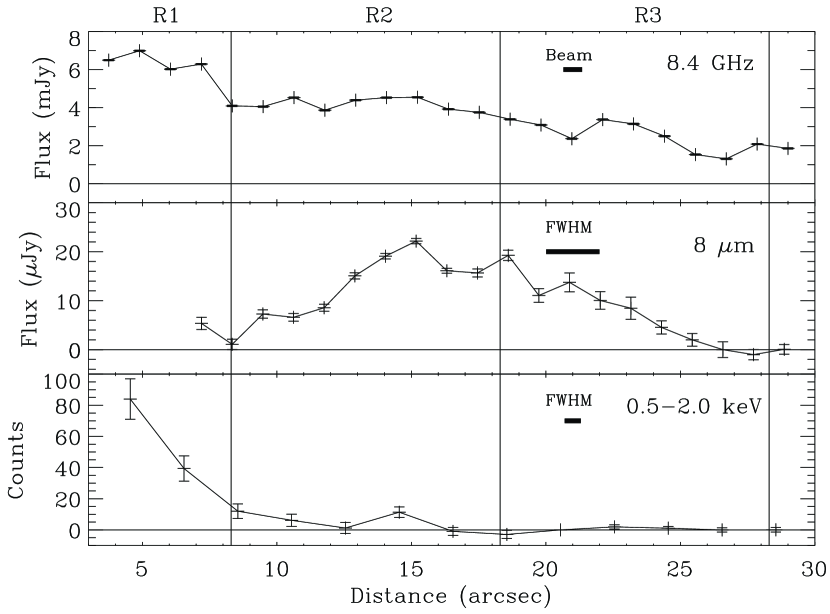
Figure 6 shows the longitudinal profile of the northern jet emission at 8.4 GHz, 8.0 m, and in the soft X-ray band (0.5-2.0 keV). In measuring the X-ray profile, we removed the emission from the ambient hot gas by subtracting a profile in similar rectangles adjacent to the jet. We do not try to deconvolve the Spitzer emission within of the nucleus, which contains the dusty disk seen in the optical by Martel et al. (2000), as well as stellar emission and an unresolved point source. The profiles in Figure 6 were measured in rectangles 4 wide and either 1 (IR and radio) or 2 (X-ray) long along the jet axis. The different bands have different beam sizes, which results in an oversampled profile for the Spitzer 8.0 m band. We binned the data in fewer regions in the X-ray band to emphasize the appearance of this emission. The 8.0 m profile shows that the infrared jet is brightest between 12 (5.2 kpc) and 20 (8.6 kpc) from the nucleus. Croston et al. (2003) measured the longitudinal profile of the jet in the B band (their Figure 5). They detected optical emission from the jet within of the nucleus with an increase in brightness coincident with the brightest infrared jet emission that we observe. The radio profile shows a slow decrease in brightness with distance along the northern radio jet, with a bright region where the X-ray emission is strongest closest to the nucleus.
3.2. Jet Spectrum and Electron Energy Distribution
| Flux Density in Region | |||
|---|---|---|---|
| Wavelength | R1 | R2 | R3 |
| (Jy) | (Jy) | (Jy) | |
| 1.4 GHz11The formal statistical uncertainties are smaller than the significant digits. | |||
| 8.4 GHz11The formal statistical uncertainties are smaller than the significant digits. | |||
| 24 m | |||
| 8.0 m | |||
| 5.8 m | |||
| 4.5 m | |||
| 3.6 m | |||
| 2.2 m | |||
| 1.7 m | |||
| 1.2 m | |||
| 820.3 nm | |||
| 667.3 nm | |||
| 520.2 nm | |||
| 226.7 nm | |||
| 151.6 nm | |||
| 0.3-8.0 keV | |||
Note. — The R1 region extends and is wide. The R2 region extends and is wide. The R3 region extends and is wide. The upper limits are 3 upper limits.
We measured the radio, infrared, and X-ray flux densities from the jet in three different regions (labeled R1, R2, and R3; see Figure 7) along the jet axis and set upper limits on the UV and optical fluxes in these regions. Our choice of regions was guided by the morphology of the jet in the IR and by its relationship to the X-ray emission seen with Chandra (Hardcastle et al. 2002). In the dynamical study of the 3C 31 jet by L02, the jet was divided into three regions based on its radio morphology and modeled jet dynamics. These three regions were termed the inner, the flaring, and the outer regions, and differ somewhat from our regions. Region R1 contains the peak X-ray emission and extends from (1.1 kpc) to (3.6 kpc) from the nucleus with a width of 4 (1.7 kpc). This roughly corresponds to the flaring region in the analysis of L02. We divided the outer region as defined by L02 into two distinct regions, which we call R2 and R3. The R2 region extends from (3.6 kpc) to (7.9 kpc) from the nucleus, and the R3 region extends from (7.9 kpc) to (12.2 kpc). Both regions are (2.2 kpc) in width. The inner region of L02, where the jet has roughly constant opening angle, is within of the nucleus and is not resolved from the host galaxy in the Spitzer data, so we did not use it in our analysis.
In addition to the radio, IR, and X-ray detections of the jet, UV, optical, and additional IR data points are taken from archival GALEX, HST, and 2MASS and MIPS observations, respectively. The fluxes with uncertainties and upper limits at all frequencies for the three regions are given in Table 1. We measured consistent fluxes in the IRAC bands from the nonstellar images resulting from the subtraction of the IRAF ELLIPSE galaxy model and of the 3.6 m stellar emission model.
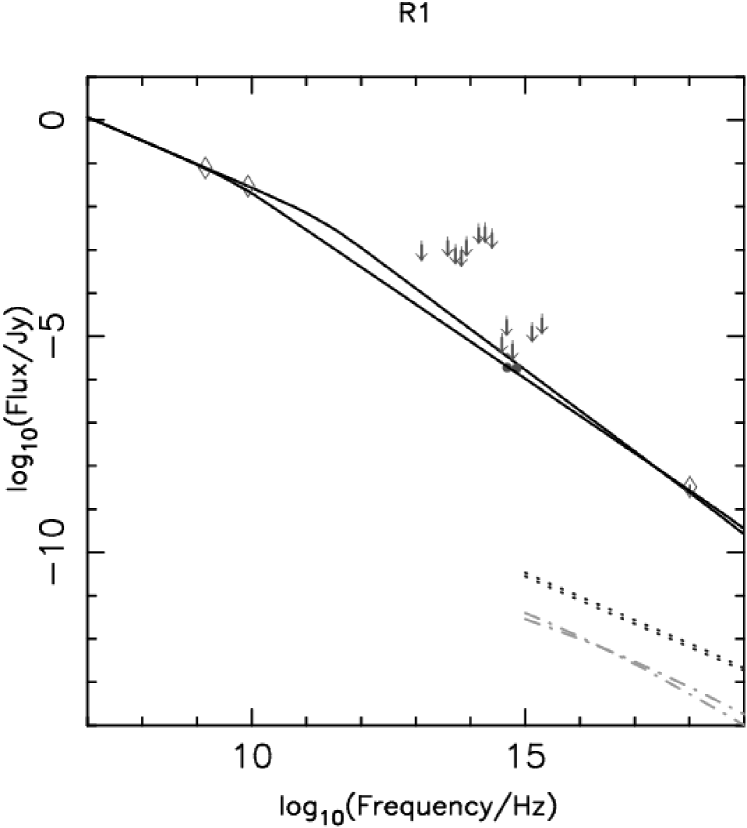
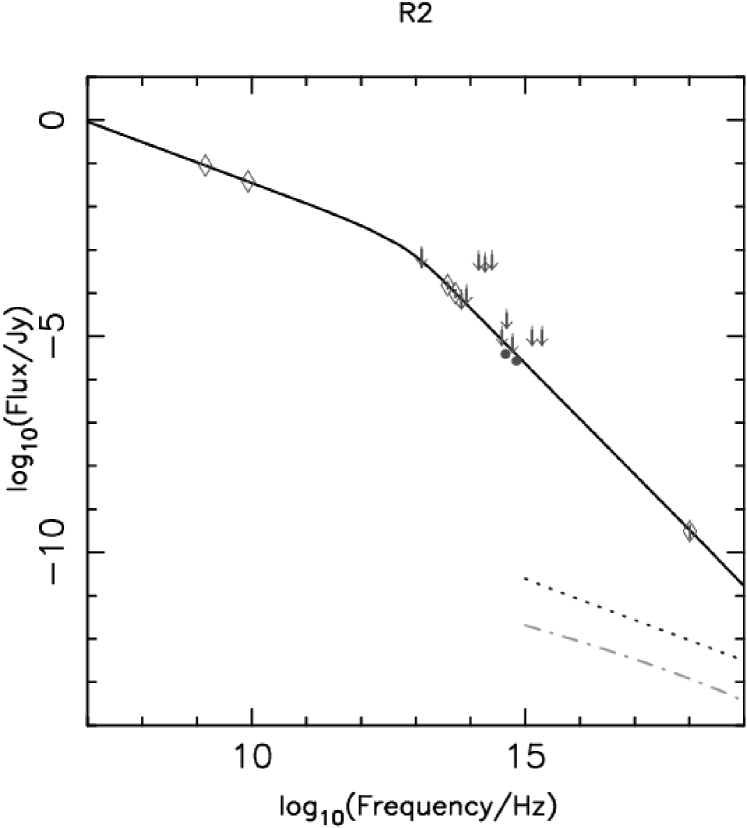
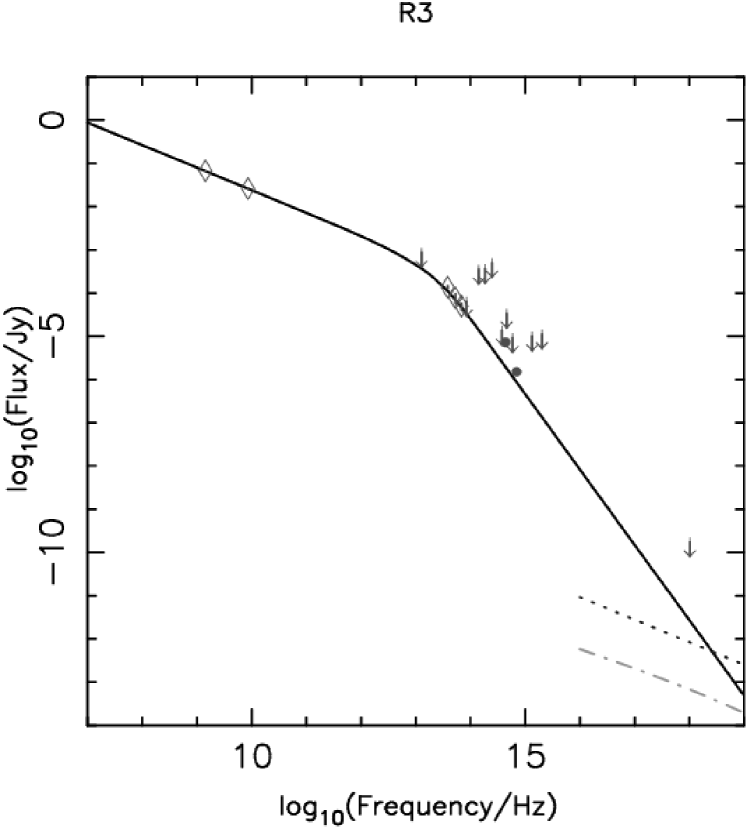
The broadband spectra from R1, R2, and R3 are shown in Figures 8 through 10. To better constrain the electron energy distributions (EEDs) in the three regions and quantify differences between them, we fit the radio to X-ray spectra with power-law models. In all the model fits, we used only the actual detections with the constraint that the fit model could not exceed any of the upper limits. The limited number of points in the spectra and the relative simplicity of the models does not warrant a more sophisticated statistical treatment of the upper limits. Only some of the upper limits put strong constraints on the model fits. We first fit single power-law models to the three spectra and found that this simple model could be rejected at 99.9% significance in all cases.
We therefore fit the spectra with models of synchrotron emission from broken power-law electron energy distributions which contain four free parameters: two spectral indices, a break frequency, and a normalization. An acceptable fit is found for the spectra from all three regions with this model. The model is overdetermined in the R1 region since we have only three data points and a model with four free parameters. In this region, we consider two models with the break frequency frozen. The optical upper limit from HST forces the break frequency to lie in the optical or at lower frequencies, so we consider two models that bracket the extreme limits - one model (F1) with a break frequency just above the 8.4 GHz radio data point and a second model (F2) with a break frequency in the mid-IR, the highest frequency that fits through the radio and X-ray detections and lies below the optical upper limit. The best fit parameters for each of our three regions are summarized in Table 2, and the best fit emission models have been overplotted on Figures 8 to 10.
There are a few interesting points to note about the morphology of the jet in the radio, IR, and X-ray bands. X-ray emission is detected only in the R1 and R2 regions, the two regions closest to the nucleus. The presence of the X-ray emission suggests that there is on-going particle acceleration in these regions, but that acceleration to the highest energies appears to be less efficient in the outer parts of the jet. Guided by our experience with Cen A (Kraft et al. 2002, Hardcastle et al. 2003), there is almost certainly unresolved substructure in these two regions. This clearly demonstrates that the electron energy distributions, and probably the nature of the particle acceleration in general, are distinctly different in each of these regions. There are significant differences in the three spectra that clearly define three distinct regions of particle acceleration. The low-frequency (i.e. radio) spectral indices for the three regions are between 0.47 and 0.54, typical values for radio plasma. The break frequency in region R1 is poorly defined, but must lie somewhere between 10-800 GHz. The spectral index after the break is relatively flat, 0.86-0.97. Regions R2 and R3, in contrast, have fairly well defined break frequencies around 1013 Hz, in the far-IR spectral regime, with a significant spectral steepening beyond the break. In particular, the spectral index after the break is 1.28 and 1.72 in regions R2 and R3, respectively.
| Region | Normalization | Break Frequency | ||
|---|---|---|---|---|
| (Jy) | Low Frequency | High Frequency | (GHz) | |
| R1-F111The formal statistical uncertainties of these fits or parameters are negligible compared to other sources of uncertainty. | 22Extremal break frequencies set by the existing radio data and the HST upper limits. | |||
| R1-F211The formal statistical uncertainties of these fits or parameters are negligible compared to other sources of uncertainty. | 22Extremal break frequencies set by the existing radio data and the HST upper limits. | |||
| R2 | 11The formal statistical uncertainties of these fits or parameters are negligible compared to other sources of uncertainty. | 0.4711The formal statistical uncertainties of these fits or parameters are negligible compared to other sources of uncertainty. | ||
| R3 | 11The formal statistical uncertainties of these fits or parameters are negligible compared to other sources of uncertainty. | 0.5211The formal statistical uncertainties of these fits or parameters are negligible compared to other sources of uncertainty. |
Note. — Fit parameters obtained by minimization using detected fluxes (see Table 1 and requiring the upper limits to be respected. Since the R1 model is overdetermined, we fix the break frequency at the two extremes permitted by the upper limits and determine the remaining parameters. The uncertainties quoted are the 90% uncertainties.
Using the best-fit broken power-law models for the spectra, we determined the equipartition magnetic fields and the break energies of the electron distributions. Predictions for X-ray IC/CMB and SSC emission have been computed using the synch program (Hardcastle et al. 1998, 2004). We assume that =10 and =105, =0 (the ratio of non-radiating to radiating particles), that the radio plasma has unity filling factor, and that the emitting volumes can be modeled as cylinders in the plane of the sky. The corrections for bulk relativistic motion were small, even in R1 where the jet velocity is greatest, due to the relatively large angle to the line of sight. In the two regions where X-ray emission is detected, the observed X-ray flux density lies orders of magnitude above the IC/CMB and SSC predictions, thus strengthening the conclusion of Hardcastle et al. (2002) that this is synchrotron emission from a population of ultra-relativistic electrons. We find equipartition magnetic fields of 3.0, 2.3, and 2.1 nT in regions R1, R2, and R3, respectively. The equivalent magnetic pressures lie somewhat below the pressure of the hot ISM external to the jet (Laing & Bridle 2002a), and implies that there is additional pressure support inside the jet, perhaps from lower-energy relativistic electrons or relativistic or thermal protons. At these magnetic field strengths, we find that the synchrotron lifetime for infrared emitting particles is yr. In order for the observed X-ray flux densities to be the result of IC/CMB, the magnetic field would need to be two orders of magnitude below its equipartition value.
The observed IR emission from the 3C 31 jet cannot be plausibly attributed to any type of inverse-Compton or electron scattering process for two reasons. First, if the IR emission were not synchrotron radiation, the electron energy distribution would have to turn down dramatically in an equipartition field of 3 nT to explain the radio emission but fall below the infrared emission (). The detected X-ray emission in regions R1 and R2 could not then be explained by synchrotron emission from a simple extension of the electron energy distribution to 108. As described above, IC/CMB and SSC emission can be ruled out, unless the jet is far from equipartition, so the origin of the X-ray emission would be unknown. Second, the pressure and total energy of thermal electrons from stars in the jet required to create the IR emission from electron scattering would be unrealistically large. In particular, the energy density of stellar photons at the position of the jet would be 510-14 ergs cm-3, either resulting in an unstable overpressured jet or requiring an unrealistically large energy flux due to the required number of scatterers. Alternatively, as an FR I radio galaxy, 3C 31 is a mis-directed BL Lac in the Unified Scheme of AGN (Urry & Padovani 1995). There could be a significant component of IR emission from the pc-scale jet that is not beamed in our direction. In this scenario however, a typical BL Lac would require an electron density of 1 cm-3 in its jet in order to account for the observed infrared flux. If 3C 31 were a very bright (2-3 orders of magnitude brighter) mis-directed BL Lac requiring a lower density in its jet to create the observed infrared flux, we would expect other morphological features not seen in this system (e.g. the IR/optical beamed flux would be visible at large radii due to Thomson scattering from the electrons in the hot ISM).
4. Discussion
We detected IR emission from two regions of the northern jet in 3C 31 within 15 kpc of the nucleus. The third region R1 likely also contains IR emission, however, we cannot resolve it from the nucleus and dust disk also present within this region. From the fitted spectra in R1, we estimate that IR emission is most likely approximately 10-30 Jy. The radio through IR/optical to X-ray spectra of these three regions of the 3C 31 jet are very different, but each region mirrors in some manner features seen in other jets (e.g. M87 (Shi et al. 2007, Forman et al. 2007), Cen A (Hardcastle et al. 2006), 3C 66B (Tansley et al. 2000, Hardcastle et al. 2001), and 3C 15 (Martel et al. 1998)). The change in the jet from X-ray dominated to IR dominated further down the jet is also seen in jets of greater power (e.g. 3C 273; Uchiyama et al. 2006). In the region closest to the nucleus, R1, the X-ray flux is the highest, the break frequency is the lowest, and the spectrum is the flattest after the break. The relatively flat spectral index extending to the X-ray band is similar to that seen in the knots of the inner kpc of the jet in Cen A (Hardcastle et al. 2003). Further extending the analogy to the jet of Cen A, it is likely that this region of the 3C 31 jet contains significant unresolved substructure in the X-ray and probably the optical/IR as well.
The IR emission in regions R2 and R3 is significantly enhanced relative to the X-ray in comparison with region R1. The break frequencies are also higher than in R1 (see Table 2), as are the post-break spectral indices. The simplest explanation for the observed radio, IR, optical, and X-ray fluxes in the three regions is that there is a single impulsive event in region R1, and the spectral steepening is simply the result of progressive radiative losses. The radiative lifetime of the relativistic particles emitting in the Spitzer band is 3104 yrs, assuming they are radiating in the equipartition field. If these particles are advected down the jet with velocity 0.5c, they would travel roughly 5 kpc. The IR emission from the jet is detected to at least 10 kpc from the nucleus, so based simply on this lifetime argument, it is plausible that the observed multi-frequency features of the jet are the result of synchrotron aging. However, the X-ray and IR morphology of the jet argues strongly against this scenario. In particular, the jet is clearly brightest in the IR near the boundary between regions R2 and R3, and fainter closer to the nucleus within region R2. This suggests that (re-)acceleration is occurring near the boundary of R2/R3. The IR flux in region R1 is not well constrained (we only infer it from the radio/optical/X-ray spectrum due to contamination from the nucleus), but the progressive brightening of the IR emission with increasing distance from the nucleus demonstrates that the jet is being re-energized in regions R2/R3. Additionally, there would be no X-ray synchrotron emission in region R2 in this model. Given the radiative lifetimes, advection of ultra-relativisitic particles may play some role in the appearance of the jet, but it clearly is not the whole story.
There must be a second site of particle acceleration in regions R2/R3. The dramatic change in spectral shape between R1 and R2 suggests that the jet is much less efficient at accelerating particles to 107-8 perhaps because it has significantly decelerated. Additionally, the morphological changes in the radio also suggest a significant change in the flow dynamics from region R1 to R2/R3. The calculations of L02 show a sharp drop in velocity between regions R1 and R2, and a more gradual deceleration of the jet between R2 and R3. The obvious question to ask is are the changes in particle acceleration efficiency related to the morphological/dynamic changes in the jet and if so, how are they related. More generally, the broad-band spectral features seen in 3C 31 are similar to that seen in a wide variety of radio galaxies. The spectra of other extragalactic jets generally show a low frequency spectral index between 0.5 and 0.7 and are typically fit with a broken power law. The jets of 3C 66B, 3C 15, and the outer diffuse regions of the Cen A jet all have breaks in their spectra around Hz and have high frequency spectral indices between 1.13 (Cen A, 3C 15) and 1.35 (3C 66B), similar to region R2. We speculate that the efficiency of ultra-relativistic particle acceleration is a strong function of the jet velocity and/or the entrained mass, and that this is a general feature of particle acceleration of all extragalactic jets on kpc scales.
Mass loading may have an important effect on the dynamics of particle acceleration. In both Cen A and 3C 31, the jets are believed to be moderately relativistic over the region where X-ray and IR synchrotron emission is detected. In both cases, the mass swept up by the jet, either from embedded AGB stars or from the ambient ICM, is relatively small. But in both cases, the IR synchrotron emission extends considerably further from the nucleus than the X-ray emission. There are many ways that a small amount of mass loading can fundamentally change the dynamics of the flow: it could change the internal sound speed, the equation of state, the Reynolds number, etc. A full discussion of the effects of mass loading the jet on the particle acceleration is beyond the scope of this paper, but given the similarities of 3C 31 and Cen A, the dynamics of these systems appear to be qualitatively similar. More generally, deep radio observations of FR I jets typically show knotted embedded structures (Worrall et al. 2007) similar to Cen A and 3C 31, suggesting that dissipative processes are a common feature of FR I jets and play an important role in particle acceleration.
The dramatic transition from the X-ray dominated to IR dominated jet is most clear in Centaurus A where the X-ray jet narrows and disappears roughly 4 kpc from the nucleus, while the IR emission brightens as the jet opens into the northeast radio lobe (Hardcastle et al. 2006). It is in this region where the jet dynamics appears to transition from momentum-dominated to pressure-dominated. Kraft et al. (2008) showed that in the case of Cen A, the jet appears to cross a density/temperature discontinuity in the hot ISM. This discontinuity in density and temperature, but not pressure, is the result of non-hydrostatic motions induced in the gas by a recent merger. There are several galaxies in the larger 3C 31 group, and one of these satellites may have disturbed the gas core. The transition from momentum to pressure domination in the jet may have an important effect on the particle acceleration efficiency and hence the visible appearance of the jet at IR/optical/X-ray wavelengths. This suggests that subtle changes in the state of the external atmosphere may have an important influence on the efficiency of electron acceleration internal to the jet. The existing Chandra data are not sufficient to determine whether there is a surface brightness discontinuity present in the gas at the interface between regions R1 and R2. Alternatively, it has been argued that the X-ray synchrotron shocks in the Cen A jet are the result of interactions between the jet and AGB stars in the host galaxy (Nulsen et al., in preparation), and that mass loading of the jet from material swept up via Kelvin-Helmholtz instabilities plays little role in the deceleration of the jet. There are some important differences between the Cen A jet (Kraft et al. 2002) and that of 3C 31; the jet is somewhat smaller in Cen A and its synchrotron output is about an order of magnitude less powerful than in 3C 31, so one must be careful about pushing this analogy too far, but there are clearly some qualitative similarities.
We obtained the external gas pressure measured as a function of distance from the nucleus from Laing & Bridle (2002a), and compared it to the equipartition pressure for each region. In region R1, the difference between the external pressure and the equipartition pressure is nearly an order of magnitude, but in region R3, it is less than a factor of 2. Note that the jet pressures cannot actually be this low, the jet would be crushed in an (ISM) sound crossing time if this were true. As argued by Laing & Bridle (2002a), the trend that / approaches unity at larger distances from the nucleus suggests that mass entrainment and heating is not providing the additional pressure support. Relativistic, radiating particles and magnetic fields are likely the dominant source of pressure support along the length of the jet. One would naively expect that more mass has been entrained at larger radii and that if such entrainment played an important role in the pressure of the jet, it would become progressively more important at larger radii. That is, mass loading cannot play a significant role in providing pressure support, although as we have argued above it likely plays a critical role in particle acceleration.
Finally we note that the clear differences in radio flux density between the jet and counterjet can be accounted for by relativistic beaming (Laing & Bridle 2002a), and the differences in the IR can be attributed to the same process. We calculated the expected flux ratio in the jet and counterjet due to beaming:
| (1) |
Assuming an angle to the line of sight of and velocities from the models of L02 and using the appropriate spectral indices, we find the expected ratio in the region where we measured the counterjet flux to be 3 in the radio bands and 6 in the infrared bands. Our measured ratios are close to these in the radio bands and the marginal detections/upper limits on the counterjet’s infrared flux yield lower limits on the flux ratio that agrees with the expected value. Since the X-ray emission is strongest in R1, we searched for X-ray counterjet emission in a corresponding region on the opposite side of the nucleus. We do not currently detect the counterjet. Using the same velocity profile ( between 0.72-0.76) and angle to the line of sight, we expect a ratio between 50 and 65 estimated over R1. The expected (0.5-2.0 keV) flux of nJy is lower than the upper limit of nJy currently set by the background in the existing Chandra exposure.
5. Conclusions
We have presented a clear detection of IR emission from the northern jet and a marginal detection of the counterjet of 3C 31. We show that there is significant variation in the radio through X-ray spectra along the jet, and have outlined some implications for the jet dynamics and particle acceleration. In particular, the ratio of IR to X-ray flux increases dramatically as a function of distance from the nucleus. In a future paper, we will present results from Spitzer observations of a sample of nearby radio jets (Bliss et al., in preparation). We are slowly increasing our sample size of IR, optical, and X-ray jets, and it is now clear that broadband synchrotron emission is a ubiquitous feature of FR I jets. The spectral properties of the 3C 31 jet appear to span those seen in other extragalactic jets. It is likely that a range of particle acceleration regimes are present in jets generally, and at least two different regimes are present in 3C 31.
Additional future observations may shed further light on some of the issues addressed here. In particular, a deep Chandra observation would be able to resolve the detailed structure of the gas external to the jet. Such an observation may reveal contact discontinuities between two relatively stationary fluids that may play an important role in the jet dynamics. A deeper X-ray observation of the jet may also reveal regions of lower surface brightness further from the nucleus than observed here, as well as more clearly resolve the structures of the inner jet. Such an observation also would put strong constraints on the presence of a counter jet and constrain the jet velocity. Higher angular resolution IR observations, particularly at lower frequencies than presented here, may be able to resolve knots and other substructures in the jet.
References
- Ashby et al. (2009) Ashby, M. L. N., et al. 2009, ApJ, 701, 428
- Bîrzan et al. (2004) Bîrzan, L., Rafferty, D. A., McNamara, B. R., Wise, M. W., & Nulsen, P. E. J. 2004, ApJ, 607, 800
- Brookes et al. (2006) Brookes, M. H., Lawrence, C. R., Keene, J., Stern, D., Gorijan, V., Werner, M., & Charmandaris, V. 2006, ApJ, 646, L41
- Burch (1977) Burch, S. F. 1977, MNRAS, 181, 599
- Butcher et al. (1980) Butcher, H. R., van Bruegel, W., Miley, G. K., 1980, ApJ, 235, 749
- Croston et al. (2003) Croston, J. H., Birkinshaw, M., Conway, E., & Davies, R. L. 2003, MNRAS, 339, 82
- de Vaucouleurs et al. (1991) de Vaucouleurs, G., de Vaucouleurs, A., Corwin, J. R., Buta, R. J., Paturel, G., & Fouque, P., 1991, Third Reference Catalogue of Bright Galaxies, (New York: Springer-Verlag)
- Fanaroff & Riley (1974) Fanaroff, B. L. & Riley, J. M. 1974, MNRAS, 167, 31P
- Fazio et al. (2004) Fazio, G. G. et al. 2004, ApJS, 154, 10
- Fomalont et al. (1980) Fomalont, E. B., Bridle, A. H., Willis, A. G., & Perley, R. A. 1980, ApJ, 237, 418
- Forman et al. (2007) Forman, W. et al. 2007, ApJ, 665, 1057
- Hardcastle et al. (1998) Hardcastle, M. J., Birkinshaw, M., & Worrall, D. M. 1998, MNRAS, 294, 615
- Hardcastle et al. (2001) Hardcastle, M. J., Birkinshaw, M., & Worrall, D. M., 2001, MNRAS, 326, 1499
- Hardcastle et al. (2002) Hardcastle, M. J., Worrall, D. M., Birkinshaw, M., Laing, R. A., & Bridle, A. H. 2002, MNRAS, 334, 182
- Hardcastle et al. (2003) Hardcastle, M. J., Worrall, D. M., Kraft, R. P., Forman, W. R., Jones, C., & Murray, S. S. 2003, ApJ, 593, 169
- Hardcastle et al. (2004) Hardcastle, M. J., Harris, D. E., Worrall, D. M., & Birkinshaw, M. 2004, ApJ, 612, 729
- Hardcastle et al. (2006) Hardcastle, M. J., Kraft, R. P., & Worrall, D. M. 2006, MNRAS, 368, L15
- Holtzman et al. (1995) Holtzman, J. A., Burrows, C. J., Casertano, S., Hester, J. J., Trauger, J. T., Watzon, A. M., & Worthey, G. 1995, PASP, 107, 1065
- Kraft et al. (2002) Kraft, R. P. et al. 2002, ApJ, 569, 54
- Kraft et al. (2008) Kraft, R. P. et al. 2008, ApJ, 677, L97
- Laing & Bridle (2004) Laing, R. A. & Bridle, A. H. 2004, MNRAS, 348, 1459
- Laing & Bridle (2002a) Laing, R. A. & Bridle, A. H. 2002a, MNRAS, 336, 1161
- Laing & Bridle (2002b) Laing, R. A. & Bridle, A. H. 2002b, MNRAS, 336, 328 (L02)
- Laing et al. (2008) Laing, R. A., Bridle, A. H., Parma, P., Feretti, L., Giovannini, G., Murgia, M., & Perley, R. A., 2008, MNRAS, 386, 657
- Lara et al. (1997) Lara, L., Cotton, W. D., Giovannini, G., Venturi, T., & Marcaide, J. M. 1997, ApJ, 474, 179
- Loken et al. (1995) Loken, C., Roettiger, K., Burns, J. O., & Norman M. 1995, ApJ, 445, 80
- Martel et al. (1998) Martel, A. R. et al. 1998, ApJ, 496, 203
- Martel et al. (2000) Martel, A. R., Turner, N. J., Sparks, W. B., & Baum, S. A. 2000, ApJS, 130, 267
- Martin et al. (2005) Martin, D. C. et al. 2005, ApJ, 619, L1
- Pahre et al. (2004) Pahre, M. A., Ashby, M. L. N., Fazio, G. G., & Willner, S. P. 2004, ApJ, 154, 229
- Peng et al. (2002) Peng, C. Y., Ho, L. C., Impey, C. D., & Rix, H. 2002, AJ, 124, 266
- Rieke et al. (2004) Rieke, G. H. et al. 2004, ApJS, 154, 25
- Schuster et al. (2006) Schuster, M. T., Marengo, M. & Patten, B. M. 2006, SPIE, 6270, 65
- Shi et al. (2007) Shi, Y., Rieke, G. H., Hines, D. C., Gordon, K.D., & Egami, E. 2007, ApJ, 655, 781
- Tang et al. (2009) Tang, Y., Gu, Q.-S., Huang, J.-S., & Wang, Y.-P. 2009, MNRAS, 397, 1966
- Tansley (1997) Tansley, D. 1997, M. S. Thesis, University of Manchester
- Tansley et al. (2000) Tansley, D., Birkinshaw, M., Hardcastle, M. J., & Worrall, D. M., 2001, MNRAS, 317, 623
- Uchiyama et al. (2006) Uchiyama, Y. et al. 2006, ApJ, 648, 910
- Urry & Padovani (1995) Urry, M. & Padovani, P. 1995, PASP, 107, 803
- Weisskopf et al. (2000) Weisskopf, M. C., Tananbaum, H. D., Van Speybroeck, L. P., & O’Dell, S. L. 2000, SPIE, 4012, 2
- Worrall (2009) Worrall, D. M. 2009, A&ARv 17, 1
- Worrall et al. (2007) Worrall, D. M., Birkinshaw, M., Laing, R. A., Cotton, W.D., & Bridle, A.H. 2007, MNRAS, 380, 2