Probing the Fermi Surface of 3D Dirac Semimetal Cd3As2 through de Haas-van Alphen Technique
Abstract
We have observed Shubnikov-de Haas and de Haas-van Alphen effects in the single crystals of three dimensional Dirac semimetal Cd3As2 upto to 50 K, traceable at field as low as 2 T and 1 T, respectively. The values of Fermi wave vector, Fermi velocity, and effective cyclotron mass of charge carrier, calculated from both the techniques, are close to each other and match well with the earlier reports. However, the de Haas-van Alphen effect clearly reflects the existence of two different Fermi surface cross-sections along certain direction and a non-trivial Berry’s phase which is the signature of 3D Dirac Fermion in Cd3As2.
Now a days, topology-dependent electronic properties of solids are the subject of considerable research interest in condensed matter physics. Dirac materials such as graphene castro , topological insulator hasan ; qi and the parent compounds of iron based superconductors rich whose excitations obey a relativistic Dirac-like equation have been widely studied in recent years. Three dimensional (3D) Dirac semimetal is one of the candidates of topology protected band structure in which semimetal bulk has linearly dispersing excitation and surface state is the topology protected Fermi arc ler ; hsi ; tang ; tang1 .
In these systems, the pair of 3D Dirac points is protected by crystal symmetry young ; man ; wang . From Dirac semimetal, it is possible to obtain a Weyl semimetal or topological insulating phase by breaking time reversal or inversion symmetry wang1 . One can also obtain topological superconducting phase by doping charge carrier in the system wang1 . Recent experiments have demonstrated the existence of a 3D Dirac semimetal phase in Na3Bi and Cd3As2 liu ; xu ; liu1 ; neu ; bori . Angle-resolved photoemission spectroscopy (ARPES) measurements on Cd3As2 single crystals have shown that two almost identical ellipsoidal Fermi surfaces are located on the opposite sides of the Brillouin zone center point along the direction neu ; bori . However, these two are expected to merge into a single ellipsoidal contour around point beyond Lifshitz transition from STM jeon . The Lifshitz transition occurs when the two Fermi surfaces touche with each other. Band structure calculations suggest that this transition should occur very close to the Fermi energy133 meV feng . Analysis of Shubnikov-de Haas (SdH) oscillations also suggests the existence of one or equivalent Fermi surface cross-sections corresponds to the single frequency of oscillation lphe . Thus, probing the Fermi surface of Cd3As2 by different techniques may provide a crucial cross reference on its novel quantum properties.
Shubnikov-de Haas (SdH) oscillations, which have been observed lphe ; andu ; jeon ; tian ; feng in Cd3As2, originate due to the oscillations in the scattering rate of charge carriers. On the other hand, the oscillations in free energy in presence of magnetic field cause de Haas van Alphen (dHvA) effect, i.e., the oscillations in magnetization. Though the oscillations in both the cases are driven by the same physical parameter, dHvA offers a more accurate picture of the Fermi surface as it is not sensitive to quantum interference effects or noise from the electrical contacts. However, the investigation of Fermi surface in this 3D Dirac semimetal through dHvA is yet to be done. In this Letter, along with SdH oscillation and high non-saturating linear magnetoresistance (MR), we report the observation of two different Fermi surface cross-sections from the dHvA effect which eventually establishes itself as a better probe to study the Fermi surface properties. Furthermore, this non-transport dHvA effect also confirms the nontrivial Berry’s phase (signature of 3D Dirac fermion) in Cd3As2.
Single crystals of Cd3As2 were synthesized by chemical vapor transport technique. First, we prepare polycrystalline Cd3As2 samples by heating the stoichiometric mixture of high purity Cd pieces and As powder at 500∘C for 8 h and at 850∘C for 24 h in a vacuum sealed quartz tube of 15 cm long and 16 mm diameter. The product was then heated again at 550∘C for another 48 h for homogenization. Finally, the quartz tube was placed in a gradient furnace and heated for 48 h. During heating, the end of the quartz tube which contains the compound was maintained at 690∘C while the other end was kept at 600∘C. The furnace was then cooled slowly to room temperature. Several small size shiny plate-like crystals formed at the cold end of the tube were mechanically extracted for transport and magnetic measurements. Powder X-ray diffraction of crashed single crystals shows that these crystals have I41/acd space group and contain no impurity phases. The details are given in supplementary material sup . The electrical and thermal transport measurements were carried out in a 9 T physical property measurement system (Quantum Design). The magnetization was measured using a SQUID VSM (Quantum Design).
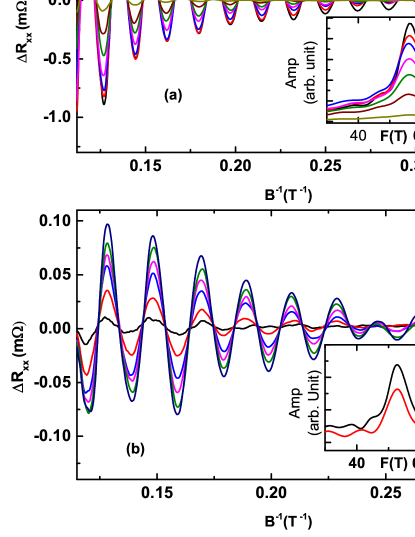
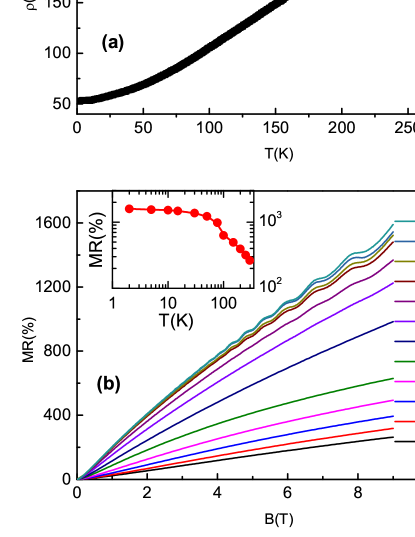
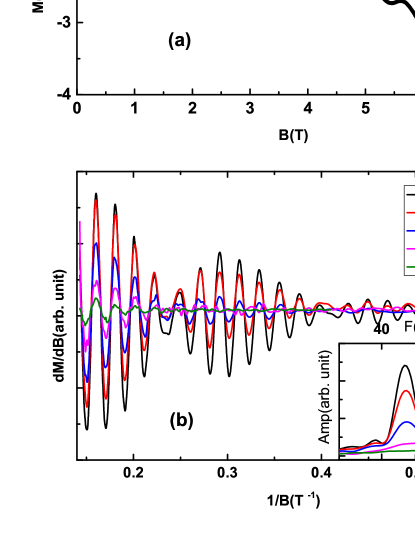
Figure 1(a) shows the temperature dependence of the resistivity xx of a Cd3As2 single crystal. xx is metallic over the whole range of temperature. xx exhibits approximately dependence above 100 K and becomes almost independent for 20 K which reveals a residual resistivity xx(0) 50 cm. Both the value and the nature of temperature dependence of resistivity are similar to earlier reports lphe ; feng . Fig. 1(b) displays the field dependence of the magnetoresistance at different temperatures. MR is defined as [xx() - xx(0)]/xx(0). Here, current is along [012] direction and the applied magnetic field is parallel to [100] direction. Even at room temperature and 9 T magnetic field, MR shows no sign of saturation and its value is as high as 263. Except at low field, MR is approximately linear. Such a large linear MR at room temperature is quite unusual and needs further theoretical study for understanding the physical origin. With decreasing temperature, MR increases rapidly and it reaches 1600 at 2 K and 9 T. In the inset of Fig. 1(b), we have shown the temperature dependence of MR at 9 T in log-log scale. It is clear from the figure that, unlike conventional metal, MR shows a saturation like behavior in the low temperature region below 30 K. Similar behavior has also been observed in other crystals.
, obtained after subtracting a smooth background from MR, is plotted in Figs. 2(a) and (b) as a function of 1/ for fields along [100] and [021̄], respectively. The presence of SdH oscillations can be traced down to a field of 2 T and up to 50 K. With increasing temperature, the amplitude of oscillation decreases rapidly. The fast Fourier transform spectra of versus 1/ curve shows a single oscillation frequency at around 56 T [Inset of Fig. 2(a)] and 53 T [Inset of Fig. 2(b)] for field along [100] and [021̄], respectively. According to the Onsager relation (0/22), the cross-sectional areas of Fermi surface normal to the field are 5.3210-3 and 5.04 10 respectively. Assuming a circular cross-section, a small Fermi momentum 0.04 is calculated. Both the values and presence of single frequency are in good agreement with recent ARPES neu ; bori and STM jeon results. Where in both the cases single frequency is expected for two identical ellipsoids or single ellipsoidal contour, below and above the Lifshitz transition, respectively.
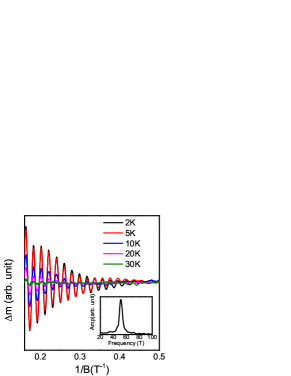
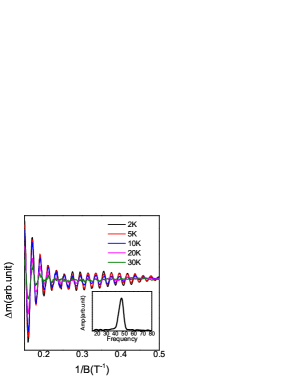
The magnetization of Cd3As2 crystal has been measured at different temperatures with parallel to [021̄] direction, which displays a very clear dHvA effect [Fig. 3(a)]. We have been able to observe the oscillations down to 1 T and up to 50 K. This indicates that the quantization of electron orbit does not get blurred by collisions with phonon or any impurity due to the high mobility of the charge carriers. In Fig. 3(b), the magnetic susceptibility (d/d) versus 1/ plot shows how the oscillation amplitude decreases with increasing temperature. Inset of Fig. 3(b) shows the oscillation frequency obtained by the Fourier transformation of d/d curve. Unlike magnetoresistance data, we observe that there are two distinct oscillation frequencies: one at 46 T, and the other at 53 T. This reveals two cross-sectional areas of the Fermi surface perpendicular to , 4.39 10-3 and 5.04 10-3 respectively. To understand the phenomenon, we have done the magnetization measurements with field along [100] direction sup . But dHvA oscillation along this direction gives only one frequency which is close to the frequency found from SDH oscillation along that direction. Though the dHvA oscillation along [100] direction establishes the equivalence between two ellipsoidal Fermi surfaces found in ARPES bori or single ellipsoidal contour after Lifshitz transition, the magnetization measurement along [021̄] direction indicates two Fermi surface cross-sections correspond to the two frequencies. Also, we have done magnetization measurements in [100] plane, by applying magnetic field making an angle with [021̄] direction. It is found that the peak amplitude at 53 T diminishes with increasing and disappears at = 90∘ i.e., along [012] direction, giving single frequency of oscillation at 46.5 T sup . The above study clearly shows that two equivalent cross-sections from two ellipsoidal Fermi surfaces superpose with each other along certain direction leading to two frequencies of oscillation in dHvA effect. Another possible explanation for the occurrence of these two frequencies may be the contribution from surface and bulk states as predicted theoretically potter . But the single frequency along [100] and [012] directions and sample thickness 0.4 mm which seems to be much larger than the critical thickness, eliminate the possibility of quantum oscillation from surface state.
In Figs. 4(a) and (b), the integer index , corresponding to the peak in SdH and +1/4 corresponding to peak in dHvA oscillation, is assigned in such a way that a linear extrapolation of the straight line yields an intercept closest to zero index. Here we have taken into account the fact that is advance in phase by /2 with respect to (oscillation in magnetization after subtracting a smooth polynomial back ground)sup .
In order to determine the quantum limit, i.e., the value of magnetic field required to achieve the lowest Landau level (=0), we have plotted vs 1/B in Figs. 4(a) and (b). From the linear extrapolation of index plot of SdH and dHvA effect, it is found that the system reaches quantum limit at 50-60 T. The value of critical field for the quantum limit is very close to that observed recently narayan ; cao .
When a closed cyclotron orbit is quantized under an external magnetic field B, then according to the Lifshitz-Onsager quantization rule Here, is the Berry’s phase where can take values from 0 to 1/2 (0 for parabolic dispersion as in the case of conventional metals and 1/2 for the Dirac system), and is an additional phase shift where can change from 0 for a quasi-2D cylindrical Fermi surface to 1/8 for a corrugated 3D Fermi surface [25]. From the linear extrapolation of index plot, the intercept 0.33 (0.20) obtained in Fig. 4(a) from the SdH oscillation with B along [100] and ([021̄]). The intercept should be within (+,-)1/8 from zero depending on the curvature along z-direction for the 3D Dirac fermion system Mura . But we have found an additional phase shift 0.32 (0.2), deviating from the expected value. From the index plot of dHvA oscillation, we have found two intercepts at 0.23 and 0.35 due to the presence of two frequencies.
Again in our experiment we have used B 9 T and the Landau index plots are very straight, so one cannot expect the phase shifting due to the orbital and Zeeman splitting of the spin-degenerate conduction band jeon . So, we assume that this extra phase shift may be due to the contribution from a small parabolic curvature and anisotropic ellipsoidal nature of Fermi surface away from the Dirac point. This result clearly demonstrates a nontrivial Berry’s phase associated with 3D Dirac semimetal phase in Cd3As2.
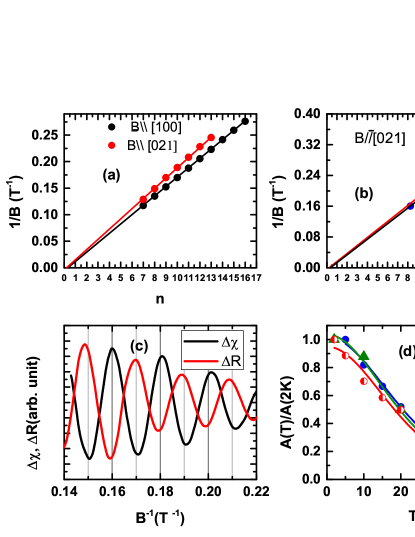
Both SdH and dHvA oscillations are appropriate tools to study the Fermi surface properties and to identify the type of charge carrier. Figure 4(c) shows the measured magnetic susceptibility and the oscillating part of magnetoresistance as a function of 1/. The oscillation in is approximately 180∘ out of phase with respect to . As the oscillatory component of the conductivity () is out of phase with , i.e., sign()-sign(), both and are in phase with each other. Now considering the relation liftz and taking into account the fact that, in- and out-of-phase behavior correspond to electrons and holes with = +1 and = -1 respectively ia , we conclude that the majority charge carrier in this system is electron. This is consistent with negative sign of thermoelectric power (TEP) of the present samples in the temperature range 10-350 K (see supplementary material sup ) and the negative sign of reported Hall coefficient lphe . It may be noted that TEP exhibits a linear temperature dependence similar to that observed in graphene, which is in quantitative agreement with the semiclassical Mott relation mott .
The thermal damping of the oscillation amplitude can be described by the temperature dependent part of the Lifshitz-Kosevich formula:
| (1) |
where is a temperature independent constant and is the cyclotron frequency. The energy gap can be obtained by fitting the relative amplitude of SdH and dHvA oscillations with Eq. (1) [Fig. 4(d)]. Though for a Dirac system, its linear spectrum implies zero rest mass and gives the Landau energy level , their cyclotron mass is not zero. So the quantum oscillation amplitude can indeed be described by the above expression with where is the effective cyclotron mass of charge carrier and the Fermi velocity Nov ; Gus ; Dong . We deduce 1.03106(0.96106) m/s and 0.045me(0.05me) by analyzing the SdH oscillations with field along [021̄]([100]) direction. Similarly, we have fitted the amplitude of 9th Landau Level of dHvA oscillations with Eq. (1) and found v 1.04 106m/s and 0.044me for =53 T. Thus, the calculated values of and from transport and magnetization data are close to each other. These values are also close to those reported by different groups andu ; lphe ; tian ; feng .Now, using the value of Fermi energy and Fermi velocity, we have deduced the Fermi energy 270 meV. So we are above the Lifshitz transition point reported in jeon ; feng By fitting the MR oscillation amplitude with magnetic field to , we deduce the Dingle temperature =16.8 K at 2 K.
In conclusion, we have studied dHvA and SdH oscillations as two parallel methods to probe the Fermi surface of Cd3As2 and the values of Fermi wave vector, Fermi velocity, and effective cyclotron mass of charge carrier have been calculated from both the techniques. In our study, dHvA effect reveals two distinct frequencies of oscillations 46 and 53 T along [021̄], unlike single frequency along [100] and [012], which confirms the existence of two Fermi surface cross-sections along certain directions. Both transport (SdH) and magnetic (dHvA) measurements support a non-trivial Berry’s phase with a phase shift which is the signature of existence of a 3D Dirac semimetal phase in Cd3As2.
Note added in proof. After submitting our manuscript, we have come to know the results in Zhao where they have found double frequency from SDH oscillation measurement. They have argued that Fermi surface of Cd3As2 consists two nested ellipsoids beyond the Lifshitz saddle point.
Acknowledgement: We thank N. Khan and A. Midya for their help during measurements and useful discussions. P. Dutta would also like to thanks CSIR, India for Senior Research fellowship(File no. 09/489(0086)/2010-EMR-I).
References
- (1) A. H. Castro Neto, F. Guinea, N. M. R. Peres, K. S. Novoselov, and A. K. Geim, Rev. Mod. Phys. 81, 109(2009).
- (2) M. Z. Hasan and C. L. Kane, Rev. Mod. Phys. 82, 3045 (2010).
- (3) X.-L. Qi and S.-C. Zhang, Rev. Mod. Phys. 83, 1057 (2011).
- (4) P. Richard, K. Nakayama, T. Sato, M. Neupane, Y.-M. Xu, J. H. Bowen, G. F. Chen, J. L. Luo, N. L. Wang, X. Dai, Z. Fang, H. Ding, and T. Takahashi, Phys. Rev. Lett. 104, 137001 (2010).
- (5) L. S. Lerner, K. F. Cuff, and L. R. Williams, Rev. Mod. Phys. 40, 770 (1968).
- (6) D. Hsieh, D. Qian, L. Wray, Y. Xia, Y. S. Hor, R. J. Cava, and M. Z. Hasan, Nature (London) 452, 970 (2008).
- (7) S. Tang and M. S. Dresselhaus, Nano Lett. 12, 2021 (2012).
- (8) S. Tang and M. S. Dresselhaus, Nanoscale 4, 7786 (2012).
- (9) S. M. Young, S. Zaheer, J. C. Y. Teo, C. L. Kane, E. J. Mele, and A. M. Rappe, Phys. Rev. Lett. 108, 140405 (2012).
- (10) J. L. Mãnes, Phys. Rev. B 85, 155118 (2012).
- (11) Z. J. Wang, Y. Sun, X. Q. Chen, C. Franchini, G. Xu, H. M. Weng, X. Dai, and Z. Fang, Phys. Rev. B 85, 195320 (2012).
- (12) Z. Wang, H. Weng, Q. Wu, X. Dai, and Z. Fang, Phys. Rev.B 88, 125427 (2013).
- (13) Z. K. Liu, B. Zhou, Y. Zhang, Z. J. Wang, H. M. Weng, D. Prabhakaran, S.- K. Mo, Z. X. Shen, Z. Fang, X. Dai, Z. Hussain, and Y. L. Chen, Science 343, 864 (2014).
- (14) S.-Y. Xu et al., arXiv: 1312.7624.
- (15) Z. K. Liu et al., Nat. Mater. 13, 677 (2014).
- (16) M. Neupane et al., Nat. Commun. 5, 3786 (2014).
- (17) S. Borisenko, Q. Gibson, D. Evtushinsky, V. Zabolotnyy, B. Büchner, R. J. Cava Phys. Rev. Lett. 113, 027603 (2014).
- (18) S. Jeon, B. B. Zhou, A. Gyenis, B. E. Feldman, I. Kimchi, A. C. Potter, Q. D. Gibson, R. J. Cava, A. Vishwanath and A. Yazdani Nature Materials 13, 851 856 (2014).
- (19) J. Feng, Y. Pang, D. Wu, Z. Wang, H. Weng, J. Li, X. Dai, Z. Fang, Y. Shi, and L. Luyar arXiv:1405.6611.
- (20) L. P. He, X. C. Hong, J. K. Dong, J. Pan, Z. Zhang, J. Zhang, and S. Y. Li, Phys. Rev. Lett. 113, 246402 (2014).
- (21) A. C. Potter, I. Kimchi, A. Vishwanath, Nature Communications 5, 5161 (2014).
- (22) T. Liang, Q. Gibson, M. N. Ali, M. Liu, R. J. Cava, N. P. Ong, arXiv:1404.7794.
- (23) Please see Supplemental Material at [URL will be inserted by publisher] for “Probing the Fermi Surface of 3D Dirac Semimetal Cd3As2 through de Haas-van Alphen effect”.
- (24) A. C. Potter, I. Kimchi, and A. Vishwanath, Nat. Commun.5, 5161 (2014).
- (25) A. Narayanan, M. D. Watson, S. F. Blake, Y. L. Chen, D. Prabhakaran, B. Yan, N. Bruyant, L. Drigo, I. I. Mazin, C. Felser, T. Kong, P. C. Canfield, A.I.Cold arXiv:1412.4105.
- (26) J. Cao, S. Liang, C. Zhang, Y. Liu, J. Huang, Z. Jin, Z. Chen, Z. Wang, Q. Wang, J. Zhao, S. Li, X. Dai, J. Zou, Z. Xia, L. Li, F. Xiu, arxiv 1412.0824.
- (27) H. Murakawa, M. S. Bahramy,M. Tokunaga, Y. Kohama, C. Bell, Y. Kaneko, N. Nagaosa, H. Y. Hwang, and Y. Tokura, Science 342, 1490 (2013).
- (28) E. M. Lifshitz and L. P. Pitaevskii, Physical Kinetics (Butterworth-Heinemann, Oxford, 1995).
- (29) I. A. Luk yanchuk, Y. Kopelevich, Phys. Rev. Lett. 93, 166402 (2004).
- (30) Y. M. Zuev, W. Chang, and P. Kim, Phys. Rev. Lett. 102, 096807 (2009).
- (31) K. S. Novoselov, A. K. Geim, S. V. Morozov, D. Jiang, M. I. Katsnelson, I. V. Grigorieva, S. V. Dubonos and A. A. Firsov, Nature 438, 197 (2005).
- (32) V. P. Gusynin, and S. G. Sharapov, Phys. Rev. B 71, 125124 (2005).
- (33) D-X. Qu, Y. S. Hor, J. Xiong, R. J. Cava and N. P. Ong, Science 329, 821 (2010).
- (34) Yanfei Zhao et al. arXiv:1412.0330.
I Supplementary Material for “Probing the Fermi Surface of 3D Dirac Semimetal Cd3As2 through de Haas-van Alphen Technique”
II Crystal Structure analysis
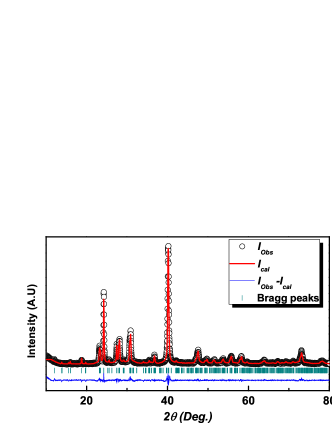
Phase purity and the structural analysis of the samples were done by high resolution powder x-ray diffraction (XRD) technique (Rigaku, TTRAX II) using Cu-Kα radiation. Fig. S1 shows the x-ray diffraction pattern of powdered sample of Cd3As2 single crystals at room temperature. Within the resolution of XRD, we have not seen any peak due to impurity phase. Using the Rietveld profile refinement program of diffraction patterns, we have calculated the lattice parameters 12.64403 Å and 25.44722 Å with space group symmetry I41/acd.
III Magnetoresistance Measurement

Figure 2 shows the magnetic field dependence of magnetoresistance at various temperatures for another piece of Cd3As2 single crystal. Similar to Fig. 1(b) in the text, the magnetic field was applied along [100] direction while the current was along [012]. Though, the value of magnetoresistance is small for this sample, the amplitude of SdH oscillation is much larger and it is clearly visible even at 77 K.
IV Thermal Transport Measurement
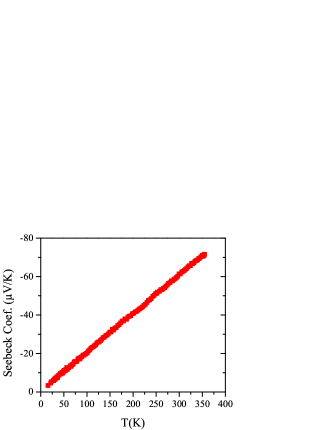
Both the resistivity and thermoelectric power (TEP) measurements of Cd3As2 single crystals were done by standard four-probe technique. Electrical contacts were made using conductive silver paste. Measurements were done in the temperature range 2-350 K in physical property measurement system (Quantum Design). The temperature dependence of TEP is shown in Fig. 3. TEP is negative and shows linear dependence over the measured temperature range. At room temperature, the value of TEP is about 61 V/K which is significantly large.
V Magnetization measurement