The SKA as a Doorway to Angular Momentum
Abstract:
Angular momentum is one of the most fundamental physical quantities governing galactic evolution. Differences in the colours, morphologies, star formation rates and gas fractions amongst galaxies of equal stellar/baryon mass are potentially widely explained by variations in their specific stellar/baryon angular momentum . The enormous potential of angular momentum science is only just being realised, thanks to the emergence of the first simulations of galaxies with converged spins, paralleled by a dramatic increase in kinematic observations. Such observations are still challenged by the fact that most of the stellar/baryon angular momentum resides at large radii. In fact, the radius that maximally contributes to the angular momentum of an exponential disk () is twice as large as the radius that maximally contributes to the disk mass; thus converged measurements of angular momentum require either extremely deep IFS data or, alternatively, kinematic measurements of neutral atomic hydrogen (\ha), which naturally resides at the large disk radii that dominate the angular momentum. The SKA has a unique opportunity to become the world-leading facility for angular momentum studies due to its ability to measure the resolved and/or global HI kinematics in very large and well-characterised galaxy samples. These measurements will allow, for example, (1) a very robust determination of the two-dimensional distribution of galaxies in the -plane, (2) the largest, systematic measurement of the relationship between , , and tertiary galaxy properties, and (3) the most accurate measurement of the large-scale distribution and environmental dependence of angular momentum vectors, both in terms of norm and orientation. All these measurements will represent exquisite tools to build a next generation of galaxy evolution models.
1 Introduction
1.1 Importance of angular momentum

Understanding how galaxies form and evolve is one of the central topics in explaining the Universe we observe today. Pioneering studies (Fall & Efstathiou 1980; Quinn & Zurek 1988; Mo et al. 1998) have long stressed that galaxy properties are primarily driven by two physical quantities: mass and angular momentum (spin). Two recent advances have significantly increased our ability to understand the role of angular momentum. First, increased computing power and enhanced modelling of stellar feedback finally allow the simulation of galaxies with realistic angular momenta (Governato et al. 2010; Agertz et al. 2011; Guedes et al. 2011; Brooks et al. 2011). Second, enormous progress in kinematic observations, via optical integral field spectroscopy (IFS, see Glazebrook 2013) and radio/millimetre interferometry (e.g. using the VLA and ALMA), now yield the first precision-measurements of spin in controlled galaxy samples.
The new fields of research now accessible via angular momentum studies range from sub-galactic astrophysics (i.e., the study of angular momentum feedback, spin alignment of individual components, warped disks) to global galaxy evolution studies and large-scale cosmology. The next two paragraphs discuss two fruitful examples that are by no means meant to be exhaustive.
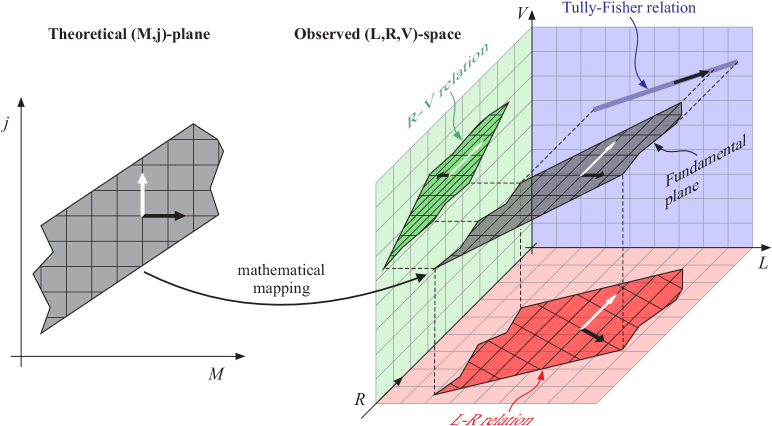
In the context of galaxy evolution studies, a major result of recent kinematic observations is that the shape of galaxies is tightly linked to their angular momentum and that the historical classification of galaxies by stellar or baryon mass and Hubble type can instead be substituted for a more physically motivated classification by and baryon/stellar angular momentum (Cappellari et al. 2011; Romanowsky & Fall 2012; Obreschkow & Glazebrook 2014). This is illustrated in Fig. 1a for spiral galaxies, where we have introduced the specific angular momentum (not to be confused with variations of the spin parameter , also sometimes called ‘specific angular momentum’). Moreover, theoretical models reveal that the most important scaling relations of spiral galaxies, the mass-size-velocity scalings, can be understood as mappings of the (M,j)-plane into three dimensions (Fig. 2). Finally, angular momentum must play a fundamental role in star formation, since it sets the disk pressure, regulating the conversion of atomic gas to molecular gas and stars. The preliminary analysis in Figs. 1b and 1c confirms that in star-forming galaxies is significantly correlated with the cold gas fraction and gas depletion time. This correlation had to be expected, to first order, because is inversely proportional to the disk surface density (details in Obreschkow & Glazebrook), which affects the conversion rate of \hato H2 and stars.

In a cosmological context, much progress is to be made by analysing the large-scale (Mpc, comoving) distribution of galaxies as a function of kinematic properties, in simulated and observed datasets. In fact, the large-scale distribution of angular momentum, both in terms of norm and orientation, contains information on the mechanisms of angular momentum growth by cosmic tides (White 1984) and the redistribution of angular momentum by galaxy coalescence. Empirical investigations using the SDSS survey revealed that spiral and elliptical galaxies obey opposite correlations with filaments (Jones et al. 2010), hinting at the importance of the orbital angular momentum involved in the merger-based formation of ellipticals. As for the norm of , Fig. 3 shows a state-of-the-art analysis of the galaxy-galaxy correlation function for two samples of low and high , relative to the mean - relation. Although the models (lines) appear consistent with the observations (points) within the observational uncertainties, the latter are currently too large to verify the predicted enhanced clustering of the low-, subsample.
1.2 Objective of this paper
Having illustrated some of the importance of angular momentum in galaxies (Section 1.1), the remaining objective of this paper is to demonstrate the world-leading potential of the SKA in this field due to its unprecedented ability to detect neutral atomic hydrogen (\ha) via 21cm interferometry. In fact, kinematic maps of \hacombined with optical images allow the stellar/baryon of disk galaxies to be measured within (Obreschkow & Glazebrook 2014) – the most accurate measurements to-date. The advantage of H I data relies in the fact that H I naturally resides at large disk radii (about twice as large as stars), such that the radii that maximally contribute to the H I mass are similar to those that maximally contribute to angular momentum ().
Section 2 explains how both spatially resolved kinematic \hamaps and unresolved \haline profiles can be used to measure the angular momentum in disk galaxies. Simulation-based modelling in Section 3 reveals that already the SKA1 will increase the numbers of good kinematic \ha maps and unresolved \ha detections by about two orders of magnitude relative to the current state-of-the-art (e.g. THINGS, HIPASS, ALFALFA). Explicit numbers of angular momentum measurements are calculated for different benchmark survey scenarios with well-defined observing parameters. A brief discussion and summary are presented in Section 4.
2 Methods of Measuring Angular Momentum
This chapter presents different ways of measuring the stellar/baryon angular momentum of disks using 21cm radio data. We will restrict this discussion to the measurement of the norm , however, using the inclination+chirality of the disk (from images or kinematic maps), the norm can be converted to the vector . With respect to the centre of mass, is defined as
| (1) |
where is the position vector of the mass element relative to the centre of mass and denotes the velocity in an inertial frame. In principle, can be measured for different baryonic components, including the atomic and molecular material of the disk, but often only the stellar component is considered due to its dominance of the disk angular momentum in nearby galaxies (e.g. Obreschkow & Glazebrook 2014, Table 1).
Method 1: Precision Measurement (requiring 21cm maps and resolved optical images)
In the approximation of a disk with circular orbits, the norm of the angular momentum relative to the centre of gravity can be rewritten as
| (2) |
and the specific angular momentum as
| (3) |
where is the norm of the circular velocity at , and is the azimuthally averaged mass surface density of the considered baryonic component. Note that , and have to be deprojected (i.e., reconstructed from observations of an inclined disk) assuming circular orbits. The use of axially averaged surface densities has the advantage of increasing the signal-to-noise in the faint outer part of the disk. This axial averaging, does not, in fact, lead to errors if the surface density were not axially symmetric, as long as the velocity field is axially symmetric.
In practice, the surface density is measured from optical images (for stellar ) or from more complex multi-wavelength images (for baryon ). In turn, can be measured from kinematic maps. In 16 regular disk galaxies of the THINGS survey (Leroy et al. 2008), axially averaged data of the stellar and baryon (from optical+CO+\haimaging) and (from \hamaps) is available at sub-kpc resolution out to exponential disk scales. This extremely deep data enabled us to study the convergence of the stellar and baryon as a function of in detail (see Fig. 4). For these 16 galaxies and are converged to much less than , reducing the overall uncertainties of to 3%-5%.
Figure 4 highlights the key challenge of such precision measurements of angular momentum: the exquisite surface brightness sensitivity requirement. The data reveals that local disk galaxies need to be kinematically mapped to galactocentric radii of , on average, in order to capture 90% of the stellar angular momentum. For IFS surveys, this is an extreme requirement, given that the majority of galaxies in current IFS surveys are mapped to less than . Pushing from to corresponds to an increase of the surface brightness sensitivity by magnitudes, i.e. a -times increase in observing time. In turn, \ha maps almost by default extend to at least , because the \hagas is naturally situated at larger radii than the stars.

Method 2: Approximation (requiring global 21cm profiles and optical images)
If \hakinematic maps are unavailable, the simplest assumption to use is that galactic disks are objects rotating at constant velocity with exponentially declining surface density of scale length . In this model, the specific angular momentum is exactly according to Equation (3). In practice, the scale radius of the stellar disk can be estimated from optical images, and for non-dwarf galaxies the asymptotic circular velocity (now considered the sole velocity) is well approximated as half the \halinewidth , corrected for the inclination . Thus,
| (4) |
A detailed comparison of this approximation against high-precision measurements of the stellar from the sub-kpc kinematic maps of the THINGS sample revealed that Eq. (4) recovers the ‘true’ with an observational error of about 40% (standard deviation, see Section 2.4 in Obreschkow & Glazebrook 2014). Romanowsky & Fall (2012) demonstrated that this is just good enough to evidence a systematic angular momentum dependence of morphology within regular late-type galaxies. However, at this stage it is not yet clear to what extent this conclusion holds for galaxies with poorly defined or inexistent asymptotic velocities.
Method 3: Approximation (requiring global 21cm profiles and IFS velocity maps)
The biggest drawback of the approximation method 2 is that the errors of are correlated with the stellar/baryon mass as a result of the rotation curve shape being correlated to (de Blok et al. 2008). To bypass this limitation, the assumption of a constant rotation velocity can be substituted for a variable velocity model (Boissier et al. 2003), where now denotes the asymptotic velocity at large radii , and is the scale-length of the rotation curve. Since most \hais generally situated at radii much larger than , the velocity remains well approximated by in this model. Convolving with an exponential surface density in Equation (3), results in
| (5) |
This equation differs from Equation (4) by the right-most factor that depends on . Thus, this method requires a measurement of , representing the characteristic scale of the inner part of the rotation curve. Velocity maps from optical IFS data are well-suited for this measurement, even if limited to radii of . Obreschkow & Glazebrook (2014) showed that Equation (5) increases the accuracy relative to Equation (4) by a factor , to a relative error on of with no significant correlation to . Like in method 2, it is not yet fully established to what extent this method works for galaxies with poorly defined or inexistent asymptotic velocities, such as dwarfs.
3 Assessment of SKA Capabilities
3.1 Modelling of galaxies and detection rates
For the following performance calculations we draw a 100 deg2 mock cone from the S3-SAX simulation (Obreschkow et al. 2009a, b), truncated radially to redshifts below , the distance limit for \haset by the 650 MHz lower limit of SKA1-SUR band 2. This simulation is publicly available and has been verified against local observations in terms of the \hamass function (Obreschkow et al. 2009a), the \havelocity function (Obreschkow et al. 2013), the Tully-Fisher relation (Obreschkow et al. 2009a), and the \halarge-scale clustering (Fig. 3).
A galaxy in the mock cone is considered detected sufficiently well to measure linewidths if its peak flux density – the flux density at the horns of a typical \haprofile – exceeds 5-times the RMS channel noise ( channels in observer-frame). Out of all the galaxies detected in this sense, we determine the subsample for which a GAMA-like survey can detect and spatially resolve the optical counterparts to measure the disk radius and inclination. Explicitly, this subsample is defined by the additional selection criteria and . These are the minimal criteria required for an approximate angular momentum measurement via ‘Method 2’. Tables 3.2–3.2 show the numbers of galaxies in this subsample, as well as their median redshift.
Of particular interest for angular momentum science are those galaxies with kinematic \hamaps that are good enough to allow precision measurements of angular momentum via Method 1. Here, we say that a galaxy has a ‘good kinematic map’, if two criteria are met:
-
1.
The \ha-half-mass radius spans more than 5 synthesised beams, i.e. the \hadisk is resolved in beams. (Velocity measurements in 5 galactocentric rings are roughly the minimum requirement for a robust fit of kinematic models.)
-
2.
The average flux per beam inside the \ha-half-mass radius exceeds 10-times the RMS beam noise ( channels). (This condition approximately corresponds to a 5-sigma column sensitivity limit of , although the exact value depends slightly on the \hasurface density profiles of the galaxies detected in the respective survey scenarios.)
This definition of a ‘good kinematic map’ ensures a measurement of the stellar/baryon specific angular momentum at less than 10% uncertainty (down to 3%-5% for THINGS-like quality), provided stellar surface density maps from optical imaging. A subtle aspect is the choice of the synthesised beam size (i.e. the weighting of the baselines). The resolution-criterion (1) favours small beams, whereas the signal/noise-criterion (2) demands large beams. To optimise the case, we have determined the number of good kinematic maps as a function of the beam FWHM (see Fig. 5). Table 1 shows the maximally achievable number of good kinematic maps and the corresponding beam FWHM. These FWHM are consistent with those found by De Blok et al. (2014) for a \hacolumn sensitivity of (5-sigma level with channels).
 |
 |
3.2 SKA1
To predict the capabilities of the SKA1, as specified in the System Baseline Design (Dewdney et al. 2013), we adopt the reference survey scenarios considered at the \haScience Assessment Workshop (September 2013), but ignore the surveys dedicated to \haabsorption and to the local ISM. Our sensitivity estimations build on a telescope simulation (described in Popping et al. 2014), assuming observations at a declination of . The respective RMS noise levels per beam for an 8h integration with channels (observer-frame) are approximately 0.1 mJy (SKA1-MID) and 0.25 mJy (SKA1-SUR). These noise levels are reasonably constant ( variations) across the ranges of frequency and beam size relevant to this analysis. The resulting sensitivities of the reference surveys are listed in Table 3.2.
| Telescope | SKA1-MID | SKA1-SUR | ||
| Survey mode | Ultra-deep | Wide | Intermediate | Deep |
| , | , | , | , | |
| FoV | 18 | 18 | 18 | |
| Number of pointings | 6 | 1,700 | 170 | 17 |
| Effective int. time | 10 | 100 | 1,000 | |
| Beam noise [mJy] at fixed rest-frame of | ||||
| Number of line detections, | 22,000 | 6,000,000 | 2,500,000 | 1,100,000 |
| Median | 0.25 | 0.06 | 0.11 | 0.19 |
| Number of line detections, | 9,300 | 2,200,000 | 980,000 | 440,000 |
| Median | 0.20 | 0.04 | 0.09 | 0.14 |
| … and | 2,100 | 1,800,000 | 650,000 | 160,000 |
| Median | 0.19 | 0.04 | 0.09 | 0.16 |
| Number of good kinematic maps | 30 | 3,900 | 3,600 | 1,900 |
| Optimal beam FWHM | 2.5 | 9.3 | 5.3 | 3.0 |
Table 1 confirms that wide-field surveys detect a larger number of sources than deep surveys. The wide-field survey with SKA1-SUR will increase both the number of global \haline detections and the number of ‘good kinematic maps’ by about two orders of magnitude with respect to the state-of-the-art (e.g. THINGS, HIPASS, ALFALFA). Explicitly, about 3,900 galaxies will be useable for a precision angular momentum measurement via method 1, while 1,800,000 galaxies will be useable for an approximate angular momentum measurement via method 2 – provided sufficient optical counterparts.
3.3 Early phase SKA1 (50% SKA1)
Table 3.2 shows the results for the same analysis as in §3.2, but assuming half the sensitivity for the SKA1. Halving the sensitivity of the SKA1 reduces the number of useable line detections, as well as the number of good kinematic maps by about a factor two, depending on the survey strategy.
3.4 SKA2
Finally, we consider the SKA2, consisting of a MID array with 5-times111For SKA2, a sensitivity increase of a factor of 10 is assumed, but this refers to the natural sensitivity. A sensitivity loss of 50% has to be applied in addition due to the tapering used (see Braun, 2014, imaging document). the sensitivity of SKA1-MID (above 350 MHz) and 20-times the instantaneous field-of-view (FoV). This results in a FoV of at , larger than the of the ultra-deep reference survey for SKA1-MID. Hence, we increase this survey area by a factor 20 to . The fact that the SKA2 also allows much higher spatial resolution than SKA1-MID is relevant, since the analysis of the optimal beam size in Fig. 5 indeed favours SKA2 to work at higher spatial resolution than SKA1-MID to maximise the number of good kinematic \ha maps.
4 Discussion and Conclusions
This paper demonstrates that the SKA will be the best machine to conduct world-leading angular momentum science. In fact, kinematic \ha maps from 21cm interferometry, combined with optical images, allow the specific angular momentum of disks to be measured within 3%-5% uncertainty (Obreschkow & Glazebrook 2014) – the most accurate measurements to-date. It is important to emphasise that \ha maps outperform optical IFS maps due to the fact that only \ha(not stars) resides where most of the stellar/baryon angular momentum resides. This feature also allows us to measure to a lesser precision from spatially unresolved \ha emission lines combined with spatially resolved optical images.
Already the SKA1 will increase the number of kinematic \ha maps, as well as the number of global \haline profiles useable for angular momentum measurements by two orders of magnitude compared to the state-of-the-art. It will be challenging to match the millions of unresolved \hadetections with sufficiently many and sufficiently resolved optical counterparts. Our analysis suggests that a seeing-limited ( resolution) 3-sky imaging+redshift survey at the depth of the GAMA survey provides enough optical counterparts to determine the specific angular momenta of millions of galaxies (using Method 2) and thousands of galaxies (using Method 1).
Some science examples enabled by angular momentum measurements with the SKA include
-
•
a very robust determination of the two-dimensional distribution in the -plane of galaxy samples with well-described completeness,
-
•
the largest, systematic measurement of the relationship between , , and tertiary galaxy properties (morphology, gas fraction, depletion time),
-
•
the most accurate measurement of the large-scale distribution, including environment-dependence, of angular momentum, both in terms of norm and orientation.
These examples are by no means exhaustive, but they are good illustrations of powerful future measurements to test and improve hydrodynamical simulations of galaxies and to build a next generation of models of galaxy evolution.
Acknowledgements
We thank the referees, Erwin de Blok and Paolo Serra, for very insightful and helpful comments.
References
- Agertz et al. (2011) Agertz, O., Teyssier, R., & Moore, B. 2011, MNRAS, 410, 1391
- Boissier et al. (2003) Boissier, S., Prantzos, N., Boselli, A., & Gavazzi, G. 2003, MNRAS, 346, 1215
- Brooks et al. (2011) Brooks, A. M., Solomon, A. R., Governato, F., et al. 2011, Astrophys. J. , (7) 28, 51
- Cappellari et al. (2011) Cappellari, M., Emsellem, E., Krajnović, D., et al. 2011, MNRAS, 413, 813
- De Blok et al. (2014) De Blok, W., Fraternali, F., Heald, G., et al. 2014, in ”The Interstellar Medium in Galaxies” in proceedings of ”Advancing Astrophysics with the Square Kilometre Array”, PoS(AASKA14)129
- de Blok et al. (2008) De Blok, W. J. G., Walter, F., Brinks, E., et al. 2008, AJ, 136, 2648
- Dewdney et al. (2013) Dewdney, P., Turner, W., Millenaar, R., et al. 2013, SKA Organisation
- Doyle & Drinkwater (2006) Doyle, M. T. & Drinkwater, M. J. 2006, MNRAS, 372, 977
- Fall & Efstathiou (1980) Fall, S. M. & Efstathiou, G. 1980, MNRAS, 193, 189
- Glazebrook (2013) Glazebrook, K. 2013, Publications of the Astronomical Society of Australia, 30, 56
- Governato et al. (2010) Governato, F., Brook, C., Mayer, L., et al. 2010, Nat, 463, 203
- Guedes et al. (2011) Guedes, J., Callegari, S., Madau, P., & Mayer, L. 2011, Astrophys. J. , (7) 42, 76
- Jones et al. (2010) Jones, B. J. T., van de Weygaert, R., & Aragón-Calvo, M. A. 2010, MNRAS, 408, 897
- Leroy et al. (2008) Leroy, A. K., Walter, F., Brinks, E., et al. 2008, AJ, 136, 2782
- Mo et al. (1998) Mo, H. J., Mao, S., & White, S. D. M. 1998, MNRAS, 295, 319
- Obreschkow et al. (2009a) Obreschkow, D., Croton, D., DeLucia, G., Khochfar, S., & Rawlings, S. 2009a, Astrophys. J. , (6) 98, 1467
- Obreschkow & Glazebrook (2014) Obreschkow, D. & Glazebrook, K. 2014, Astrophys. J., 784, 26
- Obreschkow et al. (2009b) Obreschkow, D., Klöckner, H., Heywood, I., Levrier, F., & Rawlings, S. 2009b, Astrophys. J. , (7) 03, 1890
- Obreschkow et al. (2013) Obreschkow, D., Power, C., Bruderer, M., & Bonvin, C. 2013, Astrophys. J. , (7) 62, 115
- Popping et al. (2014) Popping, A., Meyer, M., Staveley-Smith, L., et al. 2014, in ”The Intergalactic Medium and the Cosmic Web” in proceedings of ”Advancing Astrophysics with the Square Kilometre Array”, PoS(AASKA14)132
- Quinn & Zurek (1988) Quinn, P. J. & Zurek, W. H. 1988, Astrophys. J. , (3) 31, 1
- Romanowsky & Fall (2012) Romanowsky, A. J. & Fall, S. M. 2012, ApJS, 203, 17
- White (1984) White, S. D. M. 1984, Astrophys. J. , (2) 86, 38