Far-infrared observations of an unbiased sample of gamma-ray burst host galaxies
Abstract
Gamma-ray bursts (GRBs) are the most energetic phenomena in the Universe; believed to result from the collapse and subsequent explosion of massive stars. Even though it has profound consequences for our understanding of their nature and selection biases, little is known about the dust properties of the galaxies hosting GRBs. We present analysis of the far-infrared properties of an unbiased sample of 20 BeppoSAX and Swift GRB host galaxies (at an average redshift of ) located in the Herschel Astrophysical Terahertz Large Area Survey, the Herschel Virgo Cluster Survey, the Herschel Fornax Cluster Survey, the Herschel Stripe 82 Survey and the Herschel Multi-tiered Extragalactic Survey, totalling deg2, or % of the sky in total. Our sample selection is serendipitous, based only on whether the X-ray position of a GRB lies within a large-scale Herschel survey – therefore our sample can be considered completely unbiased. Using deep data at wavelengths of 100 – 500m, we tentatively detected 1 out of 20 GRB hosts located in these fields. We constrain their dust masses and star formation rates (SFRs), and discuss these in the context of recent measurements of submillimetre galaxies and ultraluminous infrared galaxies. The average far-infrared flux of our sample gives an upper limit on SFR of Myr-1. The detection rate of GRB hosts is consistent with that predicted assuming that GRBs trace the cosmic SFR density in an unbiased way, i.e. that the fraction of GRB hosts with is consistent with the contribution of such luminous galaxies to the cosmic star formation density.
keywords:
gamma-ray burst: general – dust, extinction – galaxies: high redshift – galaxies: star formation – infrared: galaxies1 Introduction
Long-duration gamma-ray bursts (GRBs) have, in many cases, been proven to be connected with supernovae (e.g. Galama et al., 1998; Hjorth et al., 2003), suggesting that their progenitor stars are short-lived (Heger et al., 2003). As a result, GRBs are expected to be located in regions undergoing active star formation, making GRBs potentially ideal tracers of star formation across a large range of redshifts and helping us to chart the star-forming history of our Universe (e.g. Wijers et al., 1998; Yonetoku et al., 2004).
Many properties of GRBs are useful for accomplishing the above task. Their extremely high luminosity at gamma-ray wavelengths allows for their detection out to very high redshift, with minimal extinction from gas or dust. The average GRB redshift is (Fynbo et al., 2009; Jakobsson et al., 2006, 2012; Hjorth et al., 2012), but in principle GRBs should be visible out to – (Lamb & Reichart, 2000), and in practice they have been observed out to (Tanvir et al., 2009; Salvaterra et al., 2009; Cucchiara et al., 2011). Moreover, detections of GRBs are independent of the luminosity of their host galaxies, which allows us to probe fainter galaxies than in typical flux-limited samples (e.g. Tanvir et al., 2012). Previous studies have found that GRB hosts are mostly faint and blue (Le Floc’h et al., 2003), with the GRB occurring in (rest-frame) UV-bright regions (Bloom et al., 2002; Fruchter et al., 2006; Leloudas et al., 2010; Leloudas et al., 2011), which is consistent with active star formation. More recent studies (e.g. Greiner et al., 2011; Krühler et al., 2011; Rossi et al., 2012; Perley et al., 2013) show that GRB hosts span a wider range of properties, suggesting that previous optically-selected host surveys were biased towards these faint blue hosts.
Before we can use GRBs to quantitatively trace star formation across cosmic history, such biases of GRB and GRB host galaxy samples must be well understood. Using The Optically Unbiased GRB Host survey (TOUGH; Hjorth et al., 2012), Michałowski et al. (2012) and Perley et al. (2014) analysed the radio-derived star formation rates (SFRs) of GRB hosts at . They found that the distributions of SFRs of GRB hosts were consistent with that of other star-forming galaxies at , suggesting that GRBs may be able to trace cosmic star formation; however they made clear that further study of potential biases in the morphology and metallicity of GRB hosts is required. Similarly, Hunt et al. (2014) and Schady et al. (2014) concluded that SFRs in GRB hosts are consistent with other star-forming galaxies, and found no strong evidence for GRB hosts being biased tracers of the global star formation rate density (SFRD). However, their sample favoured infrared-bright hosts. In their study of the hosts of dust-obscured GRBs, Perley et al. (2013, 2014) found that they are not massive enough to bring the overall GRB host population into the expected territory of an unbiased SFR-tracing population for . They found that GRB hosts appear to be biased towards low-mass galaxies and suggested that the GRB rate relative to SFR is highly dependent on host-galaxy environment at this redshift, and highlighted that further studies of metallicity are needed. These findings are corroborated by Boissier et al. (2013).
Here we attempt to study the distribution of SFRs of GRB hosts using the unbiased sample of GRBs that are located inside wide-area Herschel111Herschel is an ESA space observatory with science instruments provided by European-led Principal Investigator consortia and with important participation from NASA. (Pilbratt et al., 2010) surveys. It is important to study this aspect at both ultraviolet/optical and infrared wavelength, since these give access to unobscured and dust-obscured star formation activity, respectively. The latter is still poorly understood for GRB hosts, where deep observations and detections have been largely limited to low redshifts and biased samples (Frail et al., 2002; Berger et al., 2003; Tanvir et al., 2004; de Ugarte Postigo et al., 2012; Wang et al., 2012; Hatsukade et al., 2014; Hunt et al., 2014; Michałowski et al., 2014; Schady et al., 2014; Symeonidis et al., 2014). The objectives of this paper are to: (1) measure the dust-obscured SFRs and dust masses of GRB host galaxies using an unbiased sample; and (2) test whether or not GRBs are unbiased tracers of cosmic star formation at .
The layout of this paper is as follows. Section 2 contains an overview of the Herschel surveys whose data we used to acquire our sample. We then discuss the measured properties of the GRB hosts in Section 3, before moving on to a more extensive discussion of these properties as compared to recent analyses of other galaxy types in Section 4. We provide out conclusions in Section 5.
We use a cosmological model of =, and , and a Salpeter (Salpeter, 1955) initial mass function.
| Survey | Area | Total noise (mJy beam-1)a | Ref. | ||||
| (deg2) | 100 | 160 | 250 | 350 | 500 | ||
| H-ATLAS | 600 | 25 | 30 | 7.2 | 8.1 | 8.8 | 1, 2 |
| HeFoCS | 16 | 9.9 | 9.2 | 8.9 | 9.4 | 10.2 | 3 |
| HerMESb | 100 | – | – | 6.4 | 6.8 | 7.6 | 4 |
| HerSc | 79 | – | – | 10.7 | 10.3 | 12.3 | 5 |
| HeViCS | 84 | 23 | 13 | 6.6 | 7.3 | 8.0 | 6 |
a The wavelength in microns of each band is given in the header.
b HerMES data have different noise levels depending upon the field surveyed. The average noise levels for each band are presented here, given in reference (4).
c Coverage of the HerS maps is not uniform. The average noise levels are presented here for the deeper part of the survey (where GRB 060908 is located, see Table 2 and reference 5).
Hyphens indicate that data were not taken or not available in that band.
References: (1) Ibar
et al. (2010); (2) Pascale
et al. (2011); (3) Fuller
et al. (2014); (4) Smith
et al. (2012); (5) Viero
et al. (2014), and (6) Auld et al. (2013).
2 Sample and Data
| GRB | 90% error | Herschel | Reference | |||
|---|---|---|---|---|---|---|
| (J2000) | (J2000) | (arcsec) | Field | |||
| 990308 | 185.7976667 | 6.7347500 | 0.3 | HeViCS | Schaefer et al. 1999 | |
| 050412 | 181.1053333 | 1.2001667 | 3.7 | GAMA12 | Hjorth et al. 2012 | |
| 050522 | 200.1440417 | 24.7890833 | 3.8 | NGP | Butler 2007 | |
| 051001 | 350.9530417 | 31.5231389 | 1.5 | SGP | 2.4296 | Butler 2007; Hjorth et al. 2012 |
| 060206 | 202.9312917 | 35.0507778 | 0.8 | NGP | 4.048 | Butler 2007; Fynbo et al. 2009 |
| 060908 | 31.8267500 | 0.34227778 | 1.4 | HerS | 1.884 | Hjorth et al. 2012; Jakobsson et al. 2012 |
| 070611 | 1.99241667 | 29.7554722 | 1.8 | SGP | 2.0394 | Butler 2007; Hjorth et al. 2012 |
| 070810A | 189.9635000 | 10.7508889 | 1.4 | HeViCS | 2.17 | Hjorth et al. 2012; Schady et al. 2012 |
| 070911 | 25.8095417 | 33.4841389 | 3.1 | SGP | Butler 2007 | |
| 071028B | 354.1617917 | 31.6203611 | 0.3 | SGP | Clemens et al. 2011 | |
| 080310 | 220.0575000 | 0.1748889 | 0.6 | GAMA15 | 2.42 | Littlejohns et al. 2012; Fox et al. 2008 |
| 091130B | 203.1481250 | 34.0885278 | 0.6 | NGP | Butler 2007 | |
| 110128A | 193.8962917 | 28.0654444 | 0.4 | NGP | 2.339 | Butler 2007; Sparre et al. 2011 |
| 110407A | 186.0313917 | 15.7118417 | 1.0 | HeViCS | Chuang et al. 2011 | |
| 111204A | 336.6283750 | 31.3748056 | 1.9 | SGP | Sonbas et al. 2011 | |
| 120703A | 339.3567083 | 29.7232500 | 0.5 | SGP | Xu et al. 2012 | |
| 120927A | 136.6137500 | 0.4161944 | 1.4 | GAMA09 | Beardmore et al. 2012 | |
| 121211A | 195.5332917 | 30.1485000 | 0.5 | NGP | Chester & Mangano 2012 | |
| 130502A | 138.5689583 | 0.1233056 | 1.5 | GAMA09 | Beardmore et al. 2013 | |
| 140102A | 211.9193750 | 1.3332778 | 0.5 | GAMA15 | Hagen 2014 | |
| 140515A | 186.0650000 | 15.1045556 | 1.8 | HeViCS | 6.327 | Butler 2007; Chornock et al. 2014 |
The Herschel Astrophysical Terahertz Large Area Survey (H-ATLAS; Eales et al., 2010) is the largest open-time survey conducted by the Herschel Space Observatory. It covers approximately deg2 in the far-infrared (FIR) and submillimetre wavelengths, using PACS (m, m; Poglitsch et al. 2010) and SPIRE (m, m and m; Griffin et al. 2010). The Herschel Virgo Cluster Survey (HeViCS; Davies et al., 2010) used PACS and SPIRE to survey a total area of deg2 (Auld et al., 2013; Baes et al., 2014) of the Virgo galaxy cluster, with diminishing sensitivities beyond the central deg2. Similarly, the Herschel Fornax Cluster Survey (HeFoCS; Davies et al., 2013) used PACS and SPIRE to survey a total area of deg2 in the Fornax cluster. The Herschel Stripe 82 Survey (HerS; Viero et al., 2014) covered deg2 along the Sloan Digital Sky Survey (SDSS; York et al., 2000) ‘Stripe 82’ field using SPIRE. The Herschel Multi-tiered Extragalactic Survey (HerMES; Oliver et al., 2012; Roseboom et al., 2010; Smith et al., 2012; Viero et al., 2013; Wang et al., 2014) used SPIRE to observe 29 fields, covering deg2 in total.
In this study, we use H-ATLAS GAMA, NGP and SGP data (Ibar et al., 2010; Pascale et al., 2011; Rigby et al., 2011; Smith et al., 2011, Bourne et al. in prep, Valiante et al. in prep.), all observed HeViCS fields (V1 to V4), the HeFoCS field (Davies et al., 2013), HerS maps222www.astro.caltech.edu/hers/ and the second major HerMES data release333hedam.lam.fr/HerMES/ (Smith et al., 2012). It is important to note that each of these surveys used different numbers of cross-scans with the instruments aboard Herschel, resulting in different levels of sensitivity. These differences are summarized in Table 1.
Butler (2007) presented a catalogue of refined X-ray positions of Swift/XRT (Gehrels et al., 2004; Burrows et al., 2005) GRBs444The catalogue (butler.lab.asu.edu//Swift/xrt_pos.html) is constantly updated. We accessed the catalogue on 2014 July 25. At this time, it had entries.. Half of the 90% confidence error region radii are arcsec. It has been shown by Fynbo et al. (2009) and Hjorth et al. (2012) that such X-ray selection, as opposed to optical selection, does not introduce any bias, as long as close to 100% of the gamma-ray triggered GRBs then have good X-ray localizations obtained for them. Indeed, nearly all GRBs are detected in X-ray when prompt observations are available.
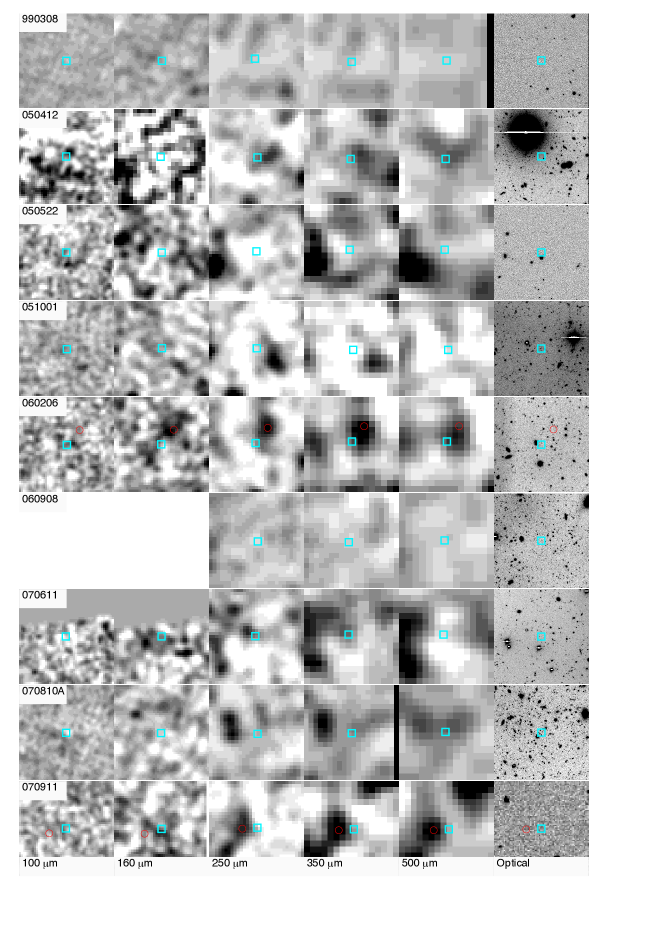
We selected all GRBs with X-ray positions (Butler, 2007) inside the H-ATLAS, HeViCS and HerS fields, which amounted to 21 GRBs. GRB 990308 occurred within the HeViCS field (Schaefer et al., 1999). As this is a pre-Swift burst, in order to not corrupt the unbiased nature of our sample we simply provide our measurements of its flux density here, and it does not enter into any other calculations. No GRB positions overlapped with any HeFoCS or HerMES fields. The catalogue contains GRBs over the entire sky, so in we expect to find GRBs, which is close to the number of that we found (i.e. excluding GRB 990308). Our sample selection process may be considered unbiased, since the only selection criterion applied was positional. Table 2 shows the positions and any known redshifts of the GRBs in our sample; Fig. 1 shows the Herschel data. For seven of our GRBs redshifts are known, and only for these cases do we provide physical properties.


3 Results
We determined the FIR flux densities of GRB hosts by fitting Gaussian functions at the GRB positions in the Herschel maps using the respective beam sizes555These were , , , and arcsec for the , , , and m bands, respectively.. If a GRB host appeared to be detected at we further investigated possible blending. We identified any obvious optical or FIR sources clearly distinct from the GRB host, and repeated the flux density measurement by fitting simultaneously two (or more) Gaussian functions at the GRB positions and at the positions of these other sources (this was performed for GRBs 060206, 070911, 071028B, 091130 and 110128A). For GRB 110128A in the deep optical image from de Ugarte Postigo et al. (2011) and Sparre et al. (2011) we found a low- galaxy contributing to the Herschel flux density close to the GRB position (red circle on Fig. 1). No such obvious optical source was found close to the positions of GRB 060206 (Thoene et al., 2007), 071028B and 091130B (GAMA; Driver et al., 2009) but on the m images we identified sources that are clearly distinct from the GRB hosts.
The flux densities in each band are presented in Table 3. Noise was estimated by measuring the flux at 100 random positions around the GRB position (and in the same way as for the GRB position) and the error is the clipped mean of these measurements; it was consistent with being dominated by the confusion noise (Nguyen et al., 2010).
Only GRB 091130B was located close to a source from the H-ATLAS catalogue ( arcsec separation, corresponding to half of the beam size at ). This source (HATLAS J133235.2+340526) has measured flux densities of , and mJy in the , and m bands, respectively (Rigby et al., 2011). An association between the GRB and the source is unlikely – their arcsec separation is large compared to the arcsec positional accuracy of the Herschel source.
SFRs were calculated according to Kennicutt (1998), based on the infrared luminosity integrated over m using the SED of ULIRG Arp 220 (Silva et al., 1998), scaled to the flux densities of our GRB hosts. The use of Arp 220 is appropriate, since its dust temperature is close to that of typical GRB hosts (Priddey et al., 2006; Michałowski et al., 2008; Michałowski et al., 2009, 2014; Watson et al., 2011; Hatsukade et al., 2014; Hunt et al., 2014; Symeonidis et al., 2014). However, since we probe close to the peak of dust emission, the choice of the template does not influence the results substantially. For example, the median difference between the SFRs calculated using the SED of Arp 220 and the SED of a typical SMG (Michałowski et al., 2010) is %.
To derive dust masses of GRB hosts, we assumed K (a similar temperature to Arp 220; Klaas et al., 1997; Dunne et al., 2000; Lisenfeld et al., 2000; Rangwala et al., 2011), emissivity (which yields conservative upper limits) and a dust absorption coefficient (Silva et al., 1998). Assuming lower K results in masses larger by a factor of . Derived properties of the GRB hosts (at and K) with known redshift are presented in Table 4. Fig. 2 shows the spectral energy distributions of those GRBs with known redshifts, and are overlaid on the SED of Arp 220, which was used to calculate the SFR of each host.
| GRB | F100 | F160 | F250 | F350 | F500 |
|---|---|---|---|---|---|
| (mJy) | (mJy) | (mJy) | (mJy) | (mJy) | |
| 990308 | 13 9 | 7 12 | 1 7 | 2 8 | 2 7 |
| 050412 | 6 13 | 24 18 | 7 7 | 2 8 | 9 7 |
| 050522 | 12 13 | 17 17 | 10 8 | 7 8 | 0 9 |
| 051001 | 10 7 | 3 12 | 5 8 | 4 10 | 6 8 |
| 060206 | 20 14 | 2 20 | 8 8 | 6 11 | 7 9 |
| 060908a | – | – | 8 8 | 3 9 | 2 9 |
| 070611 | 14 20 | 14 20 | 11 5 | 12 6 | 3 7 |
| 070810A | 30 17 | 19 24 | 5 10 | 15 10 | 28 12 |
| 070911 | 8 11 | 22 20 | 9 12 | 3 13 | 7 11 |
| 071028B | 6 14 | 0 20 | 2 9 | 0 8 | 3 10 |
| 080310 | 3 11 | 19 14 | 12 9 | 19 10 | 24 13 |
| 091130 | 9 14 | 23 18 | 11 9 | 4 8 | 4 8 |
| 110128A | 13 14 | 7 18 | 15 8 | 6 9 | 5 9 |
| 110407A | 10 11 | 11 18 | 15 5 | 14 9 | 13 8 |
| 111204A | 23 14 | 34 17 | 17 9 | 3 13 | 5 11 |
| 120703Ab | 33 13 | -39 20 | 4 10 | 0 9 | 4 11 |
| 120927A | 20 13 | 0 22 | 16 11 | 1 10 | 9 12 |
| 121211A | 3 13 | 16 16 | 14 7 | 3 8 | 2 8 |
| 130502A | 22 11 | 7 14 | 10 5 | 21 8 | 31 9 |
| 140102A | 18 12 | 13 17 | 1 8 | 6 9 | 3 8 |
| 140515A | 0 9 | 8 9 | 14 8 | 13 10 | 20 9 |
| NWMc | 2 3 | 4 4 | 3 2 | 2 2 | 3 2 |
| Stacking | 1 3 | 2 4 | 3 2 | 3 4 | 3 2 |
Errors are from the clipped average of the flux densities of random positions around the GRB positions.
a GRB 060908 is inside HerS, a SPIRE-only survey.
b Tentative detection.
c Noise-weighted mean.
Stacked images in the five Herschel bands were obtained by averaging cut-out images around the central pixel corresponding to the J2000 coordinates of each GRB host in the SPIRE and PACS images. Using PSF-filtered images in each band, a region of pixels was extracted around each position, and these images were combined using a weighted mean. Each pixel in the stacked image is the weighted mean of the corresponding pixels from all the cut-outs, weighted by the inverse variance of the flux density measurement at the GRB host position. The size of the stacked images corresponds to and arcsec at each of the five bands, respectively. We did not detect any significant signal at any of the stacked images (flux densities are presented in the last row of Table 3).
4 Discussion
GRBs are closely linked with star-formation, but they can be used as a probe of star formation only if the number of GRBs at a given redshift is proportional to the cosmic SFRD at this epoch. In such a case the distribution of SFRs of GRB hosts should reflect the contribution of galaxies to the SFRD. In particular, the fraction of hosts above some SFR threshold should be equal to the fractional contribution of such luminous galaxies to the SFRD. If the fraction of luminous GRB hosts is lower (higher) than this contribution, then we would conclude that GRBs are biased towards less (more) actively star-forming galaxies.
Integrating the infrared luminosity function of Magnelli et al. (2013) above L () we infer that such galaxies contribute % (a range of 3-24%) to the cosmic SFRD at . If GRBs trace star formation density in an unbiased way, we would expect this percentage of GRB hosts ( hosts) in our sample to be detected, because Herschel sensitivity allows us to detect galaxies with L (assuming the Arp 220 template at – scaled to the limit of –mJy).
Out of our 21 GRB hosts, we found just one tentative detection (%), namely GRB 120703A with a significance of , suggesting that GRBs may trace star-formation density in an unbiased way, at least for redshift (and the expectation of detected hosts is an upper limit, since we are assuming that GRBs in our sample with no redshift information are at similar redshifts as the other ones). This is supporting evidence for the much sought-after relationship between GRB rate and SFR (e.g. Blain & Natarajan, 2000; Lloyd-Ronning et al., 2002; Hernquist & Springel, 2003; Christensen et al., 2004; Yonetoku et al., 2004; Yüksel et al., 2008; Kistler et al., 2009; Elliott et al., 2012; Michałowski et al., 2012; Robertson & Ellis, 2012; Hunt et al., 2014).
However, our analysis suffers from low number statistics as none of our Herschel flux measurements is of high significance, we consider here how our conclusions change if they are not real (% detection rate). That would produce a tension between the data and the expectation that GRBs trace the star formation in an unbiased way at (i.e. % detection rate). This demonstrates that an FIR survey of a larger unbiased sample of GRB hosts is crucial to reach a statistically significant conclusion.
These conclusions are not uncontested. Perley et al. (2013) found a biased correspondence between the GRB host galaxy population and SFRD (at least at ). In their extensive study of the hosts of Swift-observed GRBs, they found that GRB rate is a strong function of host-galaxy properties. In particular, GRB hosts were found to be less massive and bluer than what would be expected if the GRB rate is proportional to SFR in galaxies at (Perley et al., 2013). We probe GRB hosts at higher redshifts, but more significant samples of GRB hosts observed in the FIR are needed to investigate this issue.
The average 2 upper limit of the dust mass for our sample is log(/M☉)– (K). This suggests that GRB hosts are less dusty than SMGs, as Michałowski et al. (2010) found the typical SMG to contain log(/M☉) (also see Chapman et al., 2005; Kovács et al., 2006; Laurent et al., 2006; Coppin et al., 2008; Magnelli et al., 2012; Swinbank et al., 2014). The dust masses of GRB hosts in our sample are only consistent with those of SMGs if we assume a very low temperature of 30K (e.g. Michałowski et al. 2010 found and average temperature of K for SMGs). Calzetti et al. (2000) and Smith et al. (2013) found that dust emission at much lower temperatures (K) could account for a large fraction of total flux in starburst galaxies, but other studies (Priddey et al., 2006; Michałowski et al., 2008; Michałowski et al., 2009, 2014; Symeonidis et al., 2014) suggest this is an unrealistically low temperature for an infrared-bright GRB host (however none of these studies is based on an unbiased GRB sample). Moreover, high dust temperature was found to be typical among Herschel-selected ULIRGs at high redshifts (Symeonidis et al., 2013).
The noise-weighted average of the flux densities at all 20 GRB positions and flux densities measured in the stacked maps are shown in Table 3. At an average GRB redshift of (Hjorth et al., 2014), this corresponds to a 2 limit of SFR () using the Arp 220 template, and 2 limits on dust masses of for K, and for K. Measurements of stacked images provide consistent limits on the dust mass of typical GRB hosts: for K, and for K. The deepest limit on SFR comes from the stacked m-band, giving a typical GRB host SFR of M☉yr-1.
If GRBs trace the cosmic SFRD in an unbiased way, then the average luminosity of GRB hosts should be equal to the average luminosity of other galaxies weighted by their SFRs (because a galaxy with a higher SFR will have a higher probability to host a GRB). From the luminosity function () of Magnelli et al. (2013) we calculated the weighted mean . Assuming this gives , or using the Kennicutt (1998) conversion and assuming the Saltpeter IMF (propagating the errors on luminosity function parameters using the Monte Carlo method). This value is only weakly dependent on the adopted cut-off luminosities, and , as it is mostly constrained by the shape of the luminosity function close to its knee. Again, this value is only away from the limit we measured for GRB hosts (), so we cannot rule out that GRB hosts are simply drawn based on the SFRs from the general population of galaxies, and we highlight that larger samples of unbiased GRB hosts observed at the FIR are needed.
The average flux density suggests that a typical GRB host has a flux below the confusion limit of Herschel, so surveys with better resolution are needed to detect the majority of the population. Such surveys will be undertaken in the future with the Large Millimeter Telescope and Cerro Chajnantor Atacama Telescope.
| GRB | Dust mass (K) | Dust mass (K) | SFR | |
|---|---|---|---|---|
| (108 M☉) | (108 M☉) | (M☉yr-1) | ||
| 051001 | 2.4296 | 11 | 0.9 | 500 |
| 060206 | 4.048 | 24 | 2.7 | 1500 |
| 060908 | 1.884 | 6.2 | 0.7 | 320 |
| 070611 | 2.0394 | 5.1 2.6 | 0.5 0.2 | 280 120 |
| 070810A | 2.17 | 9.8 | 0.9 | 520 |
| 080310 | 2.42 | 11 | 1.0 | 560 |
| 110128A | 2.339 | 9.4 | 0.9 | 550 |
| 140515A | 6.327 | 83 | 4.9 | 2800 |
| NWMa | 2.14 | 1.8 | 0.3 | 114 |
| Stackinga | 2.14 | 2.4 | 0.6 | 114 |
Dust masses calculated assuming emissivity . Errors reflect only statistical uncertainty propagated from the flux density errors, and limits are to .
a These are the properties calculated from the noise-weighted mean flux density of all 21 GRB positions, at an average GRB redshift of (Hjorth
et al. 2014; Section 4).
 |
 |
 |
 |
 |
 |
 |
 |
5 Conclusion
We have measured the FIR flux densities of GRB host galaxies. The sample was selected in a novel, unbiased fashion, in which we used a data base of GRB positions to cross-reference the positions surveyed by the H-ATLAS, HeViCS, HeFoCS, HerMES and HerS data releases. For 8 out of the 20 GRBs, redshifts are available, and for these we were able to calculate or place an upper limit on the SFR and dust mass of the host galaxy. One host was (tentatively) detected, consistent with the contribution of such bright galaxies to the SFRD in the Universe at (Magnelli et al., 2011; Magnelli et al., 2013). This may support the thesis that the GRB rate and SFR are fundamentally related, and that GRBs may trace SFRD in an unbiased way. Analysing a larger sample of GRB hosts selected in such an unbiased way is necessary to give a definite answer on whether this is indeed the case.
Acknowledgements
We thank Daniele Malesani and Christina Thöne for their contributions of additional optical data, and the anonymous referee for their helpful comments, which improved the quality of the paper. MJM acknowledges the support of the UK Science and Technology Facilities Council. NB is supported by the EC FP7 SPACE project ASTRODEEP (Ref. no. 312725). EI acknowledges funding from CONICYT/FONDECYT postdoctoral project N∘:3130504. LD, RJI and SJM acknowledge support from ERC Advanced Grant COSMICISM. JGN acknowledges financial support from the Spanish CSIC for a JAE-DOC fellowship, co-funded by the European Social Fund, by the Spanish Ministerio de Ciencia e Innovacion, AYA2012-39475-C02-01, and Consolider-Ingenio 2010, CSD2010-00064, projects.
The Herschel-ATLAS is a project with Herschel, which is an ESA space observatory with science instruments provided by European-led Principal Investigator consortia and with important participation from NASA. The H-ATLAS website is http://www.h-atlas.org/.
GAMA is a joint European-Australasian project based around a spectroscopic campaign using the Anglo-Australian Telescope. The GAMA input catalogue is based on data taken from the SDSS and the UKIRT Infrared Deep Sky Survey. Complementary imaging of the GAMA regions is being obtained by a number of independent survey programmes including GALEX MIS, VST KIDS, VISTA, VIKING, WISE, Herschel-ATLAS, GMRT and ASKAP providing UV to radio coverage. GAMA is funded by the STFC (UK), the ARC (Australia), the AAO, and the participating institutions. The GAMA website is: http://www.gama-survey.org/.
This research has made use of data from HerMES project (http://hermes.sussex.ac.uk/). HerMES is a Herschel Key Programme utilizing Guaranteed Time from the SPIRE instrument team, ESAC scientists and a mission scientist. The HerMES data were accessed through the Herschel Database in Marseille (HeDaM - http://hedam.lam.fr) operated by CeSAM and hosted by the Laboratoire d’Astrophysique de Marseille.
Funding for SDSS-III has been provided by the Alfred P. Sloan Foundation, the Participating Institutions, the National Science Foundation, and the US Department of Energy Office of Science. The SDSS-III web site is http://www.sdss3.org/.
References
- Ahn et al. (2012) Ahn C. P., et al., 2012, ApJS, 203, 21
- Auld et al. (2013) Auld R. et al., 2013, MNRAS, 428, 1880
- Baes et al. (2014) Baes M. et al., 2014, A&A, 562, A106
- Beardmore et al. (2012) Beardmore A. P., Evans P. A., Goad M. R., Osborne J. P., 2012, GRB Coordinates Network, 13824, 1
- Beardmore et al. (2013) Beardmore A. P., Evans P. A., Goad M. R., Osborne J. P., 2013, GRB Coordinates Network, 14536, 1
- Berger et al. (2003) Berger E., Cowie L. L., Kulkarni S. R., Frail D. A., Aussel H., Barger A. J., 2003, ApJ, 588, 99
- Blain & Natarajan (2000) Blain A. W., Natarajan P., 2000, MNRAS, 312, L35
- Bloom et al. (2002) Bloom J., Kulkarni S., Djorgovski S., 2002, ApJ, 123, 1111
- Boissier et al. (2013) Boissier S., Salvaterra R., Le Floc’h E., Basa S., Buat V., Prantzos N., Vergani S. D., Savaglio S., 2013, A&A, 557, A34
- Burrows et al. (2005) Burrows D. N. et al., 2005, SSRv, 120, 165
- Butler (2007) Butler N., 2007, AJ, 133, 1027
- Calzetti et al. (2000) Calzetti D., Armus L., Bohlin R. C., Kinney A. L., Koornneef J., Storchi-Bergmann T., 2000, ApJ, 533, 682
- Chapman et al. (2005) Chapman S. C., Blain A. W., Smail I., Ivison R. J., 2005, ApJ, 622, 772
- Chester & Mangano (2012) Chester M. M., Mangano V., 2012, GRB Coordinates Network, 14063, 1
- Chornock et al. (2014) Chornock R., Berger E., Fox D. B., Fong W., Laskar T., Roth K. C., 2014, ApJ, submitted
- Christensen et al. (2004) Christensen L., Hjorth J., Gorosabel J., 2004, A&A, 425, 913
- Chuang et al. (2011) Chuang C. J., Lin C. S., Urata Y., Huang K. Y., 2011, GRB Coordinates Network, 11901, 1
- Clemens et al. (2011) Clemens C. et al., 2011, A&A, 529, A110
- Coppin et al. (2008) Coppin K. et al., 2008, MNRAS, 384, 1597
- Cucchiara et al. (2011) Cucchiara A. et al., 2011, ApJ, 736, 7
- Davies et al. (2010) Davies J. I. et al., 2010, A&A, 518, L48
- Davies et al. (2013) Davies J. I. et al., 2013, MNRAS, 428, 834
- de Ugarte Postigo et al. (2012) de Ugarte Postigo A. et al., 2012, A&A, 538, A44
- de Ugarte Postigo et al. (2011) de Ugarte Postigo A., Malesani D., McCormac J., Jakobsson P., 2011, GRB Coordinates Network, 11605, 1
- Driver et al. (2009) Driver S. P., et al., 2009, Astronomy and Geophysics, 50, 12
- Dunne et al. (2000) Dunne L., Eales S., Edmunds M., Ivison R., Alexander P., Clements D. L., 2000, MNRAS, 315, 115
- Eales et al. (2010) Eales S. et al., 2010, PASP, 122, 499
- Elliott et al. (2012) Elliott J., Greiner J., Khochfar S., Schady P., Johnson J. L., Rau A., 2012, A&A, 539, A113
- Fox et al. (2008) Fox A. J., Ledoux C., Vreeswijk P. M., Smette A., Jaunsen A. O., 2008, A&A, 491, 189
- Frail et al. (2002) Frail D. A. et al., 2002, ApJ, 565, 829
- Fruchter et al. (2006) Fruchter A. S. et al., 2006, Nature, 441, 463
- Fuller et al. (2014) Fuller C. et al., 2014, MNRAS, 440, 1571
- Fynbo et al. (2009) Fynbo J. P. U. et al., 2009, ApJS, 185, 526
- Galama et al. (1998) Galama T. J. et al., 1998, Nature, 395, 670
- Gehrels et al. (2004) Gehrels N. et al., 2004, ApJ, 611, 1005
- Greiner et al. (2011) Greiner J. et al., 2011, A&A, 526, A30
- Griffin et al. (2010) Griffin M. J. et al., 2010, A&A, 518, L3
- Hagen (2014) Hagen L. M. Z., 2014, GRB Coordinates Network, 15690, 1
- Hatsukade et al. (2014) Hatsukade B., Ohta K., Endo A., Nakanishi K., Tamura Y., Hashimoto T., Kohno K., 2014, Nature, 510, 247
- Heger et al. (2003) Heger A., Fryer C. L., Woosley S. E., Langer N., Hartmann D. H., 2003, ApJ, 591, 288
- Hernquist & Springel (2003) Hernquist L., Springel V., 2003, MNRAS, 341, 1253
- Hjorth et al. (2014) Hjorth J., Gall C., Michałowski M. J., 2014, ApJL, 782, L23
- Hjorth et al. (2012) Hjorth J. et al., 2012, ApJ, 756, 187
- Hjorth et al. (2003) Hjorth J. et al., 2003, Nature, 423, 847
- Hunt et al. (2014) Hunt L. K. et al., 2014, A&A, 565, A112
- Ibar et al. (2010) Ibar Edo; Ivison R. J. et al., 2010, MNRAS, 409, 38
- Jakobsson et al. (2012) Jakobsson P. et al., 2012, ApJ, 752, 62
- Jakobsson et al. (2006) Jakobsson P. et al., 2006, A&A, 447, 897
- Kennicutt (1998) Kennicutt R. C., 1998, Ann. Rev. Astronomy Astrophys., 36, 189
- Kistler et al. (2009) Kistler M. D., Yüksel H., Beacom J. F., Hopkins A. M., Wyithe J. S. B., 2009, ApJL, 705, L104
- Klaas et al. (1997) Klaas U., Haas M., Heinrichsen I., Schulz B., 1997, A&A, 325, L21
- Kovács et al. (2006) Kovács A., Chapman S. C., Dowell C. D., Blain A. W., Ivison R. J., Smail I., Phillips T. G., 2006, ApJ, 650, 592
- Krühler et al. (2011) Krühler T. et al., 2011, A&A, 534, A108
- Lamb & Reichart (2000) Lamb D. Q., Reichart D. E., 2000, ApJ, 536, 1
- Laurent et al. (2006) Laurent G. T. et al., 2006, ApJ, 643, 38
- Le Floc’h et al. (2003) Le Floc’h E. et al., 2003, A&A, 400, 499
- Leloudas et al. (2011) Leloudas G. et al., 2011, A&A, 530, A95
- Leloudas et al. (2010) Leloudas G., Sollerman J., Levan A. J., Fynbo J. P. U., Malesani D., Maund J. R., 2010, A&A, 518, A29
- Lisenfeld et al. (2000) Lisenfeld U., Isaak K. G., Hills R., 2000, MNRAS, 312, 433
- Littlejohns et al. (2012) Littlejohns O. M. et al., 2012, MNRAS, 421, 2692
- Lloyd-Ronning et al. (2002) Lloyd-Ronning N. M., Fryer C. L., Ramirez-Ruiz E., 2002, ApJ, 574, 554
- Magnelli et al. (2011) Magnelli B., Elbaz D., Chary R. R., Dickinson M., Le Borgne D., Frayer D. T., Willmer C. N. A., 2011, A& A, 528, A35
- Magnelli et al. (2012) Magnelli B. et al., 2012, A&A, 539, A155
- Magnelli et al. (2013) Magnelli B. et al., 2013, A&A, 553, A132
- Michałowski et al. (2010) Michałowski M., Hjorth J., Watson D., 2010, A&A, 514, A67
- Michałowski et al. (2008) Michałowski M. J., Hjorth J., Castro Cerón J. M., Watson D., 2008, ApJ, 672, 817
- Michałowski et al. (2009) Michałowski M. J. et al., 2009, ApJ, 693, 347
- Michałowski et al. (2014) Michałowski M. J. et al., 2014, A&A, 562, A70
- Michałowski et al. (2012) Michałowski M. J. et al., 2012, ApJ, 755, 85
- Nguyen et al. (2010) Nguyen H. T. et al., 2010, A&A, 518, L5
- Oliver et al. (2012) Oliver S. J. et al., 2012, MNRAS, 424, 1614
- Pascale et al. (2011) Pascale E. et al., 2011, MNRAS, 415, 911
- Perley et al. (2013) Perley D. A. et al., 2013, ApJ, 778, 128
- Perley et al. (2014) Perley D. A. et al., 2014, ApJ, submitted
- Pilbratt et al. (2010) Pilbratt G. L. et al., 2010, A&A, 518, L1
- Poglitsch et al. (2010) Poglitsch A. et al., 2010, A&A, 518, L2
- Priddey et al. (2006) Priddey R. S., Tanvir N. R., Levan A. J., Fruchter A. S., Kouveliotou C., Smith I. A., Wijers R. A. M. J., 2006, MNRAS, 369, 1189
- Rangwala et al. (2011) Rangwala N. et al., 2011, ApJ, 743, 94
- Rigby et al. (2011) Rigby E. E. et al., 2011, MNRAS, 415, 2336
- Robertson & Ellis (2012) Robertson B. E., Ellis R. S., 2012, ApJ, 744, 95
- Roseboom et al. (2010) Roseboom I. G. et al., 2010, MNRAS, 409, 48
- Rossi et al. (2012) Rossi A. et al., 2012, A&A, 545, A77
- Salpeter (1955) Salpeter E. E., 1955, ApJ, 121, 161
- Salvaterra et al. (2009) Salvaterra R. et al., 2009, Nature, 461, 1258
- Schady et al. (2012) Schady P. et al., 2012, A&A, 537, A15
- Schady et al. (2014) Schady P. et al., 2014, A&A
- Schaefer et al. (1999) Schaefer B. E. et al., 1999, ApJL, 524, L103
- Silva et al. (1998) Silva L., Granato G. L., Bressan A., Danese L., 1998, ApJ, 509, 103
- Smith et al. (2012) Smith A. J. et al., 2012, MNRAS, 419, 377
- Smith et al. (2011) Smith D. J. B. et al., 2011, MNRAS, 416, 857
- Smith et al. (2013) Smith D. J. B. et al., 2013, MNRAS, 436, 2435
- Sonbas et al. (2011) Sonbas E. et al., 2011, GRB Coordinates Network, 12612, 1
- Sparre et al. (2011) Sparre M. et al., 2011, GRB Coordinates Network, 11607, 1
- Swinbank et al. (2014) Swinbank A. M. et al., 2014, MNRAS, 438, 1267
- Symeonidis et al. (2014) Symeonidis M. et al., 2014, MNRAS, 443, L124
- Symeonidis et al. (2013) Symeonidis M. et al., 2013, MNRAS, 431, 2317
- Tanvir et al. (2004) Tanvir N. R., Barnard V. E., Blain A. W., Fruchter A. S., Kouveliotou C., Natarajan P., Ramirez-Ruiz E., et al., 2004, MNRAS, 352, 1073
- Tanvir et al. (2009) Tanvir N. R. et al., 2009, Nature, 461, 1254
- Tanvir et al. (2012) Tanvir N. R. et al., 2012, ApJ, 754, 46
- Thoene et al. (2007) Thoene C. C., Perley D. A., Cooke J., Bloom J. S., Chen H.-W., Barton E., 2007, GRB Coordinates Network, 6741, 1
- Thöne et al. (2008) Thöne C. C. et al., 2008, A&A, 489, 37
- Viero et al. (2014) Viero M. P. et al., 2014, ApJS, 210, 22
- Viero et al. (2013) Viero M. P. et al., 2013, ApJ, 772, 77
- Wang et al. (2014) Wang L. et al., 2014, MNRAS, 444, 2870
- Wang et al. (2012) Wang W.-H., Chen H.-W., Huang K.-Y., 2012, ApJL, 761, L32
- Watson et al. (2011) Watson D. et al., 2011, ApJ, 741, 58
- Wijers et al. (1998) Wijers R. A. M. J., Bloom J. S., Bagla J. S., Natarajan P., 1998, MNRAS, 294, L13
- Xu et al. (2012) Xu D., Malesani D., Fynbo J. P. U., Tanvir N. R., Karhunen K., 2012, GRB Coordinates Network, 13411, 1
- Yonetoku et al. (2004) Yonetoku D., Murakami T., Nakamura T., Yamazaki R., Inoue A. K., Ioka K., 2004, ApJ, 609, 935
- York et al. (2000) York D. G. et al., 2000, AJ, 120, 1579
- Yüksel et al. (2008) Yüksel H., Kistler M. D., Beacom J. F., Hopkins A. M., 2008, ApJL, 683, L5