When did round disk galaxies form?
Abstract
When and how galaxy morphology such as disk and bulge seen in the present-day universe emerged is still not clear. In the universe at , galaxies with various morphology are seen, and star-forming galaxies at show an intrinsic shape of bar-like structure. Then, when did round disk structure form? Here we take a simple and straightforward approach to see the epoch when a round disk galaxy population emerged by constraining the intrinsic shape statistically based on apparent axial ratio distribution of galaxies. We derived the distributions of the apparent axial ratios in the rest-frame optical light ( Å) of star-forming main sequence galaxies at , , and , and found that the apparent axial ratios of them show peaky distributions at , while a rather flat distribution at the lower redshift. By using a tri-axial model () for the intrinsic shape, we found the best-fit models give the peaks of the distribution of , , and at , , and , respectively. The last value is close to the local value of 0.95. Thickness () is at all the redshifts and is close to the local value (0.21). The results indicate the shape of the star-forming galaxies in the main sequence changes gradually, and the round disk is established at around . Establishment of the round disk may be due to a cease of violent interaction of galaxies or a growth of a bulge and/or a super-massive black hole resides at the center of a galaxy which dissolves the bar structure.
1 Introduction
When and how did disk galaxies form? At , disk galaxies that can be classified with the Hubble’s tuning fork exist (e.g., Schade et al., 1995; Abraham et al., 1996; Lilly et al., 1998; Scarlata et al., 2007; Sargent et al., 2007); they are identified with their apparent morphology, and/or their surface brightness distribution, and/or empirical indices describing such as central condensation and asymmetry. Meanwhile, in the universe at , galaxies with various morphology are seen, and many of them show the presence of clumps and/or irregularity, though the morphology is traced in the rest-frame UV (e.g., Giavalisco et al., 1996; Steidel et al., 1996). Hence, the emergence of morphology classified with the Hubble’s tuning fork is considered to be around at , and formation of disk structure would also be expected at the epoch.
The Wide Field Camera 3 (WFC3) on the Hubble Space Telescope () enables us to study morphology of galaxies in the rest-frame optical light well up to at . Conselice et al. (2011) studied morphology evolution based on eye inspection. They found the disk population is increasing with redshift gradually and the population is very rare at . By using apparent morphology, similar trend is reported by Cameron et al. (2011) for galaxies with a stellar mass range of and by Talia et al. (2014). Mortlock et al. (2013) also studied the morphology evolution with eye inspection and a clearer emergence of the disk population at is seen after correcting for the statistical morphology misclassification.
However, from the optical surface brightness distribution, the fraction of the disk galaxies is higher at (Mortlock et al., 2013; Bruce et al., 2012; Buitrago et al., 2013). If the Sérsic index () less than 2.5 is regarded to be an indicator of disk galaxies, the fraction of the disk population is larger at and is decreasing with redshift, though the details of the evolutional trend is not so simple; e.g., if irregular galaxies are included in the sample, the disk fraction is more constant against redshift (Buitrago et al., 2013), or the fraction is rather constant for less massive galaxies () (Mortlock et al., 2013). Bruce et al. (2012) tried to model the two-dimensional surface brightness distribution with two components of Sérsic index of and , and found a fraction of the disk ( component) dominated galaxies decreases at rather sharply for stellar mass larger than .
Thus the opposite views are obtained in terms of the disk evolution. Other parameters characterizing the morphological features such as central condensation, asymmetry, Gini, M20, etc seem not to be suitable to trace the morphology of galaxies in distant universe (Wang et al., 2012; Mortlock et al., 2013; Talia et al., 2014).
On the other hand, studies of internal kinematics in star-forming galaxies such as BM/BX and star-forming BzK (sBzK) galaxies at revealed about one third of them show a clear rotation kinematics (Förster Schreiber et al., 2009). This suggests we witness disk galaxies and they may be progenitor of present-day disk galaxies, though a fraction of them may evolve into the present-day elliptical galaxies through major merges, particularly those with large stellar mass. Another piece of the suggestion for the disk progenitor scenario stems from the clustering property of sBzK galaxies; sBzK galaxies with mag are considered to be a progenitor of present-day disk galaxies with regard to their weak clustering strength (Hayashi et al., 2007). It would be reasonable to suppose most of the sBzK galaxies in this magnitude range will evolve into the present-day disk galaxies, though the brighter sBzK galaxies may be a progenitor of elliptical galaxies.
Motivated by the finding of the presence of many rotating disk among sBzK galaxies and clustering nature of them, we took a simple and straightforward approach to see whether the intrinsic shape of faint sBzK galaxies at is disk-like or not statistically based on apparent axial ratio distribution. We studied the surface brightness distribution and the apparent axial ratio in both rest-frame UV and optical light for sBzK galaxies with mag (Yuma et al., 2011, 2012). Yuma et al. (2011) and Yuma et al. (2012) revealed the surface brightness distribution of them is characterized by Sérsic index of , and the half-light radius and surface stellar mass density is similar to those in the present-day disk galaxies (Barden et al., 2005). However, it was turned out that the intrinsic shape of the sBzK galaxies is not a round disk (round means intrinsic axial ratio of ); their intrinsic shape is bar-like or oval (intrinsic axial ratio with the thickness similar to that of the present-day disk galaxies. The intrinsic bar-like structure of star-forming galaxies at is also pointed out by Law et al. (2012). It should be noted here that this bar-like structure does not imply a direct progenitor of the local barred galaxies as discuss later.
Then, when did round disk galaxies appear after ? Emergence of the round disk population should reflect the evolution process of the disk structure. Hence, revealing evolution of the intrinsic shape of the galaxies is expected to give us an insight to physical process of the galaxy evolution. In this paper, we study the intrinsic shape of main sequence galaxies with mag in the redshift range from 2.5 to 0.5 using the same method as Yuma et al. (2011) and Yuma et al. (2012) to see the redshift that the round disk galaxy population emerged. In the subsequent section, data sources and sample galaxies are summarized. In §3, we derive the surface brightness distributions and axial ratios of the galaxies. Then, in §4, we examine the distributions of the apparent axial ratios and constrain the intrinsic shape of the galaxies. Conclusion and discussion are given in §5. We adopt a cosmology with km s-1 Mpc-1, , and . All magnitudes in this paper are given in the AB magnitude system.
2 Data sources and sample galaxies
Sample galaxies in this study are collected from the Great Observatories Origins Deep Survey-South (GOODS-S)111 http://www.sci.edu/science/goods (Dickinson et al., 2003) and the Subaru XMM-Newton Deep Survey (SXDS) (Furusawa et al., 2008), which almost overlaps Ultra Deep Survey (UDS) in UK Infrared Telescope Infrared Deep Sky Survey (UKIDSS)(Lawrence et al., 2007). The data sources are the same as those used by Yuma et al. (2012) and the details are described in the paper. Here we briefly summarize them. In GOODS-S region, near infrared (NIR) images (-, -, and -band images) were taken from GOODS/ISAAC (Infrared Spectrometer And Array Camera) data release final version (Retzlaff et al., 2010). Five sigma limiting -band magnitude is 24.4 mag. NIR images taken with WFC3 on with F125W and F160W filters were obtained from CANDELS (Cosmic Assembly Near-infrared Deep Extragalactic Legacy Survey; Grogin et al., 2011; Koekemoer et al., 2011)222 http://candels.ucolick.org/index.html data release v0.5. Optical images were taken from ver. 2.0 data products of GOODS /ACS(Advanced Camera for Surveys) treasure program (, , , and ) (Giavalisco et al., 2004) and from ESO/GOODS program ( and ) (Nonino et al., 2009). Mid-infrared (MIR) images at 3.6 m and 4.5 m taken with Infrared Array Camera (IRAC) on the Spitzer Space Telescope () were from data release 1 and 2 obtained in Spitzer Legacy Science program. In SXDS/UDS region, NIR images (, , and ) were taken from data release ver. 8 of UKIDSS UDS. Five sigma limiting magnitude is mag. NIR images with /WFC3 with F125W and F160W filters were obtained from CANDELS data release v1.0. Optical images were taken from SXDS project (, , , , and ) (Furusawa et al., 2008). We used /ACS images taken with F814W filter (). MIR 3.6m and 4.5m images were taken from Spitzer Public Legacy Survey of UKIDSS UDS (SpUDS; PI: J. Dunlop). We also use the far-UV and near-UV data taken from Galaxy Evolution Explorer (; Martin et al., 2005) archived image (GR6) and the -band data of the Canada-France-Hawaii Telescope Legacy Survey (CFHTLS) wide field as supplemental information, though the limiting magnitudes are shallow.
Object detection was made based on -band image by using SEXTRACTOR (Bertin & Arnouts, 1996). We made photometry using these data for each source detected in images at the same position and derived total magnitudes using SEXTRACTOR. For the images taken with ACS and IRAC, we applied a correction for the aperture photometry to obtain a total magnitude following the manner by Yuma et al. (2012). Spectral energy distribution (SED) was constructed for each object from the photometry in all the bands. Then photometric redshifts were derived by using HYPERZ (Bolzonella et al., 2000). Comparisons with spectroscopic redshifts available showed of and in GOODS-S and SXDS, respectively. With the photometric redshifts, stellar mass, star-formation rate (SFR), and color excess () were derived for each object through SED fitting by using SEDfit program (Sawicki, 2012). The SEDfit employs population synthesis code of BC03(Bruzual & Charlot, 2003). Salpeter initial mass function with a mass range of and the solar metallicity were assumed. Extinction law used was that by Calzetti et al. (2000). More details are described by Yuma et al. (2011, 2012) and Yabe et al. (2012, 2014).
Using these data, we selected galaxies brighter than mag. We divided the galaxies in three epochs of , , and based on the photometric redshifts; these epochs are chosen to take a comparable duration ( Gyr) of the epochs in the cosmic age and to keep a reasonable sample size.
Figure 1 shows distribution of the SFR against stellar mass in each epoch. As like in other works (e.g., Noeske et al., 2007; Daddi et al., 2007), the SFRs are larger in more massive galaxies and they make a sequence referred as main sequence. The main sequence shows a gradual cosmological evolution down to , where we see disk galaxies in the sequence. Most of our sample galaxies at are also sBzK galaxies. Galaxies in the most massive part of the main sequence at the higher redshifts may soon stop star formation and evolve into passive elliptical galaxies according to a simple theoretical expectation (e.g., Bouché et al., 2010). But most of the sample galaxies occupy less massive part of the main sequence and they are expected to reside in the main sequence at the present epoch. A branch seen above the main sequence shows very high SFR at a fixed stellar mass, and they are considered to be violently forming stars often under strong galaxy interaction (e.g., Daddi et al., 2007). Thus we selected star-forming galaxies in the main sequence bracketed by thresholds shown in Figure 1. The stellar mass limit at is to avoid the inclusion of Magellanic-type galaxies that would tend to show bar-like structure even in the local universe. A star-forming galaxy with a stellar mass of at is a progenitor of the Milky Way class galaxy (stellar mass of ), if we adopt the abundance matching in terms of the number density (van Dokkum et al., 2013). Ranges of the specific SFR (sSFR) we use are yr-1 (), yr-1 (), and yr-1 (). SFR limit is just an additional threshold; SFR yr-1 (), yr-1 (), and yr-1 (). A fraction (typically %) of them show multiple-structure in the rest-frame optical images; if an object detected by SEXTRACTOR locates within a radius of median size (FWHM) of the galaxies in each epoch, we regard them as multiple. Such galaxies are not adequate to examine the shape and we discarded them in this study.
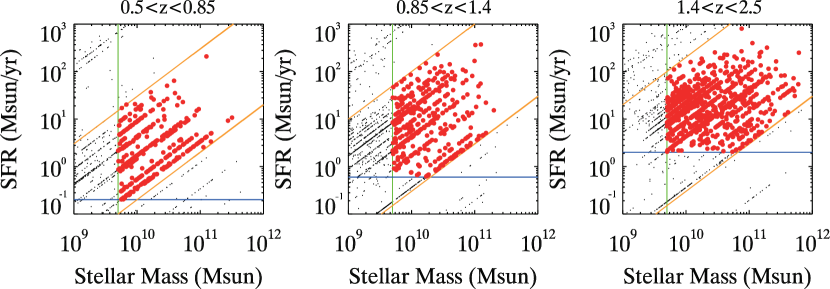
(see text).
3 Two-dimensional surface brightness fitting
We made two-dimensional surface brightness distribution fitting to the galaxies selected above. The images were taken with in the rest-frame optical wavelength m): F160W() for , F125W() for , and F850LP() in GOODS-S and F814W() in SXDS for . Magnitude ranges for the sample galaxies in three epochs were virtually 24 mag and 24 mag, and 25 mag in GOODS-S and 24 mag in SXDS. Pixel scales after drizzle were , , and in , , and /, respectively.
The radial distribution is fitted with Sérsic profile: exp, where is the half light radius, is the surface brightness at , and characterizes the shape of the profile (Sérsic index). Two dimensional surface brightness fitting was made by using GALFIT version 3 (Peng et al., 2010). Initial guess parameters on the central position, axial ratio, position angle, and are taken from the output parameters of SEXTRACTOR. Initial Sérsic index was set to be 1.5, which does not affect the final results significantly. Point spread function in each image was constructed from isolated unsaturated stars.
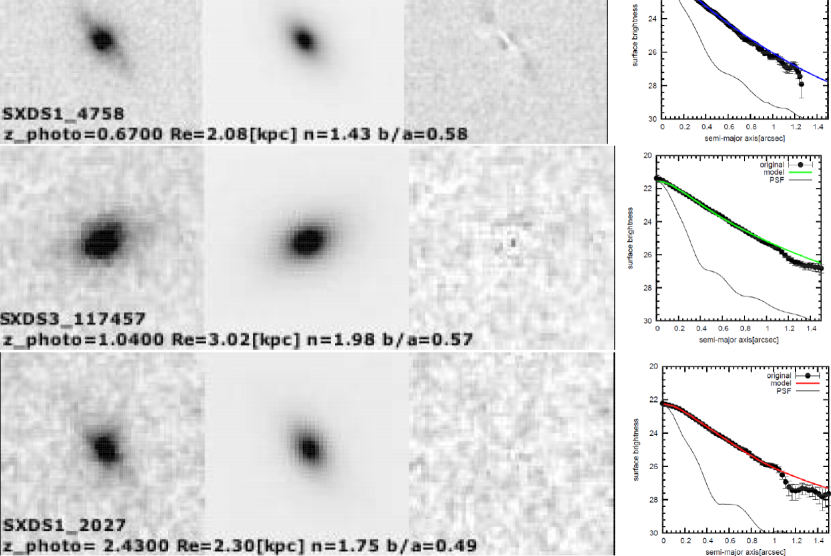
Figure 2 shows example of the profile fitting. As seen in the figure, the surface brightness profiles extend to arcsec in radius corresponding to kpc at and kpc at . The surface brightness we use to fit the model reaches mag arcsec-2 in the rest-frame band after correcting for the cosmological dimming. This level of the surface brightness can be regarded as the outskirt of galaxies, and is deep enough to confront with the shape of local disk galaxies. Considering the fading of galaxy luminosity to the present epoch, the value would be mag arcsec-2 fainter at (e.g., Brinchmann et al., 1998; Miller et al., 2011). We obtained , , and apparent axial ratio (, where is a major axis and is a minor axis) for each galaxy. About 60-70% of the sample galaxies show . We then examined the distribution of and stellar mass of the sample galaxies with . In each epoch, the distribution of against stellar mass is similar to that for local disk galaxies (Barden et al., 2005).
Accuracy for the Sérsic index as well as for the axial ratio was examined by putting artificial objects into the images used for the analysis. The artificial objects were created by using ARTDATA/MKOBJECTS in IRAF. Mock galaxies with Sérsic index of 1 or 4 were generated in both GOODS-S and SXDS with half-light radius of in a magnitude range of mag. The ranges of input parameters are chosen to mimic those of the sample galaxies. Axial ratio and position angle are randomly chosen and the galaxies are put into , , , and images randomly. As we did for the real objects, we first used SEXTRACTOR to derive position, position angle, axial ratio, and FWHM. We then performed GALFIT with these parameters as well as as the initial guess. Results for (GOODS-S, SXDS/UDS) were presented by Yuma et al. (2012). Accuracy for the Sérsic index in image is good enough ( %) in this magnitude range in case of . Even if the intrinsic is 4, the misclassification into disk is negligible, though the accuracy is slightly worse in image (Yuma et al., 2011, 2012). We show the accuracy of the axial ratio derived for (SXDS/UDS), (GOODS-S), and (SXDS/UDS) in case of in Figure 3. In all the panels, the obtained axial ratios agree very well with those of input value in the bright magnitude range, and the accuracy is getting worse for the fainter objects. However, at the faintest magnitude level of the sample galaxies in each band, the accuracy of the obtained axial ratio is less than 5% on average, which is smaller than the bin size of the histograms of the axial ratio distribution described below. The accuracy of axial ratio in (GOODS-S, SXDS/UDS) is presented by Yuma et al. (2012), and it is comparable to those in other bands. Detection rate in -band image against the apparent axial ratio was also examined and the rate is almost constant in the range of and 1.0 (Yuma et al., 2011).
4 Axial ratio distribution
4.1 Distribution of apparent axial ratios
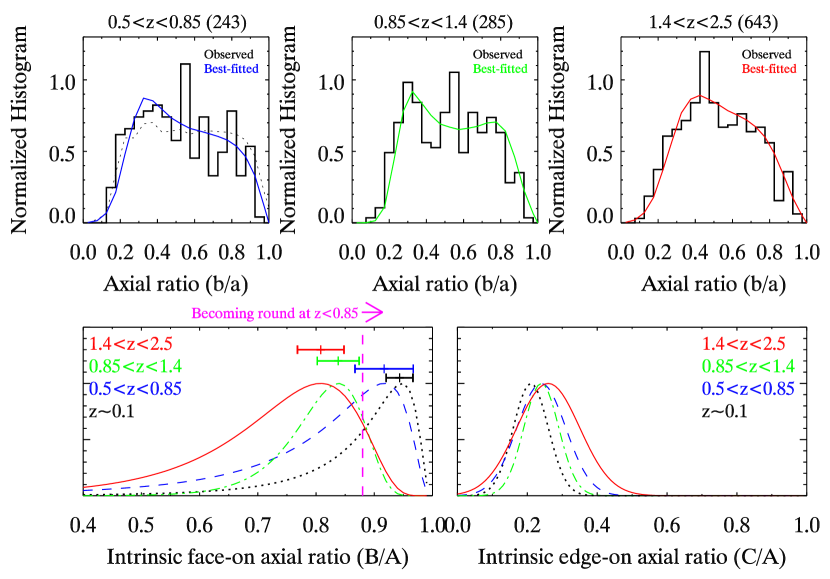
In order to see whether they have round disk structure, we take a simple and straightforward approach; i.e., we constrain the intrinsic shape of these galaxies statistically based on distribution of apparent axial ratios of the sample galaxies at three epochs. Figure 4 (upper row) shows the apparent axial ratio distributions of the sample galaxies with among galaxies selected in §2. If the intrinsic shape of disk galaxies is an infinitesimally thin circular disk, the apparent axial ratio distribution is exactly flat. In fact, the distribution for local disk galaxies is almost flat except for around at and (Padilla and Strauss, 2008), since real disks have a finite thickness and are not perfectly round. As seen in the right panel () of the upper row of Figure 4, the axial ratio distribution peaks at and sharply decreases to both sides. In the middle panel (), the distribution is slightly flatter, but still shows a slight peaky distribution. The histograms suggest these galaxies do not have a round disk structure. Meanwhile in the left panel (), the distribution is rather flat and is close to that for the local disk galaxies, suggesting they have the intrinsic shape of round disk.


4.2 Intrinsic axial ratio distribution
To constrain the intrinsic shape quantitatively, we employ a tri-axial model with axial lengths of following the method by Ryden (2004). The face-on ellipticity () is assumed to be described by log-normal distribution with mean of ln ) and dispersion of , while the edge-on thickness () is assumed to be described with Gaussian distribution with mean of and dispersion of . With this parameter set, the expected apparent axial ratio distribution seen from random viewing angles can be calculated and can be compared with the observed apparent axial ratio distribution.
The model axial ratio distributions were calculated in a range of , , , and , with a step of , and . With these parameter sets, we searched for the best-fit parameter set using method with statistics by Gehrels (1986). To estimate the uncertainty of the best-fit parameters, we made Monte Carlo realization of the observed histogram of the axial ratio 1000 times and derived the best-fit parameter set for each realization. We took 68% confidence level as the uncertainty of the model parameter. The peak value of the distribution of intrinsic is given by exp(). The uncertainty on the peak was calculated based on the propagation of errors with the uncertainty of and mentioned above.
The best-fit models are shown with solid curves in Figure 4 (upper row), and the best-fitted parameters as well as the uncertainties are shown in Table 1. Resulting distributions of intrinsic axial ratios at the epochs are shown in Figure 4 (bottom row). The best-fit model peaks at , and at , and , respectively, and the last value of is very close to that for the local disk galaxies (0.94) (Padilla and Strauss, 2008). The mean is at all the epochs and is close to that of the local disk galaxies (0.21) (Padilla and Strauss, 2008). The intrinsic shape of the star-forming main sequence galaxies at is bar-like or oval, while they have round disk structure at , i.e., the emergence of the round disk population is , though the precise redshift determination is difficult due to the the gradual cosmological evolution and small sample size.
| Local**Padilla & Strauss (2008) | ||||
|---|---|---|---|---|
4.3 Robustness of the results
In order to examine the robustness of the results, we constructed samples by changing selection criteria slightly with respect to -band magnitude, stellar mass, sSFR, /// magnitude, and Sérsic index, and made the same fitting to these samples.
If we take samples in each epoch with 0.5 mag brighter or fainter in band, virtually all the best-fit parameters are within 1 error. The peak values of the intrinsic axial distribution () agree with the best-fit value within 1 error. If we take a massive sample (stellar mass larger than ), the results mostly agree within 1 error. If we include less massive galaxies (stellar mass larger than ), peak values of agree within the error, but the resulting parameters for the highest-redshift bin change more than 1 . It should be noted that even in local universe such less massive galaxies often show bar-like structure as like Magellanic irregular galaxies. We also test the dependence on sSFR by taking yr sSFR yr-1 at , yr sSFR yr-1 at , and yr sSFR yr-1 at . Almost all the obtained best-fit parameters as well as the peak values of agree within 1 error. If we take the threshold SFR 2-3 times larger, the resulting parameters are almost within 1 . The axial ratios are derived by using , , , and images. More accurate axial ratios are expected to be obtained with the brighter sample. Hence we take about 0.5 mag brighter samples ( 23.5 mag, 24.5 mag, 23.5 mag, and 23.5 mag) from the mag sample. The resulting peak axial ratios are within or marginally within 1 uncertainty, and the conclusion in this study does not change. We also make samples with Sérsic index of and , and find again the conclusion does not change.
Dust obscuration may affect the axial ratio distribution; the redder disk galaxies tend to show the smaller axial ratios in the local universe as well as at (e.g., Padilla and Strauss, 2008; Patel et al., 2012). This trend is considered to be due to the larger dust obscuration in more inclined galaxies. In order to see the effect, we divided the sample into two subsamples with smaller or larger color excess () at each epoch. The color excess was derived from the SED fitting mentioned in §2, and we divided the sample at around the median of 0.2 or 0.25 mag. Resulting histograms of the axial ratios show that a slight excess at smaller axial ratio () is seen at , but such a clear trend is not seen at the higher redshifts. We made the model fitting to the subsamples. About half of the best fit and values agree with those of the total sample within the uncertainty for the total sample. However, it should be noted that the uncertainty for the subsamples is large due to the smaller sample size. We also derived the peak with the subsamples. The peak values in the smaller color excess (larger color excess) are 0.81 (0.93) at , 0.91 (0.78) at , and 0.99 (0.97) at . Thus the increasing trend of with decreasing is still seen, except for the for the larger color excess at .
5 Conclusion and discussion
We constrain the intrinsic shape of the star-forming main sequence galaxies at to 0.5 based on the distributions of the apparent axial ratios by employing the tri-axial model of . At , the intrinsic shape of them is bar-like or oval with , while at , is 0.92 that is close to the value for the local galaxies (0.95). Hence, the emergence of the round disk can be regarded to be , though the precise redshift determination is difficult due to the gradual evolution and the small sample size. The thickness () is about 0.25 and does not show significant cosmological evolution down to . Similar result has been obtained very recently by adopting a slightly different model for the intrinsic shape; the triaxiality of star-forming galaxies with stellar mass larger than is large at , but small at (van der Wel et al., 2014). It is worth noting the bar-like structure we see at the high redshifts is unlikely to be a direct progenitor of bar structure in the present-day barred galaxies, because the apparent axial ratios are obtained mainly from outside beyond the bar region in the present-day barred galaxies; the bar region in a present-day barred galaxy is brighter than mag arcsec-2 in band (Ohta et al., 1990, 2007). Furthermore, large barred galaxies are disappearing as redshift increases (van den Bergh et al., 1996): Its fraction among disk galaxies is only 10-20% at (Sheth et al., 2008; Melvin et al., 2014).
At , most of star-forming galaxies show Sérsic index of in the rest-frame UV (Ravindranath et al., 2006) and in the rest-frame optical (Akiyama et al., 2008). However, the distribution of the apparent axial ratios is not flat, suggesting the elongated intrinsic structure (Ravindranath et al., 2006). The results obtained here reveal that although the disk-like structure is seen among star-forming galaxies at , its intrinsic shape is bar-like or oval. Physical mechanism to make such structure is not clear, but they may be bar-like due to galaxy interaction and/or minor merge (Noguchi, 1987; Berentzen et al., 2004). Or the baryonic matter might have been already highly concentrated in a dark matter halo, resulting into the bar instability (Ostriker & Peebles, 1973).
Then how did they become round? Numerical simulations show a central mass condensation (either of a bulge and/or a super-massive black hole (SMBH)) with a mass fraction of 1-10% of a disk dissolves the bar-like structure (Athanassoula et al., 2005; Hozumi, 2012). Thus the emergence of round disk population may be related to the growth of a central bulge and/or a SMBH. According to the simulations by Athanassoula et al. (2005), the bar-like structure gradually evolves into a round disk with a time scale of a few Gyr, which is comparable to the elapsed time from to 0.9 ( Gyr). However, eye inspection of our sample galaxies at suggests that bulge dominated galaxies are not the majority. The two-component model fit to discriminate bulge and disk in a galaxy is not straightforward and it is beyond our scope in this study. AGN number density peaks at (e.g., Ueda et al., 2003; Hasinger et al., 2005), suggesting the rapid growth of SMBHs during the epoch. The growth of a SMBH may also play a role for dissolving the bar structure, although the mass fraction may not be large enough. Alternatively, the gradual cease of galaxy interaction may make a round disk. If this is the case, the epoch of the round disk population at would indicate the major galaxy interaction mostly ceased around at this redshift and the galaxy morphology is rather stable after this. Further studies of link between intrinsic shape of disk and the growth of a bulge/SMBH as well as galaxy interaction are desirable to disclose the evolution of disk galaxies.
References
- Abraham et al. (1996) Abraham, R. G., Tanvir, N. R., Santiago, B. X., et al.(1996), MNRAS, 279, L47
- Akiyama et al. (2008) Akiyama, M., Minowa, Y., Kobayashi, N., et al. 2008, ApJS, 175, 1
- Athanassoula et al. (2005) Athanassoula, E., Lambert, J. C., & Dehnen, W. 2005, MNRAS, 363, 496
- Barden et al. (2005) Barden, M., Rix, H., Somerville, R. S., et al. 2005, ApJ, 635, 959
- Berentzen et al. (2004) Berentzen, I., Athanassoula, E., Heller, C. H. & Fricke, K.J. 2004, MNRAS, 347, 220
- Bertin & Arnouts (1996) Bertin, E., & Arnouts, S. 1996, A&AS, 117, 393
- Bolzonella et al. (2000) Bolzonella, M., Miralles, J.-M. & Pelló, R. 2000, A&A, 363, 476
- Bouché et al. (2010) Bouché, N., Dekel, A., Genzel, R., et al. 2010, ApJ, 718, 1001
- Brinchmann et al. (1998) Brinchmann, J., Abraham, R., Schade, D., et al. 1998, ApJ, 499, 112
- Bruce et al. (2012) Bruce, V. A., Dunlop, J. S., Cirasuolo, M., et al. 2012, MNRAS, 427, 1666
- Bruzual & Charlot (2003) Bruzual, G., & Charlot, S. 2003, MNRAS, 344, 1000
- Buitrago et al. (2013) Buitrago, F., Trujillo, I., Conselice, C. J., & Häußler, B. 2013, MNRAS, 428, 1460
- Calzetti et al. (2000) Calzetti, D., Armus, L., Bohlin, R. C., et al. 2000, ApJ, 533, 682
- Cameron et al. (2011) Cameron, E., Carollo, C. M., Oesch, P. A., et al. 2011, ApJ, 743, 146
- Conselice et al. (2011) Conselice, C. J., Bluck, A. F. L., Ravindranath, S., et al. 2011, MNRAS, 417, 2270
- Daddi et al. (2007) Daddi, E., Dickinson, M., Morrison, G., et al. 2007, ApJ, 670, 156
- Dickinson et al. (2003) Dickinson, M., Giavalisco, M., & GOODS Team 2003, in The Mass of Galaxies at Low and High Redshift, ed. R. Bender & A. Renzini (Berlin:Springer), 324
- Förster Schreiber et al. (2009) Förster Schreiber, N. M., Genzel, R., Bouché, N., et al. 2009, ApJ, 706, 1364
- Furusawa et al. (2008) Furusawa, H., Kosugi, G., Akiyama, M., et al. 2008, ApJS, 176, 1
- Gehrels (1986) Gehrels, N. 1986, ApJ, 303, 336
- Giavalisco et al. (1996) Giavalisco, M., Steidel, C. C., & Macchetto, F. D. 1996, ApJ, 470, 189
- Giavalisco et al. (2004) Giavalisco, M., Ferguson, H. C., Koekemoer, A. M., et al. 2004, ApJ, 600, L93
- Grogin et al. (2011) Grogin, N. A., Kocevski, D. D., Faber, S. M., et al. 2011, ApJS, 197, 35
- Hasinger et al. (2005) Hasinger, G., Miyaji, T., & Schmidt, M. 2005, A&A, 441, 417
- Hayashi et al. (2007) Hayashi, M., Shimasaku, K., Motohara, K., et al. 2007, ApJ, 660, 72
- Hozumi (2012) Hozumi, S. 2012, PASJ, 64, 5
- Koekemoer et al. (2011) Koekemoer, A. M., Faber, S. M., Ferguson, H. C., et al. 2011, ApJS, 197, 36
- Law et al. (2012) Law, D. R., Steidel, C. C., Shapley, A. E., et al. 2012, ApJ, 745, 85
- Lawrence et al. (2007) Lawrence, A., Warren, S. J., Almaini, O., et al. 2007, MNRAS, 379, 1599
- Lilly et al. (1998) Lilly, S., Schade, D., Ellis, R., et al. 1998, ApJ, 500, 75
- Martin et al. (2005) Martin, D. C., Fanson, J., Schiminovich, D., et al. 2005, ApJ, 619, L1
- Melvin et al. (2014) Melvin, T., Masters, K., Lintott, C., et al. 2014, MNRAS, 438, 2882
- Miller et al. (2011) Miller, S. H., Bundy, K., Sullivan, M., Ellis, R. S., & Treu, T. 2011, ApJ, 741, 115
- Mortlock et al. (2013) Mortlock, A., Conselice, C. J., Hartley, W. G., et al. 2013, MNRAS, 433, 1185
- Noeske et al. (2007) Noeske, K. G., Weiner, B. J., Faber, S. M., et al. 2007, ApJ, 660, L43
- Noguchi (1987) Noguchi, M. 1987, MNRAS, 228, 635
- Nonino et al. (2009) Nonino, M., Dickinson, M., Rosati, P., et al. 2009, ApJS, 183, 244
- Ohta et al. (1990) Ohta, K., Hamabe, M., & Wakamatsu, K. 1990, ApJ, 357, 71
- Ohta et al. (2007) Ohta, K., Aoki, K., Kawaguchi, T., & Kiuchi, G. 2007, ApJS, 169, 1
- Ostriker & Peebles (1973) Ostriker, J. P., & Peebles, P. J. E. 1973, ApJ, 186, 467
- Padilla and Strauss (2008) Padilla, N. D., & Strauss, M. A. 2008, MNRAS, 388, 1321
- Patel et al. (2012) Patel, S. G., Holden, B. P., Kelson, D. D., et al. 2012, ApJ, 748, L27
- Peng et al. (2010) Peng, C. Y., Ho, L. C., Impey, C. D. & Rix, H.-W. 2010, AJ, 139, 2097
- Ravindranath et al. (2006) Ravindranath, S., Giavalisco, M., Ferguson, H. C., et al. 2006, ApJ, 652, 963
- Retzlaff et al. (2010) Retzlaff, J., Rosati, P., Dickinson, M., et al. 2010, A&A, 511, 50
- Ryden (2004) Ryden, B. S. 2004, ApJ, 601, 214
- Sargent et al. (2007) Sargent, M. T., Carollo, C. M., Lilly, S., et al. 2007, ApJS, 172, 434
- Sawicki (2012) Sawicki, M. 2012, PASP, 124, 1208
- Scarlata et al. (2007) Scarlata, C., Carollo, C. M., Lilly, S., et al. 2007, ApJS, 172, 406
- Schade et al. (1995) Schade, D., Lilly, S. J., Crampton, D., et al. 1996, ApJ, 451, L1
- Sheth et al. (2008) Sheth, K., Elmegreen, D., Elmegreen, B. G., et al. 2008, ApJ, 675, 1141
- Steidel et al. (1996) Steidel, C. C., Giavalisco, M., Dickinson, M., & Adelberger, K. L. 1996, AJ, 112, 352
- Talia et al. (2014) Talia, M., Cimatti, A., Mignoli, M., et al. 2014, A&A, 562, A113
- Ueda et al. (2003) Ueda, Y., Akiyama, M., Ohta, K., & Miyaji, T. 2003, ApJ, 598, 886
- van den Bergh et al. (1996) van den Bergh, S., Abraham, R. G., Ellis, R. S., et al. 1996, AJ, 112, 359
- van der Wel et al. (2014) van der Wel, A., Chang, Y.-Y., Bell, E. F., et al. 2014, ApJ, 792, L6
- van Dokkum et al. (2013) van Dokkum, P. G., Leja, J., Nelson, E. J., et al. 2013, ApJ, 771, L35
- Wang et al. (2012) Wang, T., Huang, J.-S., Faber, S. M., et al. 2012, ApJ, 752, 134
- Yabe et al. (2012) Yabe, K., Ohta, K., Iwamuro, F., et al. 2012, PASJ, 64, 60
- Yabe et al. (2014) Yabe, K., Ohta, K., Iwamuro, F., et al. 2014, MNRAS, 437, 3647
- Yuma et al. (2011) Yuma, S., Ohta, K., Yabe, K., Kajisawa, M., & Ichikawa, T. 2011, ApJ, 736, 92
- Yuma et al. (2012) Yuma, S., Ohta, K., & Yabe, K. 2012, ApJ, 761, 19