DNA twist stability changes with magnesium(2+) concentration
Abstract
For an understanding of DNA elasticity at high mechanical loads (), its helical nature needs to be taken into account, in the form of coupling between the twist and stretch degrees of freedom. The prevailing model for DNA elasticity, the worm-like chain, was previously extended to include this twist–stretch coupling, giving rise to the twistable worm-like chain. Motivated by DNA’s charged nature, and the known effects of ionic charges on the molecule’s persistence length and stretch modulus, we explored the impact of buffer ionic conditions on twist–stretch coupling. After developing a robust fitting approach for force–extension data, we find that DNA’s helical twist is stabilized at high concentrations of the magnesium divalent cation.
pacs:
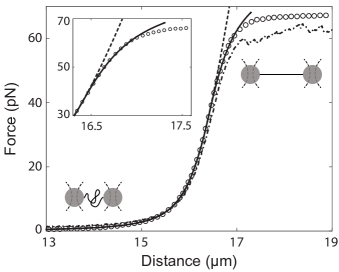
82.37.Rs,87.14.gk,87.15.LaMechanical perturbations of the DNA double helix form a crucial step during many of the cell’s life-sustaining processes. When proteins bind, replicate, compact, and repair the genome, the DNA molecule is bent, stretched, and twisted. A detailed understanding of DNA’s elastic response to these perturbations is therefore a prerequisite for a deep quantitative insight into the biology of the cell. The single-molecule techniques that have been developed over the past two decades Smith et al. (1992); Wang et al. (1997) have greatly contributed to this understanding: it is now routinely possible to directly manipulate single molecules of DNA, and monitor their response to stretch and twist under a wide variety of experimental conditions. One such technique is the optical tweezers (FIG. 1, schematic), which can be used to accurately measure the force response of DNA Moffitt et al. (2008). By modeling the corresponding force–extension data, we can then not only improve upon our structural understanding of DNA; it is also possible to infer the mechanisms of action of DNA-binding proteins from the changes they induce in force–extension curves Heller et al. (2014).
Below mechanical loads of , dsDNA’s force response is accurately modeled by the extensible worm-like chain (eWLC) Odijk (1995); Marko and Siggia (1995). This well-established, semiclassical model describes the molecule as simply an isotropic, extensible rod: Entropic bending fluctuations, characterized by a persistence length ( for dsDNA under physiological conditions), and enthalpic stretching of the DNA backbone, characterized by the stretch modulus ( Gross et al. (2011)), are balanced by the work performed by the stretching force , leading to a relative extension (end-to-end distance over contour length). Beyond , however, dsDNA’s helical structure needs to be taken into account Gore et al. (2006); Lionnet et al. (2006); Gross et al. (2011). This introduces an energy cross-term between the molecule’s twist and stretch degrees of freedom. Only relatively recently, Gross et al. found it possible to incorporate this effect into the eWLC, yielding the “twistable worm-like chain” (tWLC) Gross et al. (2011):
| (1) |
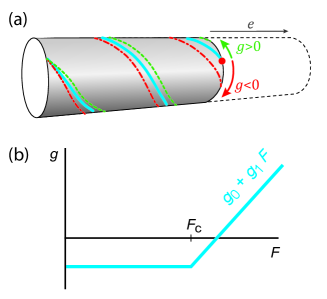
where is the molecule’s twist rigidity ( Gross et al. (2011)), and is the force-dependent twist–stretch coupling. As illustrated schematically in FIG. 2(a), a positive value of would correspond to DNA unwinding as it is being stretched. In reality, DNA slightly overwinds up to — a finding with important implications for proteins that have to twist DNA upon binding Gore et al. (2006); Lionnet et al. (2006). Only at higher forces does the molecule begin to unwind Gore et al. (2006); Gross et al. (2011), until, around , it undergoes a structural transition known as overstretching Bustamante et al. (1994); van Mameren et al. (2009); Gross et al. (2011); Zhang et al. (2013). The change from overwinding to unwinding has been modeled in the tWLC by taking as a piecewise linear function of the force [FIG. 2(b)]. Overall, the tWLC substantially extends the range of forces over which dsDNA force–extension data is understood (see FIG. 1).
More importantly, the tWLC captures DNA twist–stretch coupling into the two parameters and , which can now be obtained from fits to force–extension data. This opens up the possibility of investigating if, and to what extent, twist–stretch coupling is affected by buffer ionic conditions. DNA is, after all, a highly charged molecule, known to interact strongly with cations through its phosphate backbone and major groove Chiu and Dickerson (2000); Guéroult et al. (2012). These interactions can lead to softening of DNA Baumann (1997); Wenner et al. (2002), and, for multivalent cations, to bending Jerkovic and Bolton (2001), and even condensation van den Broek et al. (2010). In this Letter, we therefore set out to quantify DNA twist–stretch coupling as a function of the concentration of the divalent magnesium cation ().
Optical tweezers experiments.
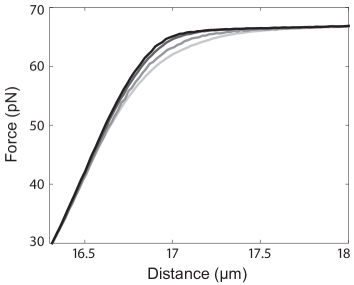
— Using optical tweezers, we collected single-molecule force–extension data on dsDNA at varying concentrations of magnesium (0– ). In brief, we tethered biotinylated -phage DNA () between two streptavidin-coated polystyrene microspheres captured in two optical traps, inside a microfluidic flowcell (for details on the instrument and protocols, please refer to Candelli et al. (2011)). To suppress unpeeling of the untethered ends of the DNA strands, the effects of which are shown in FIG. 1, we worked in a background of monovalent salt () Gross et al. (2011). Below forces of , force–extension curves were indistinguishable (data not shown), indicating that the persistence length and stretch modulus were not affected by the addition of divalent salt. Since the force dependence of twist–stretch coupling only affects dsDNA elasticity significantly above , we instead focused on comparing the data in this high-force regime (FIG. 3). For high concentrations of magnesium, we observed a distinct stiffening of the DNA just before the onset of overstretching. This suggested that twist–stretch coupling was specifically affected.
Data analysis approach.
— To quantify the stiffening effect, we fitted the data with the tWLC model, Eq. (1). Since previous reports have shown the twist rigidity to be insensitive to ionic strength Mohammad-Rafiee and Golestanian (2004); Mosconi et al. (2009), that leaves the model with four free fit parameters: , , , and . Given this large number of parameters, a solid approach for fitting the data was needed. We would like to highlight three key points in the approach we have developed: (1) fitting with the force as the dependent variable; (2) correcting for systematic measurement errors; and (3) global fitting with shared physical parameters. (For additional details, we refer to the SI, which includes both the raw data, as well as the MATLAB code used for generating the figures in this Letter.)
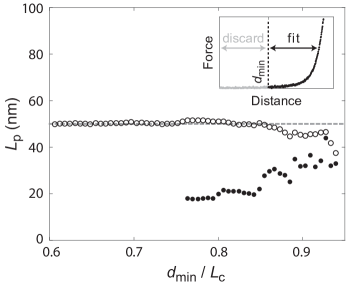
The first point stems from the observation that, in optical tweezers data, the force signal carries the most significant error (and not the distance, which is precisely controlled). As such, when performing a least-squares fit, the force should be the dependent variable Bevington and Robinson (2003). This implies that the model fitted to our data should be an inversion of Eq. (1), expressing force as a function of distance. The impact of this inversion is illustrated in FIG. 4, for the simplified case of an eWLC fit to simulated data. If Eq. (1) is (incorrectly) used as-is for the least-squares fit, the value found for changes wildly as more or less data from the low-force tail is included in the fit — in addition to systematically underestimating . When, instead, an inverted version of Eq. (1) is used, the fit result does become reliable 111We should note that this is a non-issue for magnetic tweezers experiments: in such data, the distance variable carries the most significant error, and Eq. (1) can be used as-is..
Second of all, we applied corrections for three systematic measurement errors that are intrinsic to our data: (a) the force at zero extension is not set exactly to zero during each experiment, leading to a random force offset for each force–extension curve; (b) small variations in microbead diameter lead to a distance offset ; and (c) imperfect force sensor calibration causes force data to include a random factor . The first two systematic errors were accounted for by including the offsets in the eWLC equation (see SI). This amended eWLC equation was fit to the data below , and the offsets found were subtracted from the data. The third systematic error was rectified by using the force at which the overstretching plateau occurs as a proxy for . Within the force resolution of our instrument, there appears to be no correlation between magnesium concentration and ; we therefore rescaled all force–extension curves to have overlapping overstretching plateaus.
Thirdly, and finally, we opted for a global fitting approach. We grouped all force–extension curves into ensembles by magnesium concentration, implying that the values of the physical parameters (i.e., , , , and ) for curves within each ensemble should be equal. We could thus fit all curves in each ensemble simultaneously, while sharing fit parameters between curves. Fits of simulated data confirmed that, generally, global fitting performs significantly better than individual fitting of the curves, with a decreased sensitivity to the aforementioned systematic measurement errors (see SI).
As can be seen in FIG. 1, the tWLC does not fit the full dsDNA force–extension curve up until the overstretching plateau. We therefore removed all force–extension data above a maximum force , determined by optimizing in each magnesium concentration ensemble for a maximum goodness-of-fit () to the data. This way, we were finally able to determine the tWLC fit parameters for each of the measured magnesium concentrations.
Analysis results.
— As shown in FIG. 5, the persistence length and the stretch modulus are stable over the range of magnesium concentrations investigated. This is consistent with the observation that force–extension data below (the limit of the eWLC) is equal across magnesium concentrations. Indeed, any electrostatic effects on these parameters are expected to be fully saturated well below the monovalent salt concentration ( NaCl) used in our buffer Baumann (1997).
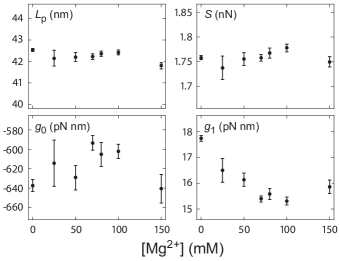
, on the other hand, shows an almost 20% decrease between 0– of magnesium. This signifies a decreased tendency of the DNA double helix to unwind under high tensile stress — in other words, a stabilization of DNA twist. Qualitatively similar results have been shown before in a bulk study of the relaxation of supercoiled, circular dsDNA by topoisomerase I Xu and Bremer (1997). There, it was speculated that neutralization of the DNA’s backbone charge by magnesium(2+) ions diminishes intramolecular repulsion, effectively stabilizing the helical twist of the molecule. The subsequent inversion of the effect at still higher magnesium concentrations is not observed in our study, however.
In conclusion, we have investigated the effect of magnesium cations on DNA twist–stretch coupling. To this end, we have developed a robust analysis approach for force–extension data, based on the twistable worm-like chain model. Our approach gives access to the elasticity regime between 30 and , and thus to information about twist–stretch coupling, directly from stretching data. We have shown that in the range of magnesium concentrations investigated (0–, in a background of ), the persistence length and stretch modulus of double-stranded DNA are unaffected. DNA twist, however, is stabilized, indicated by a nearly 20% decrease of the twist–stretch coupling parameter .
Interestingly, our analysis also shows that the twistable worm-like chain does not model DNA’s full elastic response up until the overstretching transition. A gap of a few piconewton is left, over which the model significantly deviates from the data. This could be due to an early onset of overstretching, possibly in GC-rich areas King et al. (2013). Future theoretical modeling efforts, possibly taking into account more aspects of DNA’s molecular structure, may shed light on this small gap.
Acknowledgements.
We would like to thank T.T. Perkins for suggesting the initial experiment, and M.C.M. de Gunst for useful discussions. This work has been supported by grants from the Foundation for Fundamental Research on Matter (FOM), which is part of the Netherlands Organization for Scientific Research (NWO), and the European Research Council (consolidator grant).References
- Smith et al. (1992) S. B. Smith, L. Finzi, and C. Bustamante, Science (New York, N.Y.) 258, 1122 (1992).
- Wang et al. (1997) M. D. Wang, H. Yin, R. Landick, J. Gelles, and S. M. Block, Biophysical journal 72, 1335 (1997).
- Moffitt et al. (2008) J. R. Moffitt, Y. R. Chemla, S. B. Smith, and C. Bustamante, Annual review of biochemistry 77, 205 (2008).
- Heller et al. (2014) I. Heller, T. P. Hoekstra, G. A. King, E. J. G. Peterman, and G. J. L. Wuite, Chemical reviews 114, 3087 (2014).
- Odijk (1995) T. Odijk, Macromolecules 28, 7016 (1995).
- Marko and Siggia (1995) J. F. Marko and E. D. Siggia, Macromolecules 28, 8759 (1995).
- Gross et al. (2011) P. Gross, N. Laurens, L. B. Oddershede, U. Bockelmann, E. J. G. Peterman, and G. J. L. Wuite, Nature Physics 7, 731 (2011).
- Gore et al. (2006) J. Gore, Z. Bryant, M. Nöllmann, M. U. Le, N. R. Cozzarelli, and C. Bustamante, Nature 442, 836 (2006).
- Lionnet et al. (2006) T. Lionnet, S. Joubaud, R. Lavery, D. Bensimon, and V. Croquette, Physical Review Letters 96, 178102 (2006).
- Bustamante et al. (1994) C. Bustamante, J. F. Marko, E. D. Siggia, and S. Smith, Science 265, 1599 (1994).
- van Mameren et al. (2009) J. van Mameren, P. Gross, G. Farge, P. Hooijman, M. Modesti, M. Falkenberg, G. J. L. Wuite, and E. J. G. Peterman, Proceedings of the National Academy of Sciences of the United States of America 106, 18231 (2009).
- Zhang et al. (2013) X. Zhang, H. Chen, S. Le, I. Rouzina, P. S. Doyle, and J. Yan, Proceedings of the National Academy of Sciences 110, 3865 (2013).
- Chiu and Dickerson (2000) T. K. Chiu and R. E. Dickerson, Journal of molecular biology 301, 915 (2000).
- Guéroult et al. (2012) M. Guéroult, O. Boittin, O. Mauffret, C. Etchebest, and B. Hartmann, PloS one 7, e41704 (2012).
- Baumann (1997) C. G. Baumann, Proceedings of the National Academy of Sciences 94, 6185 (1997).
- Wenner et al. (2002) J. R. Wenner, M. C. Williams, I. Rouzina, and V. a. Bloomfield, Biophysical journal 82, 3160 (2002).
- Jerkovic and Bolton (2001) B. Jerkovic and P. H. Bolton, Biochemistry 40, 9406 (2001).
- van den Broek et al. (2010) B. van den Broek, M. C. Noom, J. van Mameren, C. Battle, F. C. Mackintosh, and G. J. L. Wuite, Biophysical journal 98, 1902 (2010).
- Candelli et al. (2011) A. Candelli, G. J. L. Wuite, and E. J. G. Peterman, Physical chemistry chemical physics : PCCP 13, 7263 (2011).
- Mohammad-Rafiee and Golestanian (2004) F. Mohammad-Rafiee and R. Golestanian, Physical Review E 69, 061919 (2004).
- Mosconi et al. (2009) F. Mosconi, J. Allemand, D. Bensimon, and V. Croquette, Physical Review Letters 102, 078301 (2009).
- Bevington and Robinson (2003) P. Bevington and D. Robinson, Data Reduction and Error Analysis for the Physical Sciences, 3rd ed. (2003).
- Note (1) We should note that this is a non-issue for magnetic tweezers experiments: in such data, the distance variable carries the most significant error, and Eq. (1) can be used as-is.
- Xu and Bremer (1997) Y. C. Xu and H. Bremer, Nucleic acids research 25, 4067 (1997).
- King et al. (2013) G. A. King, P. Gross, U. Bockelmann, M. Modesti, G. J. L. Wuite, and E. J. G. Peterman, Proceedings of the National Academy of Sciences of the United States of America 110, 3859 (2013).