X-ray cavities and temperature jumps in the environment of the strong cool core cluster Abell 2390
Abstract
We present results based on the systematic analysis of high resolution 95 ks Chandra observations of the strong cool core cluster Abell 2390 at the redshift of = 0.228 that hosts an energetic radio AGN. This analysis has enabled us to investigate five X-ray deficient cavities in the atmosphere of Abell 2390 within central 30″. Presence of these cavities have been confirmed through a variety of image processing techniques like, the surface brightness profiles, unsharp masked image, as well as 2D elliptical model subtracted residual map. Temperature profile as well as 2D temperature map revealed structures in the distribution of ICM, in the sense that ICM in the NW direction is cooler than that on the SE direction. Temperature jump in all directions is evident near 25″ (90.5 kpc) corresponding to the average Mach number 1.440.05, while another jump from 7.47 keV to 9.10 keV at 68″ (246 kpc) in the north-west direction, corresponding to Mach number 1.220.06 and these jumps are associated with the cold fronts. Tricolour map as well as hardness ratio map detects cool gas clumps in the central 30 kpc region of temperature keV. The entropy profile derived from the X-ray analysis is found to fall systematically inward in a power-law fashion and exhibits a floor near 12.202.54 keV cm2 in the central region. This flattening of the entropy profile in the core region confirms the intermittent heating at the centre by AGN. The diffuse radio emission map at 1.4 GHz using VLA L-band data exhibits highly asymmetric morphology with an edge in the north-west direction coinciding with the X-ray edge seen in the unsharp mask image. The mechanical power injected by the AGN in the form of X-ray cavities is found to be 5.941045 erg s-1 and is roughly an order of magnitude higher than the energy lost by the ICM in the form of X-ray emission, confirming that AGN feedback is capable enough to quench the cooling flow in this cluster.
Keywords galaxies:active-galaxies:general-galaxies:
clusters:individual: Abell 2390-intergalactic medium-X-rays:galaxies:clusters
1 Introduction
Superb resolution achieved by the Chandra X-ray Observatory has enabled us to investigate the thermodynamical and chemodynamical properties of the X-ray emitting intracluster medium (ICM) at greater details, including the detection of fluctuations in the surface brightness distribution of the ICM. As a result, majority of the studies in the last two decades were focused on the exploration and understanding of the energetic feedback from super-massive black hole (SMBH) residing at the core of the largest gravitationally bound systems like groups and clusters of galaxies (see review by Fabian, 2012). AGNs are believed to be powered by the binding energy released by the accretion of matter onto the SMBH. Now it is widely accepted that the energetic feedback from the AGN plays a significant role in the evolution of galaxies as well as the ICM, however, the form in which this energy is released is not yet fully understood.
The commonly observed signatures of the AGN interactions with the ICM are the bubbles or cavities in the X-ray surface brightness distribution (Dong et al., 2010; Randall et al., 2011; David et al., 2009; Rafferty et al., 2006; Pandge et al., 2012, 2013). In addition, sharp discontinuities or edges in the surface brightness associated with the shocks and cold fronts have also been observed in few of the clusters (e.g., Abell 1795, RXJ1720.1+2638, Abell 2142, Abell 754, Abell 3667, Abell 2204). These bubbles are often found in association with the cooling flow or the “cool core” clusters and are filled with radio emission originating from the central AGN. Some of the spectacular examples of the cool core clusters with radio bubbles are the Perseus cluster (Fabian et al., 2003, 2006), M87 (Forman et al., 2005), Hydra A (Nulsen et al., 2005), MS0735.6+7421 McNamara et al., 2005, Abell 3581 Canning et al., 2013, HCG 62 Gitti et al., 2010, and Abell 2052 (Blanton et al., 2001, 2009, 2011).
Combined observations of the ICM in the radio and X-ray bands have provided us with several incidences of common appearance of cavities, shocks and ripples, confirming the widespread impact of the AGN feedback from the central SMBH (e.g. Bîrzan et al., 2004, 2008; Blanton et al., 2001; David et al., 2009; Giacintucci et al., 2011). In the AGN feedback scenario, the radio source associated with the central cD galaxy drives strong jet outflows which interact with the hot ICM and inflate lobes of radio-synchrotron emission. As a consequence, the gas gets displaced and results in the formation of buoyantly rising bubbles. Cavities or bubbles are nothing but the depressions in the X-ray surface brightness consisting of low density relativistic plasma, that float upward in the cooling flow atmosphere until they reach equilibrium at some large radius where the ambient entropy is equal to that within the bubble (Rafferty et al., 2006).
The jet-blown cavities in the X-ray atmosphere of the clusters can act as calorimeter and hence provide a direct probe to estimate the energy input by the AGN jet in the form of mechanical feedback. Systematic studies employing deep observations with high resolution Chandra X-ray telescope have demonstrated that AGN can inject upto about 1058-1062 erg per outburst into the ICM (see McNamara & Nulsen, 2007, for review). This amount of mechanical energy injected by the AGN feedback is sufficient to heat as well as quench the cooling of the ICM on the cluster scales (Bîrzan et al., 2004; Rafferty et al., 2006), and whose balance can be checked by comparing it with the energy lost by the ICM in the form of X-ray emission. To better understand the interactions between the AGN feedback and the surrounding ICM; and to confirm the balance between mechanical power fed by the AGN versus that lost by the ICM through the radiative loss, it is important to explore X-ray bright systems with apparent signatures of such interactions. Abell 2390, as it hosts a powerful radio source at its core, is a potential candidate to investigate such a balance between the AGN feedback and radiative loss by the ICM.
In this paper we present 95 ks Chandra observations of the cool core cluster Abell 2390 (ObsID 4193). This is a moderately rich cluster hosting about 216 members at a redshift of = 0.228 (Abraham et al., 1996; Yee et al., 1996). Its central dominant galaxy, PGC 140982, hosts a strong and complex radio source (B2151+174, Augusto et al., 2006 and Egami et al., 2006). Deep optical broadband images of the central dominant galaxy PGC 140982 exhibit a wealth of structures including a significant amount of dust and molecular gas surrounding the cD galaxy (Pipino et al., 2009, Bardeau et al., 2007) and appears very luminous in the H and IR bands (Rawle et al., 2012). The star formation rate estimated in the core of this cluster using the H flux is found to be 15 /yr (Haines et al., 2012). ICM in Abell 2390 exhibit a strong peak in the X-ray surface brightness profile (Allen et al., 2001) and also exhibit several other substructures such as X-ray cavities and breaks in the X-ray surface brightness profile (Allen et al., 2001, Vikhlinin et al., 2005). The central cooling time of the ICM in this cluster is =1.9 Gyr with = 60.91 kpc (Hlavacek-Larrondo et al., 2011).
This paper is organized as follows: Section 2 describes the data sets used for the present study and its reduction procedure, Sections 3 and 4 discuss the imaging and spectral analysis of the data set, Section 5 discussion of our results, while Section 6 summarizes results from this study. Throughout this paper we assume the CDM cosmology with = 71 km s-1 Mpc-1, = 0.27, and = 0.73. At the redshift of Abell 2390 ( = 0.228) this cosmology corresponds to a scale of 1″= 3.62 kpc and the luminosity distance of the cluster 1125 Mpc (Table 1). All the errors reported in this paper are at 68 confidence level (i.e. 1) unless otherwise stated.
2 Observations and data preparation
Abell 2390 was observed with the Chandra Advanced CCD Imaging Spectrometer (ACIS-S) three times during November 1999 and September 2003 with effective exposure times of 10 ks (ObsID 500), 10 ks (ObsID 501) and 95 ks (ObsId 4193). ObsIDs 500 and 501 were performed in the FAINT mode and were badly affected by the background flares. Therefore, we acquired level 1 event file corresponding to the ObsID 4193 and reprocessed it using the latest version of the CIAO software (CIAO v 4.2) and calibration files CALDB 4.5.5.1 provided by the Chandra X-ray Center. Charge transfer inefficiency (CTI) and time-dependent gain corrections were applied wherever applicable. Periods of high background flares were identified and filtered out using the 3 clipping of the full-chip light curve using the task lcclean within CIAO. This resulted in the net exposure time of 88.63 ks.
As diffuse X-ray emission from Abell 2390 fills the image field of view, therefore standard CALDB blank sky background frames were preferred for the background correction. The appropriate blank-sky background frames were processed in a similar way as that of the event file, reprojected to the corresponding sky position and were normalized to match the count rate in the 9 - 12 keV energy band in the observed data set. The background subtracted science frame was then divided by the exposure map generated using the mkexpmap so as to account for the exposure variation of the data. Point sources present in the CCD field were detected using the wavelet detection tool wavdetect within CIAO with a detection threshold of 10-6 and were inspected visually before excluding from the subsequent analysis. A cleaned, background subtracted 0.3 - 7 keVChandra image of Abell 2390 is shown in Figure 2 (left panel). This figure has been smoothed with a 3 wide Gaussian.
| RA DEC (J2000) | 21:53:36.8; +17:41:44.00 |
|---|---|
| Mag () | 17.6 |
| Distance (Mpc) | 1125 |
| Ang. Distance (Mpc) | 746 |
| Redshift () | 0.228 |
| Radial Velocity (km s-1) | 68353 |
| Morphology | Medium Compact (Zw) |
| Cluster Diameter | 20′ |
3 X-ray Imaging Analysis
3.1 Surface Brightness Profiles

| (arcsec) | (Arbitrary Unit) | (arcsec) | (Arbitrary Unit) | ||
|---|---|---|---|---|---|
| 524.84 | 10 | 4.42 | 19.04 | 0.74 | 57.86 |
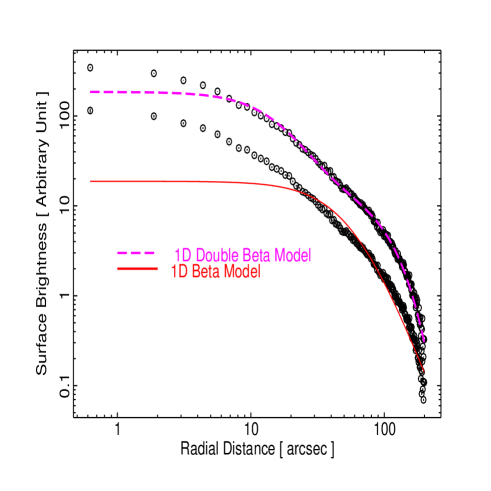
In order to investigate 2D distribution of the ICM in Abell 2390, we computed surface brightness profile of the extended emission from Abell 2390 by extracting 0.5-3.0 keV X-ray photons from a series of concentric elliptical annuli centred on the X-ray peak of the cluster emission using the task dmextract within CIAO. The centre, ellipticity and position angle of Abell 2390 were determined by fitting a two-dimensional Lorentzian surface (Wise et al., 2004). The centroid of Abell 2390 was found at RA=21:53:36.82 and DEC=+17:41:43.00, while average ellipticity and position angle of the ellipses were found to be 0.36 and 38, respectively. The resulting background subtracted surface brightness profile is shown in Figure 1 (left panel). Assuming that the X-ray emitting hot gas and galaxies in the cluster are in hydrostatic equilibrium and galaxies exhibit isothermal distribution described by the King model (Gitti et al., 2012, see review by), we fit this surface brightness profile with a single -model given by
where , , and represent the central X-ray surface brightness, surface brightness at projected distance , core radius and slope parameter, respectively. The fitting was performed using the Sherpa model beta1d in conjunction with the statistics of the Gehrels’ variance and is shown in Figure 1 (left panel). Like in other cooling flow clusters, X-ray emission from Abell 2390 also exhibit the central excess with respect to the 1D -model and provides a strong evidence for the association of a cool core with this cluster. The model is widely used in literature to investigate 2D distribution of ICM which yields the core radius and the slope of the surface brightness decrement. However, this 1d beta model resulted in a poor fit particularly in the central region. The resultant best fit parameters of the 1D -model are: = 60″.10 ( 217 kpc) and = 0.82 and are in 1 agreement with those obtained by Hicks et al. (2006).
To account for the excess emission from the cool core of Abell 2390 we added another -component to it. The resultant model is called as double- model or two -model and takes the form :
where the new surface brightness, core radius and slope-parameter are represented by , , and , respectively. Conventionally, the core radius of the central X-ray emission is presented by , while the overall X-ray emission of the cluster is presented by . Addition of this second -component provided a better description for the X-ray emission from this cluster over the entire region with the best fit values = 0.74, ( 68.92 kpc) and a steep component with slope parameter = 10 to constrain the cusp part in the surface brightness distribution of Abell 2390. All fitting parameters given in Table 2.
To highlight fluctuations in the X-ray surface brightness distribution due to the presence of X-ray cavities and other features, we computed surface brightness profiles of the background-subtracted X-ray image of Abell 2390 by extracting 0.53.0 keV counts from the four different sectors as marked in Figure 3. Here, N-sector covers region of 20∘ - 130∘, E-sector covers 130∘ - 190∘, S-sector covers 190∘ - 290∘, while the W-sector covers 290∘ - 20∘, all angles measured in counter-clockwise direction. The resulting surface brightness profiles along with the best fit double -model are shown in Figure 1 (right panel). Dips in the surface brightness distributions at the locations of the X-ray cavities are clearly apparent in contrast to the best fitted double -model. The deficit in the X-ray emission evident at 10″ in the surface brightness profile along the W-sector hint towards the presence of cavities. The large depression apparent between 25 and 75″ along the E Sector point towards the bigger deficit region along this direction.
3.2 X-ray Cavity Detection
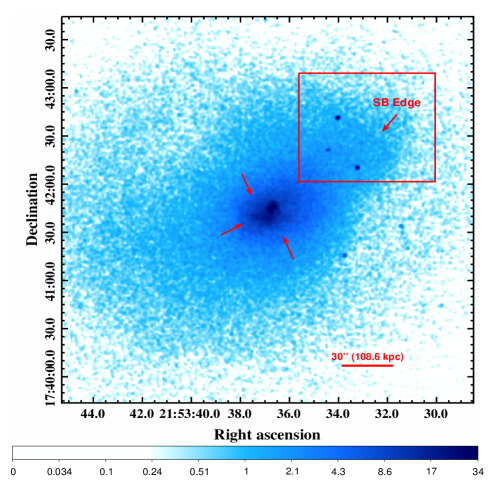

Though the presence of X-ray cavities and other features in Abell 2390 have been reported (Vikhlinin et al., 2005, 2006; Russell et al., 2013), detailed analysis of the X-ray cavities using the latest 95 ks Chandra data were not available in the literature. Therefore, in this paper we present systematic analysis of the latest dataset. Figure 2 (left panel) clearly reveals asymmetric distribution of the X-ray emission with an elongation along the north-west (NW) to the south-east (SE) direction and also hints towards the presence of a pair of X-ray cavities, one each on the north-east (NE) and the south-west (SW) direction of the X-ray peak. We investigate these structures in further details by employing a variety of image processing techniques such as, unsharp-masking, residual maps, IRAF111http://iraf.noao.edu/ ellipse fitting as well as by deriving the surface brightness profiles of the diffuse X-ray emission in different regions.
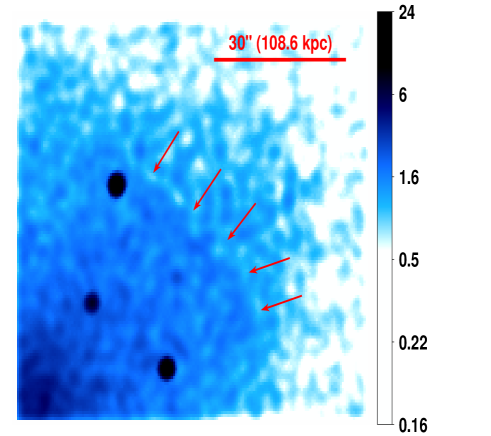
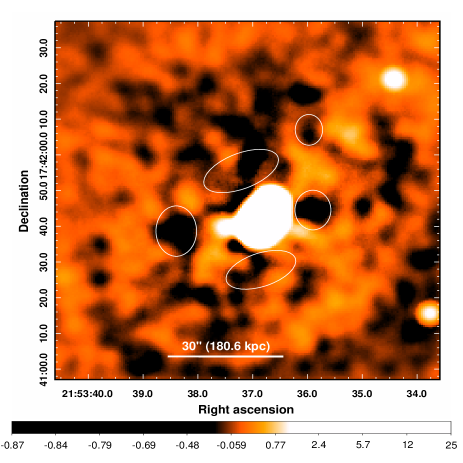
To identify the depressions in the Chandra X-ray image, we created unsharp-masked image of Abell 2390 in the 0.5-3 keV energy range by subtracting a strongly smoothed image (12 pixels) from that smoothed lightly (2 pixels) and is shown in Figure 3. This figure reveals two prominent X-ray depressions (cavities) one each on the north-east and the other on south-west of the X-ray peak of the cluster centre. In addition to this, this figure also reveals three more relatively fainter X-ray cavities. These cavities in the unsharp masked image are highlighted by ellipses.
To better visualize the structures in the surface brightness distribution in two dimensions, we created residual map of Abell 2390 by subtracting the simulated smooth elliptical 2d model from the cluster emission generated fitting a two-component 2d model to the surface brightness distribution of X-ray emitting gas. The resultant residual map is shown in Figure 4 (left panel), which reveals the structures apparent in the unsharp masked image. However, as this 2d model assumes spherical symmetry as well as hydrostatic equilibrium of the of the gas, therefore the results at smaller radii do not match perfectly with those seen in the unsharp masked image. Particularly, the morphologies of the X-ray cavities in the two images are not identical. However, the actual distribution of the X-ray emitting gas exhibits a very complex structure and vary strongly as a function of position angle. As a result the output image do not represent the true distribution of the gas and hence the morphological difference between the residual map and the unsharp masking image. The excess X-ray emission (bright shades) in the central region as were seen in the unsharp mask image are also apparent in this figure. We also checked morphology as well as presence of the cavities and other features by subtracting elliptical model by fitting ellipses to the iso-intensity contours in the cleaned X-ray image using the task ellipse available within IRAF. While fitting the ellipses, centre coordinates were fixed at the location of the BCG, whereas the eccentricity and position angle were allowed to vary. Resultant elliptical model subtracted residual map is shown in Figure 4 (right panel).
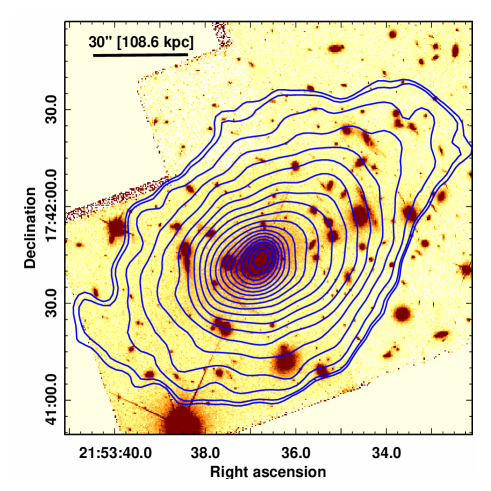
To compare the extent of the X-ray emission from Abell 2390 with its optical counterpart, we overlay the 0.3-7 keV X-ray iso-intensity contours on the HST I band (F814W) image (Figure 5). This figure clearly reveals the asymmetric and elongated nature of the X-ray emission with its centre coinciding with the cD galaxy PGC 140982, whose optical centre lies within 0.″5 of the X-ray centre of Abell 2390.

3.3 X-ray Surface Brightness Edge
The Chandra raw image in the energy 0.3-7 keV, smoothed with 3 pixel Gaussian kernal shown in Figure 2, revealed X-ray surface brightness (SB) edge at 68 arcsec on NW direction of the X-ray centre of Abell 2390 (highlighted by red arrows). The zoomed in view of the surface brightness edge is shown in Figure 2 (right panel). This SB edge appears like 110 kpc long X-ray arc. Deeper X-ray observations of this cluster are called for to explore this SB edge in further detail. This X-ray surface brightness edge is found to coincide with the complex edge in the radio diffuse emission map obtained using 1.4 GHz VLA calibrated images available in the archive of NRAO 222https://archive.nrao.edu/archive/.
3.4 Substructures in the central region
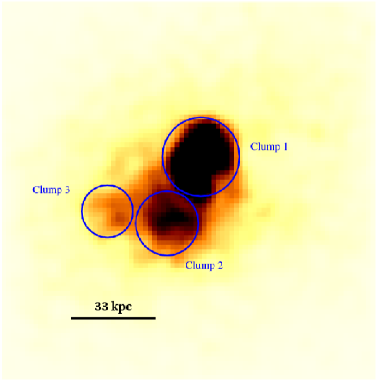

0.5-3 keV Chandra blank-sky background subtracted exposure corrected image created for the central 1′ ( 217 kpc) region reveals clumpy or knot-like complex substructures (Figure 6 left panel) similar to that reported earlier in several other systems, e.g. Centaurus A (Sanders et al., 2001), Abell 1991 (Sharma et al., 2004; Pandge et al., 2013), 2A0335+096 (Mazzotta et al., 2003). These clumpy sub-structures are comprised of several finer knot-like structures on arcsecond scales and are connected to one another.
To examine structure of these clumpy regions we produced a tri-colour map of the central region of Abell 2390. For this, we filtered the Chandra image in three different energy bands namely, the soft (0.5-1 keV, shown in red colour), the medium (1-2 keV, shown in green) and the hard band (2-10 keV, shown in blue) and were then combined after proper scaling. The adaptively smoothed tri-colour map of the central 1 arcmin ( 217 kpc ) of Abell 2390 is shown in Figure 6 (right panel), which illustrates the clump-like structures in the medium band. This figure reveals that the central substructures are due to the relatively warmer components compared to its surrounding.
4 Spectral Analysis
To examine spectral properties of hot gas in the regions of enhanced and suppressed X-ray emission, we extracted X-ray spectra from each of the region of interest separately using the CIAO script specextract. For each extraction, background spectra were obtained from the same region in the “blank-sky” and were normalized equating the 9-12 keV count rates of the observed and background data. Weighted responses were generated for each extraction and the spectral fitting was performed using the XSPEC version 12.7.1 (Arnaud et al., 1996).
| Regions | Best-fit | Abundance | /dof | Net Counts | |
|---|---|---|---|---|---|
| model | (keV) | () | |||
| N - cavity | (PHABS*APEC) | 135.66/150 = 0.90 | 3478 | ||
| S - cavity | (PHABS*APEC) | 101.21/134 = 0.75 | 2950 | ||
| E - cavity | (PHABS*APEC) | 81.48/78 = 1.04 | 1510 | ||
| W - cavity | (PHABS*APEC) | 106.4/120 = 0.88 | 2467 | ||
| NW - cavity | (PHABS*APEC) | 13.67/18 = 0.91 | 376 | ||
| Gas Clump 1 (4.″17) | (PHABS*APEC) | 194.84/162 = 1.20 | 5038 | ||
| Gas Clump 2 (3.″40) | (PHABS*APEC) | 143.56/134 = 1.07 | 3253 | ||
| Gas Clump 3 (2.″77) | (PHABS*APEC) | 45.07/62 = 0.73 | 2058 | ||
| Total Gas Clumps | (PHABS*APEC) | 224.06/224 = 1.00 | 10375 | ||
| SB Edge | (PHABS*APEC) | 179.08/195 = 0.92 | 5826 | ||
| Cluster Diffuse Emission | (PHABS*APEC) | 527.54/453 = 1.17 | 178445 |
Notes: col 1 - regions of interest explored by spectral analysis in the energy range 0.57 keV (quantities in the bracket indicate radius), col 2 - best-fit model, col 3 & 4 - temperature and abundance, respectively, col 5 - goodness of the fit, and col 6 - net X-ray counts extracted from the regions of interest.


4.1 Profiles of temperature and other parameters
To examine the radial dependence of the gas properties, we computed projected radial temperature and metallicity profiles by fitting 0.57 keV spectra extracted from elliptical annuli centred on the centroid of the diffuse emission from Abell 2390. Each elliptical annulus was taken to have the major-to-minor axis ratio and position angle as set above and the radial bin width of each annulus was adjusted so as to get at least 6,400 background subtracted counts (S/N 80). Source spectra, background spectra, photon-weighted response files and photon-weighted effective area files were generated for each of the elliptical annulus using the CIAO task specextract and was fitted with an absorbed single-temperature apec model within XSPEC adopting the -statistics. Temperature, abundance and normalization parameters were allowed to vary during the fit, while the foreground column density was fixed at the Galactic value of cm-2 (Vikhlinin et al., 2005).

Resulting projected temperature profile derived from this analysis is shown in Figure 7 (top left) by open stars. This profile clearly reveals an increase in temperature of the X-ray emitting gas from a minimum of 6.69 keV to 7.88 keV at about 20″. Then it drops to a value of 7.5 keV and remains constant upto 45″ shown by red ellipse. It once again show a rise upto 10.5 keV at 68″ and again drops to 7.88 keV, which latter remains roughly constant upto about 150″. Beyond 150″ temperature again rises to 10.20 keV. Prominent temperature jumps at 20″ and 68″ are highlighted by vertical dotted lines and are probably associated with cold fronts. Similar trends in the temperature profiles have been reported in clusters with cooling cores (Gastaldello et al., 2007; Rasmussen et al., 2007; David et al., 2009; Sun et al., 2009; Gitti et al., 2011).
In order to investigate the origin of the constant temperature seen in the projected temperature profile from 30″ to 45″ highlighted by red ellipse. We created hardness ratio map by dividing a 1.5-8 keV image by a 0.3-1.5 keV image. Before division both images were smoothed by a Gaussian kernel of 10 pixel (5″ ). The resultant map is shown in Figure 9. In the figure dark shades are represents regions of low temperature gas. These regions of cooler gas are extending towards the north-east and the south-west side of the cluster. By visual inspection of the hardness ratio map, we selected most prominent regions marked by blue regions (see Figure 9). We then excluded these regions and extracted the spectra from the same annuli and generated the temperature profile shown by filled square data points in Figure 7 (top left). As evident from the comparison of the two profiles, the stage of constant temperature has been removed and the temperature profile look like cool core clusters. This clearly indicates that the marked regions must contains low temperature gas. Cool gas excluded profile also confirm the temperature jump at 20″ and at 68″ which then remains roughly constant at 10 keV.
To determine the three-dimensional structure of the ICM we performed a deprojection analysis of the X-ray photons extracted from concentric elliptical annuli as above, but in this case widths of the elliptical annuli were adjusted so as to achieve S/N40. Using the “onion peeling” method of Blanton et al. (2003), we derive the deprojected temperature profile. Here, temperature, abundance and normalization parameters were first derived for the spectrum extracted from the outermost annulus by fitting it with an absorbed apec model. Then the spectrum from annulus interior to it was fit by adding one more apec component to that for the outer annulus, with fixed temperature and abundance but normalization scaled to project from the outer to the inner annulus and the procedure was continued till the centre of the cluster. Profile of the deprojected temperature is plotted in the same figure (Figure 7 top left) and is shown by filled blue triangles. A comparison of the two temperature profiles reveal that the deprojected temperature profile roughly follow the same trend as of the projected analysis. Here a sharp temperature rise from 6 keV to 13.25 keV is seen at about 20″ which then drops to 7 keV indicating towards a cold front.
To investigate these temperature jumps in further details, we compute the temperature profiles using the spectral extraction from four different sectors (N, E, S, and W) as used above for computing the surface brightness profiles. Annular regions in each sector were selected so as to have a minimum of 6400 background subtracted counts (S/N80). Extracted spectra were then treated in the same way as discussed above in the radial profiles and the results are shown in Figure 8. Temperature profile derived along the W-sector shows a monotonic rise from 6.16 keV to 7.16 keV at 20″, also temperature jump observed at the location of SB edge from 7.47 keV to 9.10 keV. Temperature profiles along the N sector show jump from 6 keV to 9.25 keV at 15″ (54 kpc), along the S sector from 6.3 keV to 8.5 keV at 25″ (90.5 kpc), along the E sector 6 keV to 10.27 keV at 25″ (90.5 kpc) and along the W sector from 6.16 keV to 7.16 keV at 20″ (72.4 kpc). These jumps apparent in the temperature profile along the N, S, E and W sector provide the clearest indication regarding their association with the cold fronts. The same locations of jumps in all the profiles, indicates that cold fronts covers nearly circular region surrounds the BCG. After confirming jumps in the temperature profiles along the all sectors, we next compute the Mach number associated with the cold fronts. The Mach number corresponding to the jump along N sector is 1.540.08, S sector is 1.360.11, E sector is 1.690.09 and W sector is 1.170.10. We got average Mach number as 1.440.05. Whereas, Mach number at SB edge is 1.220.06.
The radial metal abundance profile computed for Abell 2390 is shown in Figure 7 (top right). The metal abundance at the location of temperature jumps (at about 20″ and 68″ ) exhibit a small rise, and are consistent with that seen in other cool core clusters (Allen et al., 1998; Gastaldello et al., 2007; Rasmussen et al., 2007; David et al., 2009; Sun et al., 2009; Pandge et al., 2012, 2013).
At the cluster temperature computed above, the ICM is hot and nearly fully ionized. Therefore, the surface brightness distribution can be considered as a tracer of the electron number density . Hence using , we compute the electron number density and its variation in the form of electron density profile which is shown in Figure 7 (bottom left). For this we used the normalization parameter of the apec component in radial temperature profile and assumed , for a fully ionized gas with hydrogen and helium mass fractions of and , respectively.
4.2 Entropy Profile
The entropy index of the ICM offers a direct probe to investigate heating and cooling processes in the central region of the clusters relative to the individual temperature and density profiles. Owing to which we also derive the entropy, defined as , profile of the X-ray emission distribution from Abell 2390 and is shown in Figure 7 (bottom right). The radial entropy profile derived for Abell 2390 is found to fall systematically in the radially inward direction. To examine its nature we fit this entropy profile by a powerlaw model (Cavagnolo et al., 2009). Here, represents the core excess entropy or entropy floor above the best-fit powerlaw, the entropy at 100 kpc, and the power law index (1.07). The best fit model is shown by the blue dotted line in this figure with = keV and the entropy floor of = 12.202.54 keV. Thus, flattening of the mean entropy index towards the central projected value of 12.202.54 keV indicate towards an intermittent heating of the ICM. If cooling of the ICM is not compensated by heating, the ICM will radiate away whole of its thermal energy on a timescale of 1.9 Gyr (Hlavacek-Larrondo et al., 2011; Cavagnolo et al., 2009) and the entropy profile will follow the nature shown by red continuous line in this figure which represent a pure cooling system. Notice the significant deviation in the central region pointing towards the entropy floor at keV .


4.3 Temperature and metallicity maps
To trace the local variations of temperature and metal abundance of the ICM, we create two-dimensional temperature and abundance maps using the 95 ks Chandra data. To achieve this, X-ray photons were extracted from maps created using the CONTBIN adaptive binning algorithm described by Sanders et al. (2006). This algorithm locates the brightest pixels in the point source removed X-ray image and generates spatial bin around it including all neighbouring pixels with same brightness till the user-defined S/N threshold is not meet, which then moves outward and repeat the same exercise. The minimum S/N threshold was set to 60 ( 3600 counts). Shape of each of the bin was restricted such that its length is at most two times of its width. This resulted in a spatially binned image which follows the surface brightness distribution (Tremblay et al., 2012). 0.5-7 keV source spectra, corresponding background, and associated response files were extracted for each of the region. The source spectra were then grouped to have a minimum of 15 counts in each bin. Each spectrum was then fitted with an absorbed thermal plasma model apec, letting the temperature, metallicity and normalization to vary. The resulting temperature and metallicity maps for Abell 2390 are shown in Figure 11 and reveals structures in both. The colourbars in this figure give the best fit temperature and abundance values in units of keV and , respectively. The average temperature of the ICM on the north-western direction is statistically lower than that on the south-eastern direction. The large-scale temperature structure of Abell 2390 reveals its association with a cool core at the centre, where temperature drops to just 4 keV relative to its virial value of 10 keV.
Similar structures are also apparent in the metallicity map. The central abundance in Abell 2390 is roughly 0.54 which then decreases with radius until it reaches 0.15. Regions of enhanced metallicity are seen along the north and south direction at about 20″ (72 kpc) on either directions. This region is associated with the temperature jump at 20″ evident in Figure 7 (top left & top right). A comparison of the temperature and metallicity maps of Abell 2390 reveals that the regions of the high ICM temperature corresponds to poor metallicites, and are in good agreement with those reported by Baldi et al. (2007) and Vikhlinin et al. (2005). Low metallicity wider regions one on the north-east and the other on the south-west direction are evident.
4.4 Cluster Diffuse Emission
To determine the weighted average properties of the diffuse X-ray emission we extracted and fitted a combined spectrum for the total diffuse emission from within an elliptical region with semi-major axis 120″ ( 434 kpc) region. We excluded the central 1.″5 region as well as the regions of obvious point sources. This yielded a total of 178,445 background-subtracted counts in the energy range between 0.57 keV, which were then binned so as to have atleast 40 counts per bin. We initially fitted the spectrum with an absorbed single temperature apec model, letting the temperature, abundance and normalization to vary and fixing the absorption at the Galactic value (Vikhlinin et al., 2005). The resulting model yielded the best fit average temperature and abundance equal to = 8.270.09 keV and = 0.330.02 , respectively, where the errors corresponds to 68% confidence level. This single temperature APEC fit models the gas adequately at larger radii but gives poor fit in the inner region below 1 keV. This is indicative of the relatively low temperature gas at the centre of the cluster. To account for this cooler component, a second thermal component was added to the original model with column density fixed. The two-temperature model provided a significant improvement in the fit with the best fit temperatures equal to 9.56 keV and 0.82 keV at /dof = 498.86/498. The best fit spectrum is shown in Figure 10 (right panel), while the resultant parameters are listed in Table 3. We quantified the unabsorbed X-ray luminosity using the LUMIN function equal to = 1045 erg s-1.
4.5 Nuclear Point Source
Wavdetect algorithm detected a central X-ray point source in the cluster that coincides with the optical core of the cD galaxy as well as the radio source in the 1.4 GHz radio image of VLA. To investigate spectral properties of the nuclear source associated with Abell 2390, we extracted a 0.5-7 keV spectrum from within the central 2″circular region, background for which was determined locally from an annulus surrounding the source. The spectrum was initially fitted with an absorbed power-law, which yielded into an acceptable fit with photon index and /dof = 52.06/50.
We then tried with an additional absorption component intrinsic to the source, which resulted in a slightly better fit with /dof = 49.72/49 and photon index . This means the central source in Abell 2390, like that in other AGN cases, hosts sufficiently hard component. The additional absorbing column density was found to be equal to 6.87 1020 cm-2 and is not significantly large relative to the Galactic value of 1.07 1021 cm-2 (Vikhlinin et al., 2005). From this thermal plus power-law model we estimate the unabsorbed 0.3-12 keV flux of the central source equal to , and the X-ray luminosity .
4.6 Central gas clumps
In order to examine the spectral nature of the hot gas clump-like substructures apparent in the central region of Abell 2390 (Figure 6), we extract 0.5-7 keV spectra from each of the clumpy substructure and fit with an absorbed single-temperature apec model. The best fit parameters of the spectra from these three different clumpy regions reveal a systematic rise in temperature of the gas in clumps 1, 2, 3 (Table 3) with highest temperature 5.21 keV for clump 3. Existence of the gas clumps of systematically increasing temperatures and metallicity in the central region of this cluster suggests that Abell 2390 has passed through a merger episode and has not yet fully relaxed. Similar cases have also been reported in the past (e.g. Abell 262; Blanton et al., 2004). A combined 0.5-7 keV spectrum of the X-ray photons from all the three clumpy regions was fitted with an absorbed apec model is shown in Figure 10 (left panel) and the best fit parameters are listed in Table 3.
5 Discussion
5.1 Cavity Energetics
| Cavity Parameters | E Cavity | W Cavity | N Cavity | S Cavity | NW Cavity |
|---|---|---|---|---|---|
| (kpc) | 25.55 | 20.01 | 37.54 | 34.46 | 12.88 |
| (kpc) | 18.93 | 16.94 | 17.81 | 16.79 | 09.60 |
| (kpc) | 85.07 | 39.82 | 50.68 | 51.40 | 94.12 |
| (yr) | 2.87 | 1.04 | 1.09 | 2.89 | 4.73 |
| (erg s-1) | 7.10 | 1.58 | 2.72 | 8.6 | 7.2 |
Note : , - semi-major axes along and perpendicular to the jet direction, respectively, D represents the projected distance from the core to cavity centre; - age of the cavities estimated using buoyancy rise; and - cavity power using buoyancy age.
X-ray cavities or depressions in the surface brightness distribution are devoid of gas at the local ambient temperature and are believed to be formed due to the interactions between the AGN outbursts and the hot ICM. During an AGN outburst, the jets emanating from the central source do pV work on the surrounding ICM, inflate cavities which then rises buoyantly in the plane of the sky. Thus, it is possible to quantify the amount of mechanical energy that has been injected by the jets into the ICM from the analysis of the X-ray cavities (Bîrzan et al., 2004; Rafferty et al., 2006). In other words, the X-ray cavities act as a calorimeter to estimate the mechanical power injected by the AGN in to the ICM without requiring radio observations of the central source.
Systematic analysis of the 95 ks Chandra data on Abell 2390 enabled us to detect a total of five X-ray cavities in the central 30″ region. Assuming that each cavity takes spheroidal or oblate sphere geometry with its minor axis in the plane of the sky and filled with the material of negligible mass (Randall et al., 2011), we estimate power of the cavities () as the ratio of the energy contained by the cavities to their ages. The amount of energy required to inflate a cavity with pressure and volume is its enthalpy and is defined as sum of the internal energy of the cavity and work done ( ) by the jet to displace the X-ray emitting gas while it inflates the radio lobes i.e.,
| (1) |
where is the mean adiabatic index of the fluid within the bubble and for the case of non-relativistic plasma it is 5/3. For non-relativistic content the total cavity energy is (McNamara & Nulsen, 2007).
The gas pressure of the surrounding ICM and volume V of the cavities were estimated directly from the analysis of the high resolution X-ray data (see Rafferty et al., 2006). Accuracy of the power estimation rely on the uncertainties in the measurement of volume of the X-ray cavities. As volume measurement is generally done by the visual inspection of the cavities in the X-ray image, therefore, is prone to systematic errors and is highly dependent on the quality of the X-ray data. The projection effect is also important in determining the spatial geometry of the cavities. As a result, volumes of the cavities measured by different observers may vary significantly due to their different approaches (Gitti et al., 2010) and hence may lead to the inaccurate estimation of the cavity power. To overcome these uncertainties, we estimate the cavity size from the surface brightness profile of the central region of the cluster. The extents of the cavities were measured from the decrements in the surface brightness profiles extracted from different sectors (Figure 1 right panel). The resulting profiles show dip at the location of the cavity. X-ray cavities are assumed to be prolate ellipsoids. Volume of each of the cavity was estimated as , where and are the projected semi-major axes along and perpendicular to the jet direction, respectively. Locations and distances of cavities were measured using the unsharp mask image. Our estimates of cavity volumes are 3.681069 cm3, 2.35 1069 cm3, 4.851069 cm3, 3.96 1069 cm3, and 4.831068 cm3, respectively, for the E, W, N, S and NW cavities. The temperature, density and pressure of the ICM surrounding the cavities () were taken from the projected radial profiles of the temperature and electron density computed above at the radial distances corresponding to the centre of the cavities. Table 4 summarizes the cavity properties and their derived energetics.
Then the rate at which energy is injected into the ICM by the central AGN was computed by dividing the cavity energy by the bubble age as
| (2) |
Here age of the cavity was estimated using the buoyancy rise method (Churazov et al., 2001). The buoyancy rise time is the time taken by the cavity to reach its terminal velocity, which depends on the drag forces. In the case of clearly detached cavities, the buoyancy rise method provides the better estimate of the cavity age and is given by
Here, R is the projected distance from the centre of the cavity to the X-ray centroid of the ICM, = is the cross-sectional area of the cavity, is the drag coefficient (Churazov et al., 2001), and is the local gravitational acceleration. Our estimates of the age of the cavities using the buoyancy rise method listed in Table 4 were used to quantify their power content. The net power supplied by the central AGN in the form of the mechanical energy is found to be equal to 5.94 erg s-1 and is lower than 1.0 erg s-1 reported by Russell et al. (2013) and Hlavacek-Larrondo et al. (2011). The total mechanical power content of the Abell 2390 is higher than that estimated in several other systems (e.g. NGC 6338, Abell 1991, IRAS 09104+4109, RBS 797, HCG 62, ZwCl 2701, Abell 262 etc.) and therefore is an important candidate for its detailed investigation. This estimate may even enhance by several factors if we include the power due to the cold fronts and other features apparent in this system (e.g. Fabian et al., 2003, 2006; Forman et al., 2005). Thus, the cavity power estimation using the X-ray analysis provides a lower limit to the true mechanical power of the AGN, i.e. the true jet power . Our estimate of the total mechanical power for all the five cavities and is roughly higher by a factor of 14 than the cooling luminosity within the cooling radius.


5.2 Comparison with the radio data
X-ray cavities in the ICM are thought to be inflated by radio jets originating from the AGN, that rise buoyantly until they reach density equilibrium with the surrounding ICM. Therefore, with an objective to examine association of the core of the Abell 2390 with a radio source, we make use of the 1.4 GHz VLA L-band radio data available in the NRAO Science Data Archive. The diffuse radio emission contours at 1.4 GHz from Abell 2390 from their analysis are overlaid on the 0.5-3 keV Chandra unsharp mask image (Figure 12). The radio emission morphology exhibits a complex nature that nearly match with the X-ray. The strongest radio source at the centre coincides with the cluster dominant cD galaxy PGC 140982, while the diffuse radio emission at 1.4 GHz is found to cover all the detected X-ray cavities. Though, its morphology is highly asymmetric. The radio emission also exhibits a sharp edge on the south-east direction, while another more complex edge on the north-west direction due to several discrete radio sources is evident in this figure (Bacchi et al., 2003). This complex edge in radio emission is found to coincide with the X-ray edge evident in the Chandra unsharp mask image (Figure 12). The extended 1.4 GHz diffuse radio emission along the north-west and the south-east directions exhibit its spatial association with the cool ICM evident in the temperature map (Figure 11 left panel). Association of the strong radio source with the cooling flow cluster Abell 2390 suggest that this cluster falls in the class of the radio mini-halo and is similar in size to that of the Perseus cluster (Burns et al., 1992). Non-spherical and more irregular morphology of diffuse radio emission from Abell 2390 is similar to that seen in the mini-halo of A2626 (Gitti et al., 2004). We also plot the radio emission contours at 4.8 GHz (blue) and 8.4 GHz (cyan) from the VLA data in the same figure. Emission at higher frequencies appears to be confined only to the central 20″ region.

5.3 ICM heating by the AGN feedback


Radiative cooling of the ICM can be estimated by measuring X-ray luminosity of the hot gas within cooling radius of a cluster. In the present case for Abell 2390 it is found to be equal to corresponding to the radius of 60.91 kpc and cooling time of 1.9 Gyr (Hlavacek-Larrondo et al., 2011). This means, in the absence of heating source, the cluster ICM would have radiated away all of its thermal energy over the time less than age of the cluster. However, estimate of the X-ray luminosity using deep X-ray data required some heating, e.g. AGN feedback, to make up for the power radiated from within this region in order to suppress cooling. This means, to balance the radiative cooling, the average energy input by the AGN outburst must be of the order or higher than the rate of radiative cooling. To examine efficiency of the AGN feedback, estimated mechanical power injected by the AGN from X-ray cavity analysis. was compared with that of the radiative loss ().
For the case of Abell 2390, we estimate the total X-ray cavity power of the central radio source to be 5.94 1045 erg s-1 and has cavity enthalpy inexcess with that of the radiated power within cooling radius () 4.04 1044 erg s-1 by almost an order of magnitude. To further elucidate this balance between the two, we make use of the Figure 6 by Rafferty et al. (2006), where they plot the AGN power against the total radiative luminosity of the ICM within cooling radius (Figure 13 left panel). The diagonal lines in this plot indicate their equivalence () at 1, 4 and 16 of total enthalpy (from top to bottom, respectively). Filled black symbols indicate data points for the cluster sample from Cavagnolo et al. (2010), while that indicated by filled square is for A1991 (Pandge et al., 2013). Error bars indicate the 1 uncertainties in the cavity power estimation. We also plot position of Abell 2390 in the same figure so as to check the balance between the two (filled triangle) and is found to occupy the position above the 1 line. This means, mechanical power fed by the central AGN associated with Abell 2390 is sufficiently large to inflate the cavities and to balance cooling of the ICM without requiring any additional contribution from the energy available with the relativistic particles and the magnetic field of the radio jets.
Bîrzan et al. (2012) demonstrate that every massive cooling flow cluster with X-ray cavities hosts a radio source at its core with a radio luminosity greater than 2.5 1030 erg s-1 Hz-1. Following this, we explored the availability of radio data on this system and found that Abell 2390 is associated with a radio source of flux 235.3 mJy at 1.4 GHz (Condon et al., 1998; Voigt & Fabian, 2004). The radio power of the central source associated with Abell 2390 was calculated using the relation (Cavagnolo et al., 2010)
| (3) |
where , , and represent the luminosity distance, flux density at frequency , redshift and the radio spectral index (assuming ), respectively. This lead to the radio power at 1.4 GHz equal to 5.01 1041 erg s-1. Thus, Abell 2390 meets the requirement of Bîrzan et al. (2012) and therefore increases the possibility of cavity heating of the ICM. We used this to confirm the balance between the two by plotting the mechanical power of cavities from X-ray study against the 1.4 GHz radio power of the central radio source as suggested by Cavagnolo et al. (2010) and is shown in Figure 13 (right panel). The long dashed red line in this figure represents the best fit relation obtained by Cavagnolo et al. (2010) for a sample of giant ellipticals (gEs) with upper and lower limits shown by the short dashed blue lines. In this plot Abell 2390 is found to occupy position much above the best-fit line obtained by Cavagnolo et al. (2010), implying that our estimate of mechanical power using the X-ray data requires a much powerful radio source to meet the balance. Our estimate of the cavity power ( 5.94 1045 erg s-1) matches within error with that ( 1.01.0 1046 erg s-1) reported by Russell et al. (2013). The measured values of radio flux densities at 1.4 GHz leads to the radio power equal to 5.01 1041 erg s-1 with a ratio of the two powers ( / ) equal to , which is lower compared to the theoretical range of - obtained by Bicknell et al. (1997) as well as the reported values by Cavagnolo et al. (2010) and O’Sullivan et al. (2011). This lower value is probably due to the uncertainties in the estimation of volume of the X-ray cavities. As volume measurement is carried out by the visual inspection of the cavities in the X-ray image, therefore, is prone to systematic errors. According to Bîrzan et al. (2008) volume estimation as well as radio emission is also less sensitive to projection effect. If we consider total radio power over the frequency range 10 MHz to 10 GHz ( 3.67 1042 erg s-1), this ratio turns out to be . Similar values of the ratio of the two power estimates have also been reported for few other cases e.g. NGC 4636 (Baldi et al., 2009), HCG 62 (Gitti et al., 2010) and few other sources (Bîrzan et al., 2008), where the mechanical power estimated from cavity analysis is found to exceed by about 4 orders of magnitude compared with the radio power. Gitti et al. (2010) for the case of HCG 62, where / , have demonstrated that the synchrotron radio luminosity can not be taken as a reliable gauge of the total mechanical power of the AGN outburst. This is because the radio sources may be very poor, time-variable radiators or may fade with time. Another possibility is that the radio source associated with Abell 2390 is sufficiently powerful, whose power compares with that of Cygnus A, however, the denser environment of the cluster does not allow us to envisage the symmetrically placed lobes on either sides of the nucleus.
Another convincing probe for the AGN heating was provided by the nature of the entropy profile in central region of Abell 2390. The radial entropy profile derived for Abell 2390 falls systematically in the radially inward direction with a floor at 12.202.54 keV cm2 in the core region. If the cooling of the ICM is not compensated by the AGN heating, it would have radiated away whole of its thermal energy on the Hubble timescale and hence entropy would have collapsed to a very low value. However, the flattening of the entropy index towards the central projected value of 12.202.54 keV cm2 strongly point towards an intermittent heating of the ICM by the strong AGN feedback (Soker et al., 2005).
Rawle et al. (2012) using the Spitzer and Herschel data estimate the star formation rate in the core of this system to be equal to 9 /yr. However, this estimate is significantly smaller than that expected by the standard cooling flow model, implying that the AGN is regulating it through the feedback process. They also found a strong correlation between the infrared luminosity and the cluster X-ray gas cooling time, suggesting that the star formation in this system is strongly influenced by the cluster-scale cooling process. Thus, all the attempts made here to relate the jet/cavity power with the X-ray/radio luminosity imply that the AGN outburst from the core of the Abell 2390 is capable enough to quench the cooling and also to carve the morphology of the ICM.
6 Conclusions
In this paper we have presented systematic analysis of 95 ks high resolution Chandra data on a cooling flow cluster Abell 2390 with an objective to investigate properties of the X-ray cavities apparent in the surface brightness distribution. 1.4 GHz VLA L-band data reveals an association of a strong radio source with the cD galaxy PGC 140982 at the core of this cluster. Comparison of the X-ray and radio data exhibit a strong interplay between the central radio source and the ICM, indicating that the cool core cluster Abel 2390 is an important source to investigate the AGN feedback. Main results from this study are summarized below:
-
•
Our morphological analysis using a total of 95 ks Chandra data confirms the presence of a pair of X-ray cavities predicated by Allen et al. (2001) and Vikhlinin et al. (2005). Additionally, this study has detected three more X-ray cavities in the central 30″ region. The presence of these cavities have been confirmed by a variety of image processing techniques i.e., unsharp mask image, 2D elliptical- model subtracted residual image as well as by the surface brightness profiles derived along four different sectors.
-
•
Projected radial temperature profile reveals a positive temperature gradient in the central region, like those seen in several other cooling flow clusters.
-
•
Temperature profiles derived along the four different wedge-shaped sectors revealed temperature jump in the all directions at a projected distance of 25″ and another jump from 7.47 keV to 9.10 keV in the west direction at a projected distance of 68″ (246 kpc). These jumps in temperature are due to the cold fronts and their corresponding Mach numbers are 1.440.05 and 1.220.06.
-
•
Tricolour map as well as hardness ratio map detects cool gas clumps in the central 30 kpc region of temperature keV. The cooler gas has a remarkable impact on the radial temperature profile of the cluster. After removing the contribution of the cool gas, Abell 2390’s temperature profile is consistent with the form observed in other cool core galaxy clusters.
-
•
The entropy profile derived from the X-ray analysis is found to fall systematically inward in a power-law fashion and exhibits a floor near 12.202.54 keV cm2 in the central region. This flattening of the entropy profile in the core region confirms the intermittent heating at the centre by AGN.
-
•
The diffuse radio emission map at 1.4 GHz using VLA L-band data exhibits highly asymmetric morphology with an edge in the north-west direction coinciding with the X-ray edge seen in the unsharp mask image.
-
•
The mechanical power injected by the AGN in the form of X-ray cavities is found to be 5.941045 erg s-1 and is roughly an order of magnitude higher than the energy lost by the ICM in the form of X-ray emission, confirming that AGN feedback is capable enough to quench the cooling flow in this cluster.
7 Acknowledgements
We thank the anonymous referee for useful comments and suggestions, that helped us to improve the quality of the manuscript greatly. SSS acknowledges financial support from the Ministry of Minority Affairs, Govt. of India, under the Minority Fellowship Program (award No. F-17.1/2010/MANF-BUD-MAH-2111/SA-III/Website). PKP acknowledges financial support from the CSIR, India. The authors gratefully acknowledge the use of computing and library facilities of the Inter-University Centre for Astronomy and Astrophysics (IUCAA), Pune, India and the High Performance Computing (HPC) facility procured under the DST, New Delhi’s FIST scheme (F No. SR/FST/PS-145/2009). This work has made use of data from the Chandra archive, NASA’s Astrophysics Database System (ADS), NASA/IPAC Extragalactic Database (NED), High Energy Astrophysics Science Archive Research Center (HEASARC). We thank Jeremy Sanders for his help on deriving the contour binned maps and usage of the Veusz package.
References
- Abraham et al. (1996) Abraham, R. G., Smecker-Hane, T. A., Hutchings, J. B., et al., 1996, ApJ, 471, 694
- Allen et al. (1998) Allen, S. W. & Fabian, A. C., 1998, MNRAS, 297, L63
- Allen et al. (2001) Allen, S. W., Ettori, S., & Fabian, A. C., 2001, MNRAS, 324, 877
- Arnaud et al. (1996) Arnaud, K. A., 1996, in Astronomical Society of the Pacific Conference Series, Vol. 101, Astronomical Data Analysis Software and Systems V, Jacoby, G. H. & Barnes, J., eds., p. 17
- Augusto et al. (2006) Augusto, P., Edge, A. C., & Chandler, C. J., 2006, MNRAS, 367, 366
- Bacchi et al. (2003) Bacchi, M., Feretti, L., Giovannini, G., & Govoni, F. 2003, A&A, 400, 465
- Baldi et al. (2007) Baldi A., Ettori S., Mazzotta P., Tozzi P., Borgani S., 2007, ApJ, 666, 835
- Baldi et al. (2009) Baldi A., Forman W., Jones C., Kraft R., Nulsen P., Churazov E., David L., Giacintucci S., 2009, ApJ, 707, 1034
- Bardeau et al. (2007) Bardeau, S., Soucail, G., Kneib, J.-P., Czoske, O., Ebeling, H., Hudelot, P., Smail, I., & Smith, G. P., 2007, A&A, 470, 449
- Bicknell et al. (1997) Bicknell, G. V., Dopita, M. A., & O’Dea, C. P. 1997, ApJ, 485, 112
- Bîrzan et al. (2004) Bîrzan, L., Rafferty, D.A., McNamara, B.R., Wise, M.W., Nulsen, P.E.J. 2004 , ApJ, 607, 800
- Bîrzan et al. (2008) Bîrzan, L., McNamara, B. R., Nulsen, P. E. J., Carilli, C. L., & Wise, M. W., 2008, ApJ, 686, 859
- Bîrzan et al. (2012) Bîrzan, L., Rafferty, D.A., Nulsen, P.E.J., McNamara, B.R., R¨ottgering, H.J.A., Wise,M.W., Mittal, R. 2012, MNRAS, 427, 3468
- Blanton et al. (2001) Blanton, E. L., Sarazin, C. L., McNamara, B. R., & Wise, M. W., 2001, ApJ, 558, L15
- Blanton et al. (2003) Blanton, E., Sarazin, C. & McNamara 2003, ApJ, 585, 227
- Blanton et al. (2004) Blanton, E. L., Sarazin, C. L., McNamara, B. R., & Clarke, T. E., 2004, ApJ, 612, 817
- Blanton et al. (2009) Blanton, E. L., Randall, S. W., Douglass, E. M., Sarazin, C. L., Clarke, T. E.,& McNamara, B. R. 2009, ApJ, 697, L95
- Blanton et al. (2011) Blanton E. L., Randall S. W., Clarke T. E., Sarazin C. L., McNamara B. R., Douglass E. M., McDonald M., 2011, ApJ, 737, 99
- Burns et al. (1992) Burns, J. O., Sulkanen, M. E., Gisler, G. R., & Perley, R. A. 1992, ApJ, 388, L49
- Canning et al. (2013) Canning, R. E. A., Sun, M., Sanders, J. S., et al., 2013, MNRAS, 435, 1108
- Cavagnolo et al. (2009) Cavagnolo, K. W., Donahue, M., Voit, G. M., & Sun, M. 2009, ApJS, 182, 12
- Cavagnolo et al. (2010) Cavagnolo, K.W., McNamara, B.R., Nulsen, P.E.J., Carilli, C.L., Jones, C., Bîrzan, L. 2010, ApJ,720,1066
- Churazov et al. (2001) Churazov E., Brüggen M., Kaiser C. R., Böhringer H., Forman W., 2001, ApJ, 554, 261
- Condon et al. (1998) Condon, J. J., Cotton, W. D., Greisen, E. W., Yin, Q. F., Perley, R. A., Taylor, G. B., & Broderick, J. J., 1998, AJ, 115, 1693
- David et al. (2009) David, L. P., Jones, C., Forman, W., Nulsen, P., Vrtilek, J., O’Sullivan, E., Giacintucci, S., & Raychaudhury, S., 2009, ApJ, 705, 624
- Dong et al. (2010) Dong, R., Rasmussen, J., & Mulchaey, J. S., 2010, ApJ, 712, 883
- Egami et al. (2006) Egami, E., Misselt, K. A., Rieke, G. H., et al., 2006, ApJ, 647, 922
- Fabian (2012) Fabian, A. C., 2012, ARA&A, 50, 455
- Fabian et al. (2003) Fabian, A. C., Sanders, J. S., Allen, S. W., Crawford, C. S., Iwasawa, K., Johnstone, R. M., Schmidt, R. W., & Taylor, G. B., 2003, MNRAS, 344, L43
- Fabian et al. (2006) Fabian, A.C., Sanders, J.S., Taylor, G.B., Allen, S.W., Crawford, C.S., Johnstone, R.M.,Iwasawa, K. 2006, MNRAS, 366, 417
- Forman et al. (2005) Forman, W., Nulsen, P., Heinz, S., et al., 2005, ApJ, 635, 894
- Gastaldello et al. (2007) Gastaldello, F., Buote, D. A., Humphrey, P. J., Zappacosta, L., Bullock, J. S., Brighenti, F., & Mathews,W. G., 2007, ApJ, 669, 158
- Giacintucci et al. (2011) Giacintucci, S., O’Sullivan, E., Vrtilek, J., et al., 2011, ApJ, 732, 95
- Gitti et al. (2004) Gitti, M., & Schindler, S. 2004, A&A, 427, L9
- Gitti et al. (2010) Gitti, M., O’Sullivan, E., Giacintucci, S., David, L. P., Vrtilek, J., Raychaudhury, S., & Nulsen, P. E. J., 2010, ApJ, 714, 758
- Gitti et al. (2011) Gitti, M., Nulsen, P. E. J., David, L. P., McNamara, B. R., & Wise, M. W. 2011, ApJ, 732, 13
- Gitti et al. (2012) Gitti, M., Brighenti, F., & McNamara, B.R. 2012, Adv. Astron., 2012, 1
- Haines et al. (2012) Haines, C. P., Pereira, M. J., Sanderson, A. J. R., et al., 2012, ApJ, 754, 97
- Hicks et al. (2006) Hicks, A. K., Ellingson, E., Hoekstra, H., & Yee, H. K. C., 2006, ApJ, 652, 232
- Hlavacek-Larrondo et al. (2011) Hlavacek-Larrondo, J. & Fabian, A. C., 2011, MNRAS, 413, 313
- Mazzotta et al. (2003) Mazzotta, P., Edge, A. C., & Markevitch, M., 2003, ApJ, 596, 190
- McNamara & Nulsen (2007) McNamara, B.R., Nulsen, P.E.J. 2007, ARA&A, 45, 117
- McNamara et al. (2005) McNamara, B. R., Nulsen, P. E. J., Wise, M. W., Rafferty, D. A., Carilli, C., Sarazin, C. L., & Blanton, E. L., 2005, Nature, 433, 45
- Nulsen et al. (2005) Nulsen P. E. J., McNamara B. R., Wise M. W., David L. P., 2005, ApJ, 628, 629
- O’Sullivan et al. (2011) O’Sullivan E., Giacintucci S., David L. P., Gitti M., Vrtilek J. M., Raychaudhury S., Ponman T. J., 2011, ApJ, 735, 11
- Pandge et al. (2012) Pandge, M.B., Vagshette, N.D., David, L.P., Patil, M.K. 2012, MNRAS, 421, 808
- Pandge et al. (2013) Pandge, M. B., Vagshette, N. D., Sonkamble, S. S., & Patil, M. K., 2013, Ap&SS, 345, 183
- Pipino et al. (2009) Pipino, A., Kaviraj, S., Bildfell, C., Babul, A., Hoekstra, H., & Silk, J., 2009, MNRAS, 395, 462
- Rafferty et al. (2006) Rafferty, D. A., McNamara, B. R., Nulsen, P. E. J., & Wise, M. W., 2006, ApJ, 652, 216
- Randall et al. (2011) Randall, S.W., Forman, W.R., Giacintucci, S., Nulsen, P.E.J., Sun, M., Jones, C., Churazov, E.,David, L.P., Kraft, R., Donahue, M., Blanton, E.L., Simionescu, A., Werner, N. 2011, ApJ, 726,86
- Rasmussen et al. (2007) Rasmussen, J. & Ponman, T. J., 2007, MNRAS, 380, 1554
- Rawle et al. (2012) Rawle, T. D., Edge, A. C., Egami, E., et al., 2012, ApJ, 747, 29
- Russell et al. (2013) Russell, H. R., McNamara, B. R., Edge, A. C., Hogan, M. T., Main, R. A., & Vantyghem, A. N., 2013, MNRAS, 432, 530
- Sanders et al. (2006) Sanders, J. S., 2006, MNRAS, 371, 829
- Sanders et al. (2001) Sanders, J. S. & Fabian, A. C., 2001, MNRAS, 325, 178
- Sharma et al. (2004) Sharma, M., McNamara, B.R., Nulsen, P.E.J., Owers, M., Wise, M.W., Blanton, E.L., Sarazin,C.L., Owen, F.N., David, L.P. 2004, ApJ, 613, 180
- Soker et al. (2005) Soker N., Pizzolato F., 2005, ApJ, 622, 847
- Sun et al. (2009) Sun, M., Voit, G. M., Donahue, M., Jones, C., Forman, W., & Vikhlinin, A., 2009, ApJ, 693, 1142
- Tremblay et al. (2012) Tremblay, G. R., O’Dea, C. P., Baum, S. A., et al., 2012, MNRAS, 424, 1026
- Vikhlinin et al. (2005) Vikhlinin, A., Markevitch, M., Murray, S. S., Jones, C., Forman,W., & Van Speybroeck, L., 2005, ApJ, 628, 655
- Vikhlinin et al. (2006) Vikhlinin, A., Kravtsov, A., Forman, W., Jones, C., Markevitch, M., Murray, S. S., & Van Speybroeck, L., 2006, ApJ, 640, 691
- Voigt & Fabian (2004) Voigt, L.M., Fabian, A.C. 2004, MNRAS, 347, 1130
- Wise et al. (2004) Wise, M. W., McNamara, B. R., & Murray, S. S. 2004, ApJ, 601, 184
- Yee et al. (1996) Yee, H. K. C., Ellingson, E., Abraham, R. G., Gravel, P., Carlberg, R. G., Smecker-Hane, T. A., Schade, D., & Rigler, M., 1996, ApJS, 102, 289