The Old, Super-Metal-Rich Open Cluster, NGC 6791 - Elemental Abundances in Turn-off Stars from Keck/HIRES Spectra
Abstract
The study of star clusters has advanced our understanding of stellar evolution, Galactic chemical evolution and nucleosynthesis. Here we investigate the composition of turn-off stars in the intriguing open cluster, NGC 6791, which is old, but super-metal-rich with high-resolution ( = 46,000) Keck/HIRES spectra. We find [Fe/H] = +0.30 0.02 from measurements of some 40 unblended, unsaturated lines of both Fe I and Fe II in eight turn-off stars. Our O abundances come from the O I triplet near 7774 Å and we perform a differential analysis relative to the Sun from our Lunar spectrum also obtained with Keck/HIRES. The O results are corrected for small nLTE effects. We find consistent ratios of [O/Fe]n with a mean of 0.06 0.02. This is low with respect to field stars that are also both old and metal-rich and continue the trend of decreasing [O/Fe] with increasing [Fe/H]. The small range in our oxygen abundances is consistent with a single population of stars. Our results for the alpha elements [Mg/Fe], [Si/Fe], [Ca/Fe], and [Ti/Fe] are near solar and compare well with those of the old, metal-rich field stars. The two Fe-peak elements, Cr and Ni, are consistent with Fe. These turn-off-star abundances provide benchmark abundances to investigate whether there are any observable abundance differences with the giants that might arise from nuclear-burning and dredge-up processes. Determinations of upper limits were found for Li by spectrum synthesis and are consistent with the upper limits in similar stars in the relatively old, super-metal-rich cluster NGC 6253. Our results support the prediction from standard theory that higher-metallicity stars deplete more Li. Probably no stars in NGC 6791 have retained their initial Li.
1 INTRODUCTION
The study of both open clusters and globular clusters have contributed to our understanding of the formation and chemical evolution of the Galaxy and the evolution of stars. The stars in open clusters are thought to have formed at the same time, within a few megayears, thus comparisons of clusters of different ages have revealed some details of the evolution of stars. Ages have been determined by the turn-off point from the main sequence with theoretical predictions from isochrones.
A given open cluster is formed from a giant molecular cloud thus they begin with the same composition and same space motion. Open clusters span the age of the Galaxy, but old open clusters are rare. Typical open clusters have some tens to hundreds of stars and as they move through the Galaxy, they tend to dissipate. Their former members become field stars. The oldest clusters survive only if they are massive and dense. Examples are NGC 188, NGC 6253, and NGC 6791.
Almost every field in astrophysics has benefited in some way from studies of star clusters. The study of both open clusters and globular clusters have especially contributed to our understanding of the formation and evolution of the Milky Way Galaxy, and of the evolution of stars. Since we can age-date clusters, we can learn about age-dependent phenomena. The distributions of stars in color–magnitude diagrams (CMDs) and the inferred cluster ages have confirmed many of the strictures of the standard stellar evolution theory, which, in turn, is used in the construction of galactic population synthesis and chemical evolution models. For example, stellar evolution theory explains why most stars are found on the main sequence and why they spend so much time there. Even long ago, it had been inferred from CMDs that stars evolve from the main sequence to become red giants, though how they did this was a mystery for a long time. That is, until stellar evolution theory provided the much anticipated understanding. One of the biggest triumphs of stellar evolution theory from relatively recent years is the prediction that most globular clusters are about 12–13 Gyr old, just younger than the Planck-inferred age of 13.8 Gyr of the universe (Ade et al. 2014). In spite of these and other numerous successes, standard theory, nevertheless, fails to explain the vast majority of observed surface stellar lithium (Li) abundances (Boesgaard & Tripicco 1986; Deliyannis et al. 1998; Deliyannis 2000). The standard theory does not include rotation, diffusion, mass loss, magnetic fields, etc. Additional (non-standard) physical mechanisms apparently operate inside stars. One of the goals of this study is to help elucidate this “lithium problem” (see Section 5.5).
The abundance of Fe has been determined in many clusters (e.g., Friel et al. 2002). Many open clusters have been studied for Li, beginning with Herbig (1965) and more recently by Cummings et al. (2012) and Francois et al. (2013. Abundances of many more elements in open clusters are important to develop a more thorough picture of Galactic chemical evolution. Studies of CNO, the alpha elements, Fe-peak elements, and n-capture elements are critical. For this kind of research, both high spectral-resolution and high signal-to-noise ratios (S/Ns) are needed. Some recent work on this includes Maderak et al. (2013), Boesgaard et al. (2013), Carrero & Pacino (2011).
An especially fascinating group of open clusters is the super-metal-rich trio NGC 6791, NGC 6253, and NGC 6583. Studying their abundance patterns can shed light on Galactic chemical evolution and potentially provide clues as to how the Galaxy produced such high abundances. These clusters also provide invaluable opportunities to study Li depletion in super-metal-rich stars, and to test theoretical predictions about the metallicity-dependence of Li depletion, e.g., Deliyannis et al. (1990), and the review by Pinsonneault (1997). In this study we focus on NGC 6791.
2 NGC 6791
NGC 6791 is a fascinating, unique cluster. For an open cluster it is very massive at 4000 (King et al. 2005). Its age is 8.3 Gyr with an uncertainty that is dominated by the uncertainty of the abundances of C, N, and O (Brogaard et al. 2012). The metallicity is at least twice that of the sun (e.g., Boesgaard et al. 2009). Its anomalies have lead to papers that speculate that it is the “Nucleus of a Tidally-Disrupted Galaxy?” (Carraro et al. 2006), that it has “Multiple Populations” and even whether it is an “Open Cluster” (Geisler et al. 2012), and that it has had “Extended Star Formation” (Twarog et al. 2011).
The metallicity has been found to be super-solar with [Fe/H] +0.4 from spectroscopic studies of giant stars. It is easier to observe the giant stars because they are relatively bright compared to main-sequence and turn-off stars. First, Peterson & Green (1998) found [Fe/H] = +0.4 from a bona fide horizontal branch star. Then, Worthey & Jowett (2003) found +0.32 from low resolution spectra ( 2200) of 23 K giants. Later, Gratton et al. (2006), Carraro et al. (2006) and Carretta et al. (2007) found values of [Fe/H] of +0.39 to +0.47 from spectroscopic studies at higher resolution. Origlia et al. (2006) found [Fe/H] = +0.35 in six M giants from IR spectra with a resolution of 25,000. Boesgaard et al. (2009) were able to determine abundances in two main-sequence turn-off stars from high-resolution Keck/HIRES spectra ( 45,000); they found [Fe/H] = +0.30 0.02.
The photometry of NGC 6791 is excellent (e.g., Montgomery et al. 1994, Stetson et al. 2003, and recalibrated photometry by Stetson reported in Brogaard et al. 2012). Ages from the H-R diagrams are 8-10 Gyr (Demarque et al. 1992, Garnavich et al. 1994, Montgomery et al. 1994, Chaboyer et al. 1999, Brogaard et al. 2012). With differential reddening and data from eclipsing binary stars, Brogaard et al. (2012) refine the CMD and apply isochrones to determine the age. They find that the age is not sensitive to the precise value of [Fe/H], but is sensitive to the uncertainty in [CNO/Fe]. Their best age estimate is 8.3 0.3 Gyr. With its old age and high metallicity, it does not conform to any age–metallicity relation for the Galactic disk.
The properties of NGC 6791 of super-high metallicity and old age are of tremendous value in testing predictions from standard stellar evolution theory (which does not include rotation, magnetic fields, diffusion, and mass loss) regarding Li depletion in stars, see Cummings et al. (2012). One important prediction is that cooler dwarfs should deplete more Li; this has been verified in a substantial number of open clusters. However, stars seem to deplete a greater amount of Li than predicted, and do so during the main-sequence phase of evolution (Jeffries & James 1999; Deliyannis 2000; Sestito & Randich 2005; Cummings et al. 2012). Various lines of evidence suggest the extra Li depletion is due to rotationally induced mixing. Some examples: 1) short-period tidally locked binaries, Deliyannis et al. (1994), Ryan & Deliyannis (1995); 2) the Li/Be and Be/B depletion correlations, Deliyannis et al. (1998), Boesgaard et al. (2004), Boesgaard et al. (2005); 3) stars evolving from the turnoff to the giant branch, Sills & Deliyannis (2000). Clearly there are other mechanisms can also play a role and must act in addition to the effects of standard mechanisms. Before we can effectively decipher the relative contributions of non-standard mechanisms, it is important to understand how well each of the standard predictions hold.
A key standard prediction is that dwarfs with higher metallicity should deplete more Li (e.g., Deliyannis et al. 1990, Pinsonneault 1997). Higher metallicity leads to higher opacity near the base of the surface convection zone (SCZ), which leads to a deeper SCZ, which then leads to more Li depletion. An additional prediction is that surface Li abundances should dilute as stars evolve along the subgiant branch and the SCZ deepens past the deepest point where Li has been preserved (Iben 1965, 1967). This prediction was investigated first by Herbig & Wolff (1966). It has been confirmed in halo stars (Deliyannis et al. 1990, Ryan & Deliyannis 1995), in globular cluster stars (Lind et al. 2009), and open cluster stars (Anthony-Twarog et al. 2013). Also, some open cluster subgiants have provided insights about the additional non-standard mechanisms operating inside of stars (e.g., M67, Sills & Deliyannis 2000).
NGC 6791 provides us with the unique opportunity to test some of these predictions in the super-high-metallicity, old-age regime. According to the combination of these predictions, the best Li-preservers in this cluster should be the bluest turnoff stars. Cooler dwarfs are predicted to have depleted more Li, and cooler evolving stars will have at least diluted their Li and possibly depleted it even more, as is the case with M67. Our goal was thus to see how much Li remains in the bluest turnoff stars, if any, and then to use any observed Li abundance pattern in further evolved stars to help interpret which Li depletion mechanisms might be at work.
NGC 6791 has a heliocentric distance of 4 kpc (King et al. 2005). It has a Galactic latitude of +11 which makes it 1 kpc above the Galactic plane. Most open clusters are near or in the Galactic plane. Bedin et al. (2006) found the absolute proper motion of the cluster. They determine orbital parameters and find that it has a boxy orbit with high eccentricity ( 0.5. Its perigalactic distance is about 3 kpc and its apogalactic distance is about 10 kpc. The orbital period is 130 Myr and it has crossed the Galactic plane several times. It has remained as an intact cluster due to its high mass and density. It may have originated in the inner regions of the Galaxy (Bedin et al. 2006). Chemical evolution models are able to produce [Fe/H] +0.30 for galactocentric distances of 4-5 kpc even at early ages. Following its formation in the inner part of the Milky Way, NGC 6791 may have been ejected into its current high eccentricity orbit by a massive feature, such as a bar (Jilkova et al. 2012).
NGC 6791 is in the Kepler-satellite field, thus Basu et al. (2011) have determined masses of evolved stars by asteroseismology. They find 1.20 0.01 for evolved stars. Eclipsing binary systems have been analyzed by Brogaard et al. (2012) who find 1.15 0.02 for stars on the lower part of the red giant branch (RGB).
For this research we have obtained high resolution ( = 46,000) spectra of several more turnoff stars in addition to the two studied by Boesgaard et al. (2009) with the upgraded HIRES (Vogt et al. 1994) on Keck-1. We report on abundances of Fe and O, the alpha-elements Mg, Si, Ca, and Ti, the Fe-peak elements Cr and Ni, and, as it turns out, upper limits on the abundances on Li.
3 OBSERVATIONS AND DATA REDUCTIONS
Even though stars near the main-sequence turn-off are faint (17.4), we chose to observe them rather than red giants in NGC 6791 for several reasons. (1) The spectral features, especially Fe I, are weaker than in the giants. (2) The lines are less blended and less saturated than in the super-metal-rich low-gravity giants that have strong lines and crowded spectra. (3) The temperatures are warmer and similar to the Sun’s temperature which makes comparisons to the solar abundances more consistent. (4) The atmospheres of the turn-off stars are far less extended so the 1D analysis provides a better approximation than it does in the giant stars. (5) We wanted to establish “baseline” abundances for comparison with abundances in the evolved stars, which may have dredged up products of nuclear processes to the surface. (6) We wanted to determine Li abundances as discussed in Section 2 above regarding the Li issues.
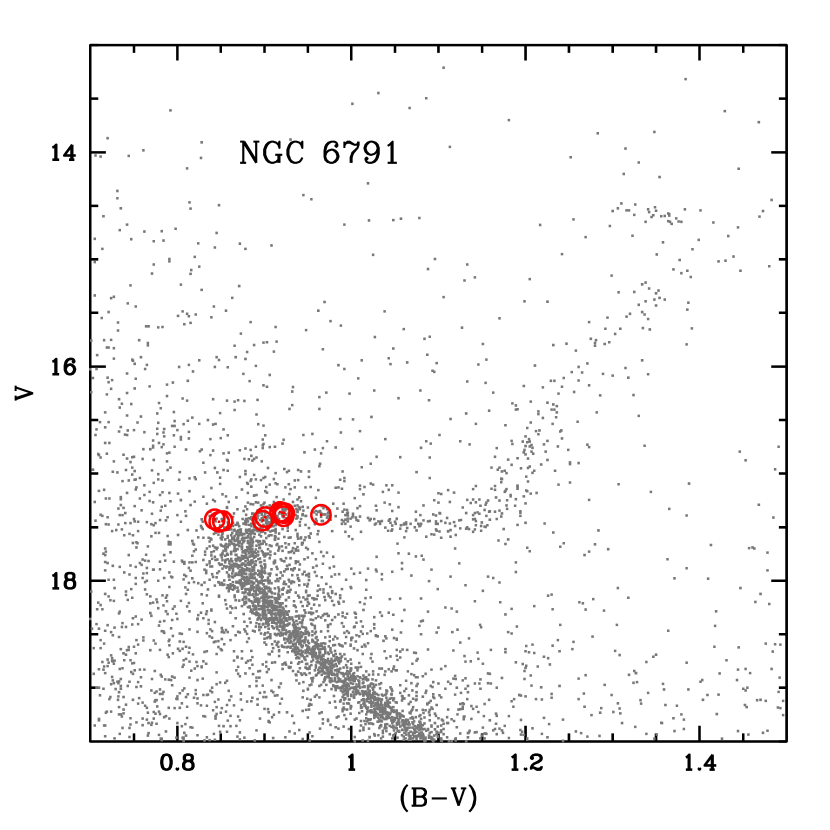
In order to determine abundances for turn-off stars in NGC 6791, high spectral resolution is advantageous; the super-solar metallicity means that many lines are blended and/or saturated. The turn-off stars have magnitudes near 17.4 which presents a challenge even for the Keck 10 m telescope and its upgraded HIRES spectrograph. Figure 1 shows the location of our sample in the CMD. They are all at or slightly evolved from the main-sequence turn-off. We will refer to them as turn-off stars to distinguish them from other observations that have been made of red giant stars. Our observations were made on eight nights over three observing seasons.
Our observing strategy was to take multiple integrations of these faint stars ( 17.4) and co-add them. Each integration had to be short enough to limit the number of cosmic-ray hits on the CCD, but long enough to get enough signal to be able to add the spectra together matching the right wavelengths in the line-crowded spectra. Typical integrations were a total of 180 minutes of 30 minute durations each. For four stars that was spread over two nights. We also tried to observe the NGC 6791 stars when they were near the meridian at low airmasses in order to get the best S/N per integration. The measured spectral resolution per pixel was 46,000. The typical S/N on individual integrations was 16–17 and the total combined S/N 40. The observing log is in Table 1. (Two of the 10 stars were obtained with the original version of HIRES, analyzed by Boesgaard et al. 2009 and are reanalyzed here.) The total S/Ns are per pixel and are determined from the co-added spectra before they were fitted by a continuum. They refer to the spectral region near 6700 Å and are typically 40.
On each of the four nights in 2008 and 2009 we took three spectra of Th-Ar arcs, nine bias frames, nine quartz flat-fields at 3 s and nine quartz flat-fields at 9 s. The two sets of flats were needed to get proper exposures for the three CCD chips. The 3 s exposures were appropriate for the red and green chips while 9 s exposures were needed for the blue chip, but were saturated on the red and green chips.
The data from 2008 and 2009 were reduced using the HIRedux pipeline of Prochaska111http://www.ucolick.org/xavier/HIRedux and various IRAF222IRAF is distributed by the National Optical Astronomy Observatory, which is operated by The Association of Universities for Research in Astronomy, Inc., under cooperative agreement with the National Science Foundation. routines. The pipeline was used to subtract the master bias from the nine bias frames and to normalize the spectra with our own images of the two master flat fields as well as spectrum extraction and wavelength justification. IRAF was used to co-add the multiple images and to fit the continuum.
4 STELLAR PARAMETERS
We have used new photometry and data reductions to derive from (). The and values are from Stetson et al. (2003) with a newer unpublished reduction by Stetson as reported in Brogaard et al. (2012). The overall reddening for NGC 6791 has been well-determined by Anthony-Twarog et al. (2007) who find = 0.155 0.016. Differential reddening seems to be present due to the fact that the spread in the sequences in the CMD exceeds the photometric errors and is correlated with position on the sky (Twarog et al. 2011; Platais et al. 2011; Brogaard et al. 2012). The amount of this differential reddening for NGC 6791 has been determined by Brogaard et al. (2012). (See Figure 2, in particular, in that paper.) They find values for the differential reddening along the line of sight to the cluster to be small, within 0.04. They do not directly determine overall reddening but adopt a best estimate of = 0.14 0.02; this is consistent with the reddening derived by Anthony-Twarog et al. (2007). Eight of our 10 stars have determinations of the differential reddening. We have used the calibrations of Casagrande et al. (2010) to determine temperatures; their calibration is valid for dwarfs and subgiants through the full range of metallicities, including super-metal rich stars. Our values of include the overall reddening of 0.155 from Anthony-Twarog et al. (2007) and differential reddening from Brogaard et al. (2012).
As part of our Fe abundance analysis, we can also find temperatures spectroscopically from the agreement of Fe lines with a range of excitation potentials. The mean difference between s determined from the colors and those from excitation potentials is 6 K 53 K. Thus the agreement between our photometrically based and the spectroscopic-based ones is superb. That standard deviation provides one way to estimate the uncertainty in .
We determined log from the basic relationship:
log /☉ = log ☉ + 4 log / +0.4 (bol bol)
For the solar values we used log ☉ = 4.438, = 5778 K and bol = 4.76. The distance modulus for NGC 6791 is 13.51 0.06 and the turn-off mass is 1.1 M☉ both from Brogaard et al. (2011). The bolometric magnitude was calculated using the Stetson -band photometry, adjusted for the distance modulus of Brogaard et al. plus corrections from Table 2 of Masana et al. (2006) for FGK stars. Individual corrections were obtained by interpolating between the [Fe/H] = 0.00 and [Fe/H] = +0.50 columns for our [Fe/H] = +0.30, and the photometrically determined of each star.
Values for the microturbulent velocity, , were found from the empirically determined relationship by Edvardsson et al. (1993) from 189 F and G disk dwarfs with dependencies on both and log . The colors and stellar parameters are given in Table 2. We made preliminary model atmospheres with those parameters and [Fe/H] = +0.35. We refined that value based on our measurements of Fe I and Fe II which gave [Fe/H] = 0.30 0.04 (see Section 5 for those details). We used model atmospheres of Kurucz (1993).
5 ABUNDANCES AND RESULTS
5.1 Iron
We measured the equivalent widths for Fe I and Fe II lines which were unblended and unsaturated. The lines are unsaturated when log 4.82. For the eight stars with observations with the upgraded version of HIRES we measured 37-46 Fe I lines and 5-8 Fe II lines; for the two stars from the earlier version of HIRES we measured 26 lines of Fe I and 6 of Fe II. Figure 2 shows two spectral regions of MJP 303 with three lines of Fe I in each region. The spectra have S/Ns of 40 and the Fe I lines are clear, unblended, and unsaturated. Due to severe line-crowding (and lower signal), we did not measure any Fe lines on the blue chip (4100–5240 Å). The wavelength interval we used for Fe I lines was 5560–7912 and for Fe II was 5534–7711 Å. The Fe I and Fe II lines and their excitation potentials and log values are given in Table 3. The Table also gives the measured equivalent widths for Fe I and Fe II lines in two of the stars: MJP 303 and MJP 2279.
We used the abfind driver in the updated version of MOOG333http://www.as.utexas.edu/ chris/moog.html (Sneden 1973) to determine abundances of both Fe I and Fe II. Table 4 shows the [FeI/H] results for each star from Fe with the errors from the agreement among the lines in the sample. The [FeI/H] agrees very well for 8 of the 10 stars, but the other two, MJP 5597 and MJP 6930, were significantly lower. As can be seen from Table 4 the [FeI/H] abundance for MJP 5597 is 0.05 0.11, or over 3 below the cluster mean and for MJP 6930 is 0.33 0.11 nearly 6 below the cluster mean. Those two stars appeared to be turn-off stars based on their location in the CMD and position within the cluster, but their [FeI/H] abundances are discrepant.
We also examined the radial velocities for the 10 stars in our sample. The cluster radial velocity was found to be 48 9 km s-1 by Friel et al. (1989). Bedin et al. (2006) found 47.1 0.7 km s-1. Recently, Gao & Chen (2012) have determined the cluster radial velocity from the 95 stars with high membership probabilities and found 46.4 0.2 km s-1. The radial velocities for those two stars were found 60 km s-1 for MJP 5597 and +5 km s-1 for MJP 6930. The radial velocities that we measured from our spectra of the other eight stars range from 45 to 53 with a mean of 47.6 2.8 km s-1 in agreement with the cluster mean. The two stars, MJP 5597 and MJP 6930, are considered non-members based on their radial velocities and their Fe abundances. We have excluded them from the rest of the analysis.
We determine the mean [Fe/H] for the eight member stars from both Fe I and Fe II. We found the stellar mean by weighing Fe abundance by the number of lines measured in each ionization stage. The stellar mean from Fe I is +0.30 0.04 and from Fe II is +0.30 0.05. The agreement between the Fe abundance from the two ionization states is excellent with a mean difference of 0.00 0.04. The final mean for eight stars is [Fe/H] = +0.30 with the standard deviation of the mean of 0.02.
Previously, abundances of Fe have been determined primarily from evolved stars due to their relative brightness. Peterson & Green (1998) analyzed the spectrum of one horizontal branch star at a resolution of 20,000 and found [Fe/H] = +0.4 0.1. Worthey & Jowett (2003) observed 24 giants, but at a resolution of only = 2200, and found [Fe/H] = +0.32 0.02. From higher-resolution spectra ( = 29,000) of four red giants Gratton et al. (2006) found [Fe/H] = +0.47 0.08 and Carretta et al. (2007) found [Fe/H] = +0.47 0.07 from the spectra of the same four giants. Carraro et al. (2006) analyzed 10 K giant stars at the top of the RGB with WIYN/Hydra spectra at 17,000 resolution and found [Fe/H] = +0.38 0.02. The infrared spectra of six M giants taken with NIRSPEC of Keck-2 at a resolution of = 25,000 were analyzed by Origlia et al.(2006) who found [Fe/H] = +0.35 0.02. More recently Geisler et al. (2012) derived [Fe/H] = +0.42 0.01 from an array of stars on the RGB (including some red clump stars) with spectra from WIYN/Hydra and Keck/HIRES. Gao & Chen (2012) found [Fe/H] = +0.32 0.11 from SDSS-DR8 spectra of 87 stars at = 2200 resolution. Boesgaard et al. (2009) obtained spectra with Keck/HIRES at 45,000 resolution of two turn-off stars and derived [Fe/H] = +0.30 0.01 from Fe I and Fe II lines.
We consider our value of [Fe/H] = +0.30 0.02 to be the best [Fe/H] abundance for NGC 6791 determined to date because it is based on unblended and unsaturated lines of both Fe I and Fe II in eight main-sequence turn-off stars observed at a resolution of = 46,000 and S/N of 40. The atmospheres of turn-off stars can be more directly compared to the sun than the extended atmospheres of the giant stars.
5.2 Oxygen
The O I triplet lines at 7774 Å were present on the red chip spectra of the stars taken with the upgraded HIRES, but not on the spectra with the settings we used on the earlier HIRES version. Another high excitation O I line occurs at 6158 Å, but that line was too weak to measure in any of the eight stars. We also tried to synthesize the [O I] line at 6300 Å but found it too weak to give reliable O abundances. Furthermore, with our grating settings that line is very close to the edge of the CCD chip where continuum fitting can be a problem.
In order to make a differential analysis with respect to the Sun, we used a 10 s exposure of the Moon that we had taken with Keck/HIRES in 2003 January 11 UT. The measured S/N in the region of the O I triplet is 350. Figure 3 shows an 11 Å segment of this spectral region of the solar/lunar spectrum and that of two of the stars in NGC 6791. We did a spectrum synthesis on the O I triplet lines, but found that a single O abundance does not fit the three lines. This is because the non-LTE corrections are different for each of the three lines. We measured the equivalent widths for the 3 lines in the lunar and stellar spectra and derived the LTE abundance for each line. We used log values from Wiese et al. (1996) of 0.369, 0.223, and 0.002 for the three lines, 7771.9, 7774.2, and 7775.4. For the Sun, we measured 62.8, 59.8, and 46.6 mÅ respectively, and derived an LTE abundance of log N(O) = 8.74 0.05 with the standard solar model of 5770 K, 4.44, 0.00, 1.0 km s-1. This is in good agreement with the solar O abundance derived by Ramirez et al. (2013) of 8.77 0.01.
Takeda (2003) has determined the nLTE corrections for each O I line for an array of temperatures, log g values, and Fe abundances. We applied the appropriate corrections for each line by interpolating between Takeda’s tables for our parameters. We note that our measured [Fe/H] of +0.30 is above the high end of Takeda’s metallicity at +0.25, thus we used that value. However he nLTE correction is not very sensitive to [Fe/H]. For Takeda’s sample of 300 stars the nLTE correction for [Fe/H] varies by less than 0.3 dex over the entire range of their sample’s metallicities from about 3.0 to about +0.5; this can be seen in Figure 8(b) of Takeda (2003). We then found a mean abundance for O from the three lines. The nLTE corrections make the LTE O abundances lower. We applied his nLTE corrections for the Sun and derived log N(O) = 8.65 0.07. This is in excellent agreement with the nLTE solar value derived by Ramirez et al. (2013) of log N(O) = 8.64 and by Asplund et al. (2009) of 8.69 0.05.
We show the results in Table 5. For each star, we give the equivalent width of the three lines in the O I triplet, the value for [O/H] for each line, the correction for the effects of nLTE as calculated from Takeda (2003), the value for the corrected O abundance as [O/H]n, and the final [O/Fe]n. (For MJP 1328, we could only reliably measure the line at 7774 Å and, for MJP 1346, we could not determine the strength of the line at 7775 Å.) The corrections to the LTE values of [O/Fe] range from 0.04 to 0.09 with a mean correction of 0.06 0.02. We give the mean and standard deviation of [O/Fe]n for each star (except MJP 1328 with only one line measurable). Our values are somewhat below solar with a mean of [O/Fe]n = 0.06 0.02.
The results from the individual O I lines are shown graphically in Figure 4. This shows that no one line is systematically lower/higher than the others in the six stars and that no one star is deviant. Also plotted are the standard deviations in [O/Fe]n and the standard deviation of the mean for each of the three O I lines in each star.
In Figure 5 we show a comparison of our [O/Fe]n versus[Fe/H] with results for field stars. The main field star sample is from Ramirez et al. (2013), selected to have [Fe/H] greater than 0.0 and ages older than 7.7 Gyr. Those 34 stars are from their total sample of 835 nearby FGK stars. These comparison stars and their abundances are given in Table 6. They also determined O abundances from the O I triplet and applied nLTE corrections to each line. Also shown in the figure are the [O/Fe] and [Fe/H] from the sample of old, metal-rich stars of Chen et al. (2003). These field stars are between 8–10 Gyr and have [Fe/H] values 0.00. Although Chen et al. did not correct for nLTE effects, they did do a differential analysis with respect to the Sun. As we have shown above, those corrections are small, about 0.06 dex.
It can be seen in this figure that our [O/Fe]n values in the turn-off stars in NGC 6791 are generally below the majority of the counterpart field stars. It also indicates that NGC 6791 turn-off stars fit the pattern of decreasing [O/Fe] with increasing [Fe/H], similar to the results of Chen et al. (2003). Both Figures 4 and 5 show that there is no sign of an intrinsic spread in [O/Fe]n in our six turn-off stars, which is consistent with a single population.
The Galactic trend of [O/Fe] with [Fe/H] is high at low metallicities: [O/Fe] +1.0 at [Fe/H] of 3.5 and then declines to near zero at [Fe/H] = 0.0 (e.g., Boesgaard et al. 2011). The results in Figure 5 appear to continue that trend to higher values of [Fe/H]. It is thought that O is formed via massive stars and SN II, which are dominant in the early days of the Galaxy, and those stars have low Fe/H. The Fe is formed primarily in intermediate mass stars and SN Ia. Jilkova et al. (2012) suggest that NGC 6791 could have originated in the central region of the Galactic disk where there would be more rapid metal-enrichment subsequently migrated out to its current orbit.
Gratton et al. (2006) analyzed four red clump stars in NGC 6791 with V magnitudes of 14.6. Their spectral resolution was = 29,000 and S/N 60. They were able to use the [O I] line at 6300, which is much stronger in giant stars than in dwarf or turn-off stars. They found [Fe/H] = +0.47 and [O/Fe] = 0.32. Carretta et al. (2007) analyzed the same four giants and found [O/Fe] = 0.31 0.08, with the mean [Fe/H] at +0.47.
Abundances of O were also found by Geisler et al. (2012) from spectrum synthesis of the [O I] line. They found a range in [O/Fe] from 0.10 to +0.25 in their red giant stars. Origlia et al. (2006) used the IR features of OH near 1.6 m from spectra of six M giants taken at a spectral resolution of 25,000 with NIRSPEC on the Keck-2 telescope to find [O/H]; with their values of [Fe/H] = +0.35 0.02 they find [O/Fe] = 0.07 0.03. These two [O/Fe] results seem to be in conflict with the results of Gratton et al. (2006) and Carretta et al. (2007) for giant stars.
Geisler et al. (2012) found evidence for two stellar populations in NGC 6791 based on eight stars with low [Na/Fe] (mean = 0.15) and 13 with high [Na/Fe] (mean = +0.38). All of the five stars they measured at the base of the RGB are in the low-Na group. In the low-Na stars the range in [O/Fe] is from 0.10 to +0.06. The high-Na group has a spread in [O/Fe] of 0.10 to +0.25; the two groups are distinct in [Na/Fe] but there is overlap in [O/Fe]. Their range in [O/Fe] covers +0.35 dex.
The question of multiple populations in NGC 6791 has recently been examined by Bragaglia et al. (2014). They found no clear anti-correlation between Na and O. They used our spectra and accepted the automatic data reduction done by the archivists. (See our description of our data collection strategy and our reduction in Section 3, especially our use of the two different master flat fields of 3 s and 9 s as appropriate for the three CCDs of HIRES.) They tried to synthesize the [O I] line at 6300 Å to find the O abundance. At the beginning of this section we argue against using that line due to its weakness in turn-off stars and the fact that it is too close to the edge of the CCD to be reliable. A firm knowledge of the strength of the CN blends in the region of the [O I] lines is also necessary. They determined O from [O I] in four of our stars for which we have O from the O I triplet. The four stars are MJP 303, 885, 1328 and 2279 with corresponding SBG numbers 15592, 14416, 13334, 11220. Our values for [O/Fe]n are 0.10, 0.10, 0.00, and 0.07, respectively for an average of 0.068 0.027. Their values show a wide range with [O/Fe] values of 0.05, 0.26, 0.08 and +0.08, respectively averaging 0.078 0.082.
For those four stars our [O/Fe] from the O I triplet has a range of 0.10 dex while theirs, from [O I] has a range of 0.34 dex. There are seven red giant stars in their sample for which they find O abundances from HIRES spectra using [O I]. The values for [O/Fe] in those seven stars range from +0.10 to 0.26 with a mean of 0.11 0.11.
Recently Cunha et al. (2015) report on O and Na abundances in giants in NGC 6791 from the IR spectra of 11 red giants and red clump stars determined from the vibration-rotation features of OH. This requires knowledge of the C and N abundances as well. They find Na abundances from two lines of Na I in the band. They do not find the Na-O anticorrelation found by Geisler et al. (2012) and find a solar ratio for [O/Fe].
5.3 Alpha-Elements
We measured the equivalent widths of 7-9 Si I lines, 7-9 Ca I lines and 6-8 Ti I lines in all eight stars. For Mg I there were only 2-3 lines for the stars observed with the upgraded HIRES and none on the spectra of the other two stars. (The Mg I lines at 6965 and 7387 were too far to the red to be covered with the settings we used and the line at 6318 fell in a gap between the echelle orders.) The cluster mean values are [Mg/Fe] = +0.08 0.04, [Si/Fe] = +0.07 0.02, [Ca/Fe] = 0.13 0.04, and [Ti/Fe] = 0.04 0.03. The detailed information is given in Table 8 along with the results for [Fe/H] and [O/Fe]n. In that table we give the sample standard deviation, , and the standard deviation of the mean, μ.
Figure 6 shows a plot of each of the four alpha-elements relative to Fe in each star as compared to the old and metal-rich field stars. The comparison samples are from: (1) Chen et al. (2003) who studied nine old, metal-rich stars in the solar neighborhood, (2) Edvardsson et al. (1993), who analyzed 189 F and G dwarfs from which we culled six that are old and metal-rich, (3) Feltzing & Gonzalez (2001) who studied eight super-metal-rich stars of which four are older than 8 Gyr, and (4) Reddy et al. (2006), who determined abundances of 22 elements in 176 nearby F and G stars from which we found six that had ages 7.7 Gyr and [Fe/H] 0.00 as determined by Ramirez et al. (2012). The comparison stars and abundances are given in Table 7. There is considerable spread in the field star values. In both the cluster and field star samples, the ratios of [Mg/Fe] and [Si/Fe] are enhanced at +0.05, while [Ti/Fe] is approximately solar in the mean. Two of our eight stars, 885 and 1783, seem low in [Ca/Fe], while the others match the field star distribution at solar and somewhat below solar. The two stars are lower than the mean of all eight stars by 1 sigma and lower than the mean of the other six stars by 2 sigma.
The abundances of some of the alpha-elements in giant stars in NGC 6791 have been determined by Carraro et al. (2006) and Carretta et al. (2007). The results for [Si/Fe], [Ca/Fe], and [Ti/Fe] in the 10 giants of Carraro et al. is in agreement with those in our eight turn-off stars within the errors (see Table 9). Four red clump giants were analyzed by Carretta et al. for all four alpha elements. Those results are in agreement with ours and they also find a low value for [Ca/Fe] of 0.15 0.08. Origlia et al. (2006) find the alpha-element abundances relative to their value of [Fe/H] of +0.35 0.02 to be near solar. We conclude that there are no observable differences in the alpha-elements between the turn-off and the giant stars that are due to the effects of nuclear burning followed by dredge-up in the giants.
5.4 Fe-Peak Elements
We were able to measure 5-6 lines of Cr I. They were unsaturated lines in all eight stars. For Ni I we could measure between 11 and 16 lines, all of which were unsaturated. (The four lines longward of 7000 Å were unavailable on MJP 4112 and 5061.) The values found for [Cr/Fe] and [Ni/Fe] are given in Table 8. It can be seen that both Fe-peak elements are similar to Fe in our turn-off stars.
We have compared our values of [Cr/Fe] and [Ni/Fe] with samples of field stars that are old and metal-rich. This can be seen in Figure 7. This comparison hints that the NGC 6791 stars might possibly be slightly enriched in Cr and Ni with the mean for [Cr/Fe] = +0.05 0.02 and [Ni/Fe] = +0.04 0.01. Our value for [Ni/Fe] is not significantly different from that found in the giant stars as given in Table 9.
5.5 Lithium
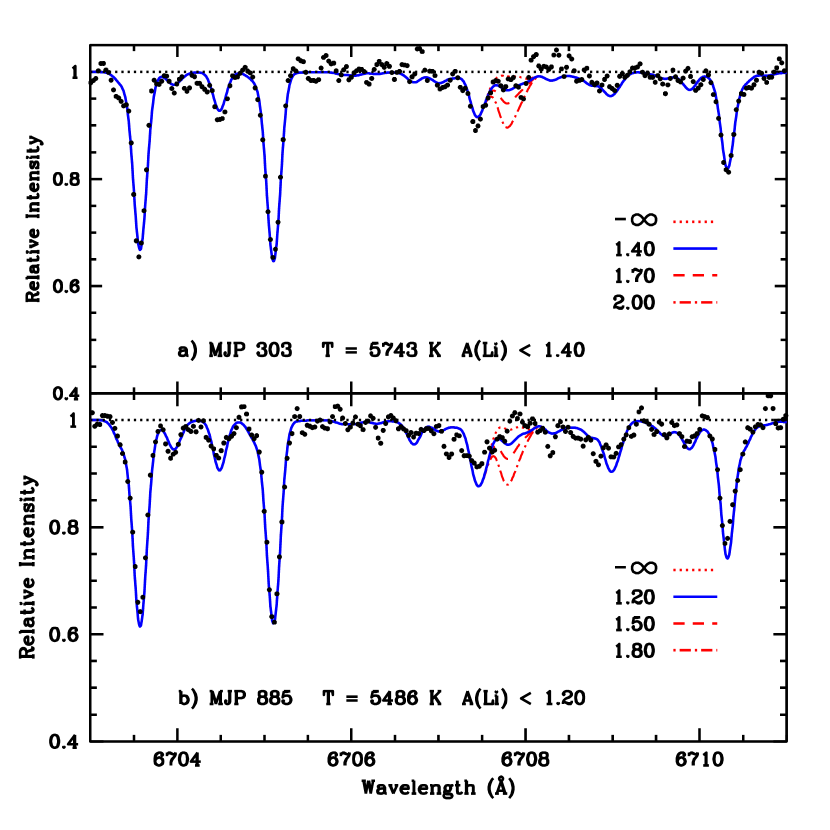
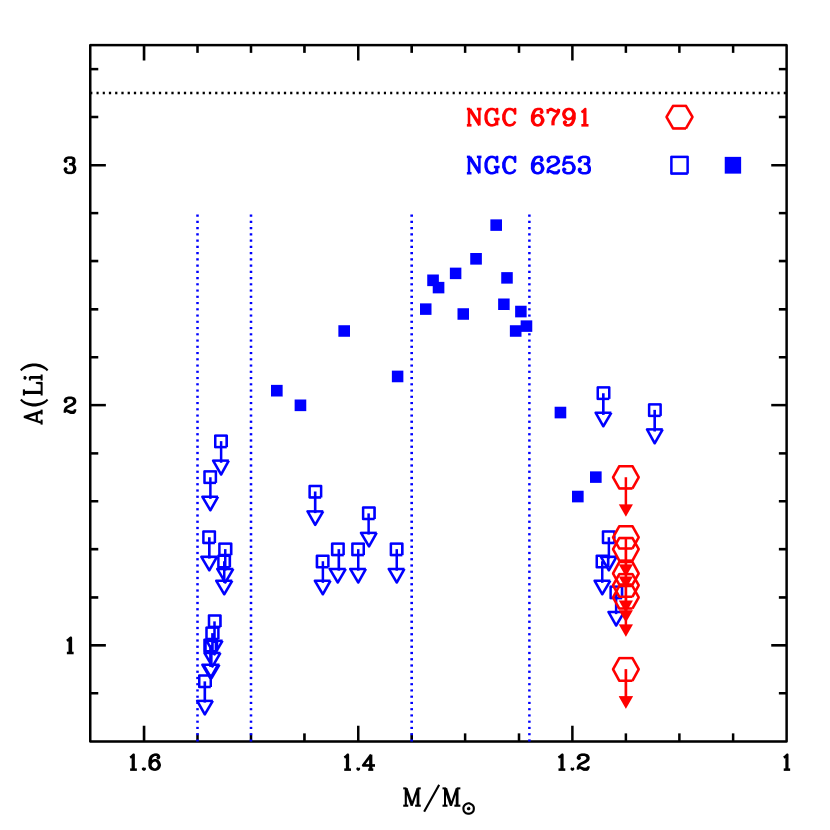
We used the synth driver in MOOG to determine Li abundances by spectrum synthesis. Examples of the synthesized spectra are shown in Figure 8. There were no detections of Li in any of these rather cool turn-off stars. The upper limits are given in Table 8. Their position in the Li-temperature plane is shown in Figure 9. These are compared with the Li detections and upper limits in turn-off stars in NGC 6253, also a rather old, super-metal-rich cluster. The Li abundances are given as A(Li) = log N(Li)/N(H) + 12.00.
For our comparison cluster, NGC 6253, Bragaglia et al. (1997) found an age of 3 Gyr; Piatti et al. (1998) determined an age of 5 1.5 Gyr; Sagar et al. (2001) obtained an age of 2.5 0.6 Gyr. Using isochrones with alpha-element enhancements, Twarog et al. (2003) found an age of 3 0.5 Gyr as did Anthony-Twarog et al. (2010). This cluster is less than half the age of NGC 6791. However, it may be even more metal-rich. Carretta et al. (2007) found [Fe/H] = +0.46 0.03 from four red clump giants while Sestito et al. (2007) derived +0.36 0.07. The Fe abundance from 38 turnoff members was found to be [Fe/H] = +0.43 0.01 by Anthony-Twarog et al. (2010) from Hydra spectra at the WIYN telescope; they also analyzed 18 giant stars and found [Fe/H] = +0.46. NGC 6253 and NGC 6791 are two clusters with reliable [Fe/H] determinations in the range +0.3 - +0.5 that have been studied for Li. Thus NGC 6253 makes a good comparison cluster for NGC 6791. Abundances and upper limits of Li were determined by Cummings et al. (2012). There is a third cluster that is super-metal-rich: NGC 6583. Unlike NGC 6253 and 6791, whose super-metal-richness is evidenced by multiple studies, only two stars in a single study suggest that NGC 6583 is super-metal-rich (Magrini et al. 2010); furthermore, no Li abundances have yet been reported for this cluster. However, if its status as a super-metal-rich cluster becomes more robust from additional studies, its younger age of 1 Gyr (Carraro et al. 2005) would make it a very interesting target for Li studies.
Figure 10 shows that the Li abundances and upper limits show similar patterns in the two old, metal-rich clusters. Both clusters show Li upper limits in the range 5800–5400 K, with values of A(Li) are 1–1.5 that are well below the presumed initial values of A(Li) 3 and the detections seen in hotter subgiants of NGC 6253. In NGC 6791, stars hotter than 5800 K evolved off the main sequence long ago, and, unfortunately, there is no longer any record of what kind of Li abundances such stars may have contained. It should be noted that NGC 6253’s younger stars in the range 5800–5400 K have masses near 1.55 ☉ (Figure 5 of Cummings et al. 2012), whereas the stars in NGC 6791 have lower masses near 1.15 (Brogaard et al. (2012). Thus, although both sets of stars show similar upper limits today, they originate from different regions of the main sequence A(Li) versus (or A(Li) versus mass) diagram, and may have experienced different Li depletion histories during the main sequence.
We can compare the Li in these two clusters as a function of stellar mass, as was done by Cummings et al. (2012) in their Figures 4(a) to 8(a). This is shown for NGC 6791 and NGC 6253 in Figure 10. The features shown for NGC 6253 have been attributed by Cummings et al. to the following. (1) Stars with of 1.5 to 1.55 are evolving from the cool side of the Li-dip found in main-sequence stars. They are the most evolved stars, and show no detectable Li. (2) Stars with masses between 1.35 and 1.5 are still on the main sequence and show a bimodal Li distribution. (3) A ”Li plateau” (Deliyannis 2000) is found in main-sequence stars cooler than the Li dip itself, yet warmer than the onset of Li depletion in G dwarfs that increases with decreasing mass. These stars have been able to preserve the most Li. (4) Stars with masses less than 1.2 show the effects of main-sequence depletion with the lowest mass stars having the greatest depletion.
The stars in that mass range (1.2 ) in the older cluster, NGC 6791, have evolved off the main sequence. These stars depleted their Li during main-sequence phase while they were G-dwarfs and, therefore, we can only determine upper limits on A(Li). That G-dwarf Li-decline has been observed in many open clusters, e.g. Cayrel et al. (1984) in the Hyades. We use the mass for these stars as determined by Brogaard et al. (2012) at 1.15 . (We have found that same mass with the Yale–Yonsei isochrones assuming [Fe/H] = +0.30, [alpha/Fe] = 0.0, and the turnoff of 5750 K to be consistent with the mass determinations of Cummings et al. (2012).) Our NGC 6791 stars have only recently evolved off the main sequence and they are similar to the Li-mass trend of NGC 6253.
Both the age and the metallicity of a cluster are known to affect the amount of Li depletion in main-sequence stars (e.g. Herbig 1965, Balachandran 1995). The older the cluster, the longer the time it has had to undergo the “slow-mixing” that depletes Li. The more metal-rich the cluster is, the more Li depletion it will have undergone according to theory (Deliyannis et al. 1990; Pinsonneault 1997). Both of these influences seem to have been working on NGC 6791 at 8.3 Gyr and [Fe/H] = +0.30. Figure 5(a) of Cummings et al. (2012) also shows stars of the solar-metallicity cluster M67, and it is quite clear that our upper limits of NGC 6791 are well below the A(Li) 2.6 exhibited by M = 1.15 dwarfs in M67, consistent with the predictions of standard theory. However, M67 is only half as old as NGC 6791, so perhaps the extra Li depletion in NGC 6791 is due to its older age. On the other hand, M67 and NGC 6253 have similar ages, but the more metal-rich NGC 6253 does have less Li than M67 at 1.15 . We can bring to bear the values of A(Li) found in NGC 188 which is of roughly solar-metallicity and with an age of 7-8 Gyr. There are some Li detections at the turnoff for NGC 188 (Hobbs & Pilachowski 1988; Randich et al. 2003). These turnoff stars in NGC 188 have = 5900–5750 K, comparable to that of NGC 6791, but of slightly lower masses of M = 1.0-1.1 , due to NGC 188’s lower metallicity. Regardless, the NGC 188 turnoff stars have A(Li) = 2.0–2.6, which is clearly higher than our upper limits in NGC 6791, once again consistent with the general expectations from standard theory that higher metallicity stars have greater Li depletion.
We speculate on the spectacular possibility that NGC 6791 might be the only star cluster in which not even one star has been able to preserve its initial lithium content. Dwarf stars in NGC 6791 would be even cooler than the warmest stars in our sample, originating from the even further Li-depleted region of the steep Li-mass trend, and thus have undetectable Li. Plus, more evolved subgiants and giants would have experienced additional Li depletion due to dilution and mixing past the RGB clump, as seen in other clusters. Any future detection of Li in NGC 6791 would thus be both surprising and interesting. To have no surviving Li in any member star of a cluster seems to require both very high metallicity and very old age, and may thus be seen again in the future if, in the possibly unlikely event, other very old super-metal-rich clusters are discovered.
5.6 Error Estimates
The values given for in Table 4 represent the standard deviation of each Fe I or Fe II line from the mean [FeI/H] or [FeII/H] for each star. We have made determinations of the errors due to uncertainties in the stellar parameters. Our models change one parameter at a time with the following uncertainties: 75 K in , 0.20 in log , 0.10 in [Fe/H], and 0.20 km s-1 in the microturbulent velocity. These are given for two representative stars in Table 10. The two stars, MJP 303 and MJP 885, encompass the range in parameters. (The one cooler star with lower log is MJP 5061 for which our data come from the earlier version of HIRES and do not include the full range in wavelength, nor do we have abundances of O or Mg in this star.)
There is almost no dependence of the final abundances on the value of [Fe/H]. Only Fe II and O I have much dependence on log . The increase in of 75 K leads to a decrease in abundance for all but Fe II and O I of a few hundredths of a dex. The increase of +0.20 km s-1 increases all of the elemental abundances by +0.02 to +0.07. The square root of the sum of the squares of the individual errors is given in the final column. Inasmuch as the errors are not independent of each other, the number given as the total error is an overestimate.
6 SUMMARY AND CONCLUSIONS
We have made high-resolution observations with the Keck 10 m telescope and HIRES of turn-off stars in the old, metal-rich open cluster, NGC 6791, to determine abundances of several elements. We have selected spectral features that were unblended even though there is much line crowding in the metal-rich stars. Our S/N values of 40 and the resolution of = 46,000 helped to insure clean features. All of the lines we measured were longward of 5500 Å.
The spectra of our stars at the main-sequence turn-off have far less blending than those of the giants that have been used in previous determinations of Fe abundance. We derived Fe abundances from both Fe I and Fe II using only unsaturated and unblended lines. There were 26-42 lines of Fe I and 5-8 lines of Fe II in eight turn-off stars. Both Fe I and Fe II gave the same Fe abundance, [Fe/H] = +0.30 0.02. The quality of the spectra, the observations made of turn-off stars, the number of stars observed, the use of a large number of unblended and unsaturated Fe I and II lines combine to make this the best determination of [Fe/H] in NGC 6791 to date.
To find the abundance of O we have used the O I triplet at 7774 Å. We have used our spectrum of the Moon from Keck/HIRES as a surrogate for the Sun to determine the solar O abundance, both in LTE and in nLTE. Those respective values are 8.74 and 8.65. Then we found [O/H], [O/Fe], and [O/H]n and [O/Fe]n for six turn-off stars. The nLTE value for [O/Fe]n is 0.06 0.02. This value, slightly lower than solar, makes NGC 6791 fit well with the trend of decreasing O with increasing Fe.
We have compared our results for the alpha elements, Mg, Si, Ca, and Ti, with those in a sample of old and metal-rich field stars and found that they are all near solar, within 0.1 dex in contrast to our O results. The Fe-peak elements are also near solar with [Cr/Fe] = +0.05 0.02 and [Ni/Fe] = 0.04 0.01. We compared our results for seven elements with two analyses of giant stars and found no evidence of dredged-up products of nuclear fusion in the giants. Our abundances of these seven elements provide benchmark abundances for this cluster.
None of the turn-off stars showed a Li I line thus we could determine only upper limits on A(Li); they were between 0.9 to . We have compared our Li results with those of NGC 6253, another relatively old, super-metal-rich cluster as a function of both and stellar mass. We have demonstrated that both old age and high metallicity contribute to the Li depletion in the 1.15 turn-off stars. It is probable that all of the stars in NGC 6791 have lost whatever Li they had initially.
References
- (1)
- (2) Ade, P. A. R., Aghanim, N., Armitage-Caplan, C. et al. 2014, A&A, 571, A16
- (3)
- (4) Anthony-Twarog, B., Deliyannis, C.P., Twarog, B., Cummings, J.D. & Maderak, R.M. 2010, AJ, 139, 2034
- (5)
- (6) Anthony-Twarog, B. J., Deliyannis, C. P., Rich, E., & Twarog, B. 2013, ApJ, 767, L19
- (7)
- (8) Anthony-Twarog, B., Twarog, B. & Mayer, L. 2007, AJ, 133, 1585
- (9)
- (10) Asplund, M., Grevesse, N., Sauval, A.J., Scott, P. 2009 ARA&A, 47, 481
- (11)
- (12) Balachandran, S. 1995, ApJ, 446, 203
- (13)
- (14) Basu, S., Grundahl, F., Stella, D. et al. 2011, ApJ, 720, L10
- (15)
- (16) Bedin, L.R., Piotto, G., Carraro, G., King, I.R. & Anderson, J. 2006 A&A, 460, L27
- (17)
- (18) Boesgaard, A. M., Armengaud, E., King, J. R., Deliyannis, C. P., & Stephens, A. 2004, ApJ, 613, 1202
- (19)
- (20) Boesgaard, A.M., Deliyannis, C.P., & Steinhauer, A. 2005, ApJ, 621, 991
- (21)
- (22) Boesgaard, A.M., Jensen, E.C., & Deliyannis, C.P. 2009, ApJ. 633, 398
- (23)
- (24) Boesgaard, A.M., Rich, J.A., Levesque, E.M., & Bowler, B.P. 2011 ApJ, 743, 140
- (25)
- (26) Boesgaard, A.M., Roper, B.W., & Lum, M.G. 2013, ApJ, 775, 58
- (27)
- (28) Boesgaard, A. M., & Tripicco, M. J. 1986, ApJ, 302, L49
- (29)
- (30) Bragaglia, A., Sneden, C., Carretta, E., et al. 2014, ApJ, 796, 68
- (31)
- (32) Bragaglia, A., Tessecini, G., Tosi, M., Marconi, G., & Munari, U. 1997, MNRAS, 284, 477
- (33)
- (34) Brogaard, K., Bruntt, H., Grundahl, F. et al. 2011, A&A, 525, A2
- (35)
- (36) Brogaard, K., VandenBerg, D.A., Bruntt, H. et al. 2012, A&A, 543, A106
- (37)
- (38) Carraro, G., Mendez, R.A. & Costa, E. 2005, MNRAS, 356, 647
- (39)
- (40) Carraro, G., Villanova, S., Demarque, P., McSwain, M.V. Piotto, G. & Bedin, L.R 2006, ApJ, 643, 1151
- (41)
- (42) Carrera, R. & Pancino, E. 2011, A&A, 535, A30
- (43)
- (44) Carretta, E., Bragaglia, A., & Gratton, R.G. 2007, A&A, 473, 129
- (45)
- (46) Casagrande, L., Ram rez, I., Mel ndez, J., Bessell, M. & Asplund, M. 2010 A&A, 512, 54
- (47)
- (48) Cayrel, R., Cayrel de Strobel, G., Campbell, B., & Dappen, W. 1984, ApJ, 283, 205
- (49)
- (50) Chaboyer, B., Green, E. M., & Liebert, J. 1999, AJ, 117, 1360
- (51)
- (52) Chen, Y.Q., Zhao, G., Nissen, P.E., Bai, G. & Qui, H.M. 2003, ApJ, 591, 925
- (53)
- (54) Cummings, J.D, Deliyannis, C.P., Anthony-Twarog, B., Twarog, B, & Maderak, R.M. 2012, AJ, 144, 137
- (55)
- (56) Cunha, K., Smith, V.V., Johnson, J.A. et al. 2015, ApJ, 798, L41
- (57)
- (58) Deliyannis, C. P. 2000, in ASP Conf. Ser. 198, Stellar Clusters and Associations: Convection, Rotation, and Dynamos, ed. R. Pallavicini, G. Micela, & S. Sciortino (San Francisco, CA:ASP), 235
- (59)
- (60) Deliyannis, C. P., Boesgaard, A. M., Stephens, A., et al. 1998, ApJ, 498, L147
- (61)
- (62) Deliyannis, C. P., Demarque, P., & Kawaler, S.D., 1990, ApJS, 23, 21
- (63)
- (64) Deliyannis, C. P., King, J. R., Boesgaard, A. M., & Ryan, S. G. 1994, ApJ, 434, L81
- (65)
- (66) Demarque, P., Green, E. M., & Guenther, D. B. 1992, AJ, 103, 151
- (67)
- (68) Edvardsson, B., Andersen, J., Gustafsson, B. et al. 1993, A&A, 275, 101
- (69)
- (70) Feltzing, S. & Gonzales, G. 2001, A&A, 367, 253
- (71)
- (72) Francois, P., Pasquini, L., Biazzo, K., Bonifacio, P., & Palsa, R. 2013 A&A, 552, 136
- (73)
- (74) Friel, E.D., Janes, K.A., Tavarez, M., et al. 2002, AJ, 124, 2693
- (75)
- (76) Friel, E.D., Liu, T., & Janes, K.A. 1989, PASP, 101, 1105
- (77)
- (78) Gao, X.-H. & Chen, L. 2012, ChA&A, 36, 1
- (79)
- (80) Garnavich, P., VandenBerg, D. A., Zurek, D. R., & Hesser, J. E. 1994, AJ, 107, 1097
- (81)
- (82) Geisler, D., Villanova, S., Carraro, G. et al. 2012, ApJ, 756, 40
- (83)
- (84) Gratton, R., Bragaglia, A. Carretta, E. & Tosi, M. 2006, AJ, 642, 462
- (85)
- (86) Herbig, G.H. 1965, ApJ, 141, 588
- (87)
- (88) Herbig, G.H. & Wolff R.J. 1966 AnAp, 29, 593
- (89)
- (90) Hobbs, L. M. & Pilachowski C., 1988, ApJ 334, 73
- (91)
- (92) Iben, I.I. 1965, ApJ, 142, 1447
- (93)
- (94) Iben, I.I. 1967, ApJ, 147, 624
- (95)
- (96) Jeffries, R. D., & James, D. J. 1999, ApJ, 511, 218
- (97)
- (98) Jilkova, L., Carraro, G., Jungwiert, B., & Minchev, I. 2012, A&A, 541, 64
- (99)
- (100) King, I.R., Bedin, L.R., Piotto, G., Cassisi, S. & Anderson, J. 2005, AJ, 130, 626
- (101)
- (102) Kurucz, R.L. 1993, CD-ROM 13 (Cambridge: Smithsonian Astrophys. Obs.)
- (103)
- (104) Lind, K., Primas, F., Charbonnel, C., Grundahl, F., & Asplund, M. 2009, A&A, 503, 545
- (105)
- (106) Maderak, R.M., Deliyannis, C.P., King, J.R., Cummings, J.D. 2013, AJ, 146, 143
- (107)
- (108) Magrini, L, Randich, S., Zocali, M. et al. 2010, A&A523, A11
- (109)
- (110) Masana, E., Jordi, C., & Ribas, I. 2006, A&A, 450, 735
- (111)
- (112) Montgomery, K. A., Janes, K. A., & Phelps, R. L. 1994, AJ, 108, 585
- (113)
- (114) Origlia, L., Valenti, E., Rich, R.M., & Ferraro, F.R. 2006, ApJ, 646, 499
- (115)
- (116) Peterson, R. C., & Green, E. M. 1998, ApJL, 502, L39
- (117)
- (118) Piatti, A.E., Claria, J.J. Bica, E., Geisler, D., & Minniti, D. 1998, AJ, 116, 801
- (119)
- (120) Pinsonneault, M., 1997, ARA&A, 35, 557
- (121)
- (122) Platais, I., Cudworth, K.M., Kozhurina-Platais, et al. 2011, ApJ, 733, L1
- (123)
- (124) Ramirez, I., Allende Prieto, C., & Lambert, D.L. 2013, ApJ, 764, 78
- (125)
- (126) Ramirez, I., Fish, J.R., Lambert, D.L., & Allende Prieto, C. 2012, ApJ, 756, 46
- (127)
- (128) Randich, S., Sestito, P., & Pallavicini, R., 2003, A&A, 399, 133
- (129)
- (130) Reddy, B., Lambert, D.L. & Allende Prieto, C. 2006, MNRAS, 367, 1329
- (131)
- (132) Ryan, S. G., & Deliyannis, C. P. 1995, ApJ, 453, 819
- (133)
- (134) Sagar, R., Munari, U., & de Boer, K.S. 2001, MNRAS, 327, 23
- (135)
- (136) Sestito, P., & Randich, S. 2005, A&A, 442, 615
- (137)
- (138) Sestito, P., Randich, S., & Bragaglia, A. 2007, A&A, 465, 185
- (139)
- (140) Sills, A., & Deliyannis, C. P. 2000, ApJ, 544, 944
- (141)
- (142) Sneden, C. 1973, PhD thesis, Univ. of Texas, Austin
- (143)
- (144) Stetson, P.B., Bruntt, H. & Grundahl, F. 2003, PASP, 115, 413
- (145)
- (146) Takeda, Y. 2003, A&A, 402, 343
- (147)
- (148) Twarog, B.A., Anthony-Twarog, B.J., & De Lee, N. 2003, AJ, 125, 1383
- (149)
- (150) Twarog, B., Carraro, G., & Anthony-Twarog, B.J. 2011, ApJ, 727, L7
- (151)
- (152) Vogt, S. S. et al. 1994, Proc. SPIE, 2198, 362
- (153)
- (154) Wiese, W.L., Fuhr, J.R. & Deters, T.M. 1996, Atomic Transition Probabilities for Carbon, Nitrogen, and Oxygen, (J. Phys. Chem. Ref. Data. Monograph Vol. 7, Melville, NY: AIP)
- (155)
- (156) Worthey, G. & Jowett, K.J. 2003, PASP, 115, 96
- (157)


| MJP | SBG | V | B-V | Night | Exp.(min) | S/N |
|---|---|---|---|---|---|---|
| 303 | 15592 | 17.426 | 0.843 | 2008 Jul 22 | 6 x 30 | 40 |
| 885 | 14416 | 17.437 | 0.934 | 2009 Aug 04 | 5 x 30 | 40 |
| 1328 | 13334 | 17.382 | 0.927 | 2008 Jul 22 | 2 x 45 | |
| 2008 Aug 14 | 4 x 30 | 37 | ||||
| 1346 | 13352 | 17.508 | 0.872 | 2009 Jul 17 | 3 x 30 | |
| 2009 Aug 04 | 3 x 30 | 30 | ||||
| 1783 | 12181 | 17.408 | 0.901 | 2009 Aug 04 | 5 x 30 | 42 |
| 2279 | 11220 | 17.366 | 0.920 | 2008 Jul 22 | 3 x 30, 2 x 45 | 37 |
| 4112 | 7649 | 17.418 | 0.893 | 2000 May 28 | 2 x 60 | |
| 2000 May 29 | 2 x 60 | 38 | ||||
| 5061 | 5744 | 17.366 | 0.960 | 1999 Jun 07 | 2 x 40 | |
| 1999 Jun 08 | 2 x 50 | 40 | ||||
| 5597 | 4591 | 17.384 | 0.829 | 2009 Jul 17 | 6 x 30 | 35 |
| 6930 | 2130 | 17.365 | 0.921 | 2009 Jul 17 | 5 x 30 | 37 |
| MJP | SBG | Bro | g | |||||||
|---|---|---|---|---|---|---|---|---|---|---|
| 303 | 15592 | 28222 | 18.269 | 17.426 | 0.843 | 0.688 | 5743 | 4.12 | 1.52 | |
| 885 | 14416 | 26107 | 18.320 | 17.398 | +0.012 | 0.934 | 0.779 | 5486 | 4.03 | 1.45 |
| 1328 | 13334 | 24514 | 18.292 | 17.369 | +0.004 | 0.927 | 0.772 | 5505 | 4.01 | 1.49 |
| 1346 | 13352 | 24536 | 18.294 | 17.442 | +0.020 | 0.872 | 0.717 | 5659 | 4.12 | 1.47 |
| 1783 | 12181 | 23028 | 18.307 | 17.406 | +0.000 | 0.901 | 0.746 | 5577 | 4.05 | 1.50 |
| 2279 | 11220 | 21859 | 18.276 | 17.358 | +0.002 | 0.920 | 0.765 | 5524 | 4.01 | 1.50 |
| 4112 | 7649 | 17730 | 18.336 | 17.438 | 0.005 | 0.893 | 0.738 | 5599 | 4.06 | 1.50 |
| 5061 | 5744 | 15480 | 18.350 | 17.385 | 0.005 | 0.960 | 0.805 | 5417 | 3.97 | 1.48 |
| 5597 | 4591 | 14096 | 18.297 | 17.449 | 0.019 | 0.829 | 0.674 | 5784 | 4.12 | 1.55 |
| 6930 | 2130 | 18.286 | 17.365 | 0.921 | 0.766 | 5522 | 4.01 | 1.47 |
| Ion | (Å) | Ex. Pot. (eV) | W(mÅ) 303 | W(mÅ) 2279 | |
|---|---|---|---|---|---|
| Fe I | 5560.21 | 4.43 | 1.190 | 80.5 | 67.2 |
| 5775.08 | 4.22 | 1.300 | 81.6 | 80.7 | |
| 6027.05 | 4.08 | 1.150 | 83.3 | ||
| 6082.72 | 2.22 | 3.533 | 61.8 | 70.4 | |
| 6127.90 | 4.14 | 1.399 | 65.8 | 72.2 | |
| 6151.62 | 2.18 | 3.299 | 70.9 | 78.0 | |
| 6157.73 | 4.07 | 1.270 | 85.5 | ||
| 6165.36 | 4.14 | 1.470 | 64.1 | 70.6 | |
| 6180.20 | 2.73 | 2.622 | 83.5 | 83.5 | |
| 6187.99 | 3.94 | 1.570 | 73.4 | 71.0 | |
| 6380.74 | 4.19 | 1.388 | 72.6 | 85.4 | |
| 6469.19 | 4.83 | 0.620 | 84.6 | 83.5 | |
| 6475.63 | 2.56 | 2.970 | 80.1 | 84.4 | |
| 6481.87 | 2.28 | 2.980 | 92.9 | 90.5 | |
| 6496.47 | 4.79 | 0.650 | 82.8 | 86.5 | |
| 6498.94 | 0.96 | 4.690 | 75.3 | 81.1 | |
| 6581.22 | 1.48 | 4.790 | 48.7 | 55.2 | |
| 6597.56 | 4.79 | 0.920 | 56.8 | 65.9 | |
| 6608.04 | 2.28 | 4.020 | 38.0 | 39.5 | |
| 6609.11 | 2.56 | 2.677 | 93.9 | 98.0 | |
| 6627.56 | 4.55 | 1.610 | 46.2 | 57.0 | |
| 6703.57 | 2.76 | 3.130 | 62.3 | 61.7 | |
| 6710.32 | 1.48 | 4.900 | 38.3 | 37.8 | |
| 6725.36 | 4.10 | 2.300 | 38.0 | 39.8 | |
| 6726.67 | 4.61 | 1.160 | 68.0 | 73.0 | |
| 6733.15 | 4.64 | 1.520 | 47.3 | 45.8 | |
| 6739.52 | 1.56 | 4.979 | 26.8 | 40.6 | |
| 6752.71 | 4.64 | 1.200 | 59.2 | 69.5 | |
| 7000.62 | 4.14 | 2.240 | 44.9 | 31.1 | |
| 7068.42 | 4.06 | 1.430 | 90.8 | ||
| 7107.47 | 4.19 | 2.070 | 47.4 | 50.8 | |
| 7127.57 | 4.99 | 1.250 | 42.8 | 57.0 | |
| 7132.98 | 4.07 | 1.770 | 58.8 | 82.7 | |
| 7142.52 | 4.95 | 1.090 | 50.6 | 60.9 | |
| 7155.63 | 5.01 | 1.090 | 65.7 | 68.9 | |
| 7219.68 | 4.07 | 1.690 | 77.3 | ||
| 7401.69 | 4.19 | 1.690 | 61.8 | 72.0 | |
| 7568.91 | 4.28 | 0.990 | 94.1 | 95.9 | |
| 7710.37 | 4.22 | 1.220 | 97.1 | 92.5 | |
| 7723.21 | 2.28 | 3.590 | 71.5 | 85.1 | |
| 7745.52 | 5.08 | 1.180 | 34.4 | 52.2 | |
| 7746.60 | 5.06 | 1.290 | 38.5 | 40.3 | |
| 7855.40 | 5.06 | 1.200 | 48.1 | 47.8 | |
| 7879.78 | 5.03 | 1.650 | 21.4 | 19.5 | |
| 7912.87 | 0.86 | 4.900 | 97.2 | ||
| Fe II | 5534.847 | 3.25 | 2.911 | 68.7 | 72.0 |
| 6084.10 | 3.20 | 3.860 | 31.2 | 41.8 | |
| 6149.25 | 3.89 | 2.724 | 55.3 | 54.1 | |
| 6247.56 | 3.89 | 2.329 | 65.6 | ||
| 6369.46 | 2.89 | 4.160 | 38.8 | 34.7 | |
| 6456.39 | 3.90 | 2.075 | 90.1 | ||
| 6516.08 | 2.89 | 3.380 | 70.7 | 65.5 | |
| 7224.46 | 3.89 | 3.243 | 41.1 | ||
| 7711.73 | 3.90 | 2.450 | 75.0 |
| Star | [FeI/H] | num. | [FeII/H] | num. | mean [Fe/H] | ||
|---|---|---|---|---|---|---|---|
| 303 | +0.33 | 0.12 | 42 | +0.27 | 0.12 | 8 | +0.32 |
| 885 | +0.32 | 0.12 | 37 | +0.30 | 0.12 | 7 | +0.32 |
| 1328 | +0.33 | 0.12 | 28 | +0.41 | 0.12 | 6 | +0.34 |
| 1346 | +0.37 | 0.12 | 39 | +0.34 | 0.12 | 5 | +0.37 |
| 1783 | +0.30 | 0.14 | 40 | +0.30 | 0.12 | 5 | +0.30 |
| 2279 | +0.28 | 0.14 | 42 | +0.26 | 0.15 | 6 | +0.28 |
| 4112 | +0.27 | 0.12 | 26 | +0.28 | 0.06 | 5 | +0.27 |
| 5061 | +0.23 | 0.09 | 26 | +0.24 | 0.08 | 6 | +0.23 |
| mean | +0.30 | 0.04 (0.02) | +0.30 | 0.05 (0.02) | +0.30 0.02 | ||
| 5597 | 0.05 | 0.11 | 46 | ||||
| 6930 | 0.33 | 0.11 | 41 |
| Star | (Å) | EQW | log N(O) | corr. | log N(O)n | [O/H]n | [O/Fe]n |
|---|---|---|---|---|---|---|---|
| 303 | 7771.94 | 89.8 | 9.02 | 0.18 | 8.84 | 0.19 | 0.13 |
| +0.32 | 7774.17 | 77.5 | 8.99 | 0.15 | 8.84 | 0.19 | 0.13 |
| 7775.39 | 67.4 | 9.05 | 0.13 | 8.92 | 0.27 | 0.05 | |
| mean | 0.10 0.03 | ||||||
| 885 | 7771.94 | 79.8 | 9.12 | 0.15 | 8.97 | 0.32 | 0.00 |
| +0.32 | 7774.17 | 60.7 | 8.96 | 0.12 | 8.84 | 0.19 | 0.13 |
| 7775.39 | 45.6 | 8.90 | 0.09 | 8.81 | 0.16 | 0.16 | |
| mean | 0.10 0.06 | ||||||
| 1328 | 7771.94 | ||||||
| +0.34 | 7774.17 | 73.9 | 9.14 | 0.14 | 9.00 | 0.34 | 0.00 |
| 7775.39 | |||||||
| mean | 0.00 | ||||||
| 1346 | 7771.94 | 86.9 | 9.08 | 0.17 | 8.91 | 0.26 | 0.11 |
| +0.37 | 7774.17 | 84.2 | 9.19 | 0.17 | 9.02 | 0.37 | 0.00 |
| 7775.39 | |||||||
| mean | 0.06 0.08 | ||||||
| 1783 | 7771.94 | 89.4 | 9.17 | 0.18 | 8.99 | 0.34 | 0.04 |
| +0.30 | 7774.17 | 68.6 | 9.01 | 0.14 | 8.87 | 0.22 | 0.08 |
| 7775.39 | 57.8 | 9.05 | 0.11 | 8.94 | 0.29 | 0.01 | |
| mean | 0.02 0.04 | ||||||
| 2279 | 7771.94 | 78.0 | 9.04 | 0.15 | 8.89 | 0.24 | 0.04 |
| +0.28 | 7774.17 | 71.2 | 9.08 | 0.14 | 8.94 | 0.29 | 0.01 |
| 7775.39 | 47.0 | 8.87 | 0.10 | 8.76 | 0.11 | 0.17 | |
| mean | 0.07 0.07 | ||||||
| Sun | 7771.94 | 62.8 | 8.68 | 0.11 | 8.57 | ||
| 0.00 | 7774.17 | 59.8 | 8.78 | 0.10 | 8.68 | ||
| 7775.39 | 46.6 | 8.77 | 0.07 | 8.70 | |||
| mean | 8.74 | 8.65 |
| HIP | HD | [Fe/H] | Gyr | [O/H]n | [O/Fe]n |
|---|---|---|---|---|---|
| 10303 | 13612 | 0.10 | 8.24 | +0.01 | 0.09 |
| 11505 | 15069 | 0.02 | 9.01 | +0.08 | +0.06 |
| 16467 | 21727 | 0.02 | 9.01 | 0.09 | 0.07 |
| 21703 | 29528 | 0.16 | 8.67 | +0.14 | 0.02 |
| 25052 | 34634 | 0.09 | 8.28 | +0.15 | +0.06 |
| 31419 | 47051 | 0.06 | 9.39 | +0.19 | +0.13 |
| 33382 | 51219 | 0.00 | 9.21 | +0.06 | +0.06 |
| 36210 | 54468 | 0.03 | 8.28 | +0.05 | +0.02 |
| 43587 | 75732 | 0.39 | 8.67 | +0.38 | 0.01 |
| 55288B | 0.05 | 8.91 | +0.17 | +0.12 | |
| 57532 | 102326 | 0.22 | 8.67 | +0.26 | +0.04 |
| 58576 | 104304 | 0.26 | 7.93 | +0.32 | +0.06 |
| 62039 | 110537 | 0.11 | 8.45 | +0.22 | +0.11 |
| 62198 | 110885 | 0.07 | 8.60 | +0.10 | +0.03 |
| 63881 | 113712 | 0.12 | 8.66 | +0.15 | +0.03 |
| 65049 | 115968 | 0.20 | 10.62 | +0.29 | +0.09 |
| 66514 | 118742 | 0.00 | 11.45 | +0.12 | +0.12 |
| 68184 | 122064 | 0.11 | 13.89 | +0.34 | +0.23 |
| 69972 | 125072 | 0.28 | 8.76 | +0.55 | +0.27 |
| 72848 | 131511 | 0.04 | 10.19 | +0.08 | +0.04 |
| 73078 | 132130 | 0.05 | 9.69 | +0.11 | +0.06 |
| 73815 | 133600 | 0.02 | 8.15 | +0.04 | +0.02 |
| 81748 | 150633 | 0.11 | 9.79 | +0.19 | +0.08 |
| 82265 | 151504 | 0.11 | 10.16 | +0.18 | +0.07 |
| 82750 | 153344 | 0.18 | 9.20 | +0.12 | 0.06 |
| 86796 | 160691 | 0.27 | 8.18 | +0.32 | +0.05 |
| 94615 | 230999 | 0.09 | 11.65 | +0.15 | +0.06 |
| 96901 | 186427 | 0.04 | 8.91 | +0.08 | +0.04 |
| 99240 | 190248 | 0.33 | 10.65 | +0.40 | +0.07 |
| 99825 | 192310 | 0.06 | 9.41 | +0.16 | +0.10 |
| 102081 | 197207 | 0.09 | 10.61 | +0.31 | +0.22 |
| 106678 | 205656 | 0.01 | 10.30 | +0.15 | +0.14 |
| 114622 | 219134 | 0.00 | 10.93 | +0.23 | +0.23 |
| 115066 | 219781 | 0.11 | 8.29 | +0.14 | +0.03 |
| HD | [Fe/H] | [Mg/Fe] | [Si/Fe] | [Ca/Fe] | [Ti/Fe] | [Cr/Fe] | [Ni/Fe] | ref 11References: C = Chen et al. (2003), E = Edvardsson et al. (1993), FG= Feltzing & Gonzalez (2001), R = Reddy et al. (2006) |
|---|---|---|---|---|---|---|---|---|
| 1461 | +0.39 | +0.05 | 0.08 | 0.09 | 0.05 | 0.01 | +0.01 | C |
| 73393 | +0.05 | +0.04 | 0.01 | +0.02 | 0.02 | 0.05 | 0.03 | C |
| 86728 | +0.20 | +0.00 | +0.03 | +0.05 | 0.02 | +0.01 | 0.00 | C |
| 104304 | +0.30 | 0.01 | +0.08 | 0.08 | 0.03 | +0.02 | +0.03 | C |
| 127334 | +0.27 | +0.03 | 0.04 | +0.03 | 0.03 | +0.07 | 0.01 | C |
| 175518 | +0.36 | +0.05 | 0.04 | +0.01 | +0.02 | 0.03 | 0.00 | C |
| 182488 | +0.23 | 0.04 | +0.04 | 0.05 | 0.02 | 0.09 | +0.02 | C |
| 186408 | +0.06 | +0.05 | +0.02 | +0.05 | 0.04 | +0.02 | 0.01 | C |
| 190360 | +0.19 | +0.17 | +0.11 | +0.02 | +0.01 | +0.02 | +0.04 | C |
| 45701 | +0.13 | +0.21 | +0.05 | +0.01 | 0.02 | +0.01 | E | |
| 67228 | +0.04 | +0.15 | +0.12 | 0.01 | +0.07 | +0.11 | E | |
| 76151 | +0.01 | +0.12 | 0.02 | 0.06 | +0.03 | +0.04 | E | |
| 108309 | +0.10 | +0.13 | +0.04 | 0.01 | +0.11 | +0.04 | E | |
| 177565 | +0.03 | +0.09 | +0.03 | +0.03 | 0.00 | 0.01 | E | |
| 217014 | +0.06 | +0.26 | +0.07 | +0.05 | +0.02 | +0.10 | E | |
| 99491 | +0.22 | +0.13 | 0.04 | 0.05 | 0.05 | +0.04 | FG | |
| 104304 | +0.15 | +0.12 | 0.00 | 0.04 | 0.04 | +0.05 | FG | |
| 145675 | +0.47 | +0.09 | 0.26 | +0.15 | +0.15 | +0.08 | FG | |
| 182572 | +0.34 | +0.15 | 0.06 | 0.02 | 0.02 | +0.02 | FG | |
| 21703 | +0.16 | +0.16 | +0.05 | 0.15 | 0.08 | 0.07 | +0.02 | R |
| 33382 | +0.00 | 0.06 | +0.05 | 0.10 | 0.13 | 0.00 | +0.02 | R |
| 81748 | +0.11 | +0.13 | 0.02 | 0.16 | 0.18 | +0.09 | +0.07 | R |
| 82265 | +0.11 | +0.02 | 0.01 | 0.08 | 0.04 | +0.03 | +0.07 | R |
| 94615 | +0.09 | 0.17 | 0.12 | 0.16 | 0.12 | +0.11 | +0.08 | R |
| 102081 | +0.09 | +0.23 | 0.08 | 0.00 | 0.08 | 0.09 | 0.06 | R |
| Star | [Fe/H] | A(Li) | [O/Fe]n | [Mg/Fe] | [Si/Fe] | [Ca/Fe] | [Ti/Fe] | [Cr/Fe] | [Ni/Fe] |
|---|---|---|---|---|---|---|---|---|---|
| 303 | +0.32 | 1.40 | 0.10 | +0.10 | +0.03 | 0.03 | +0.07 | 0.09 | 0.06 |
| 885 | +0.32 | 1.20 | 0.10 | +0.12 | +0.05 | 0.29 | 0.12 | 0.01 | 0.01 |
| 1328 | +0.34 | 1.40 | 0.00 | +0.13 | +0.06 | 0.08 | 0.07 | 0.01 | 0.04 |
| 1346 | +0.37 | 1.70 | 0.06 | 0.07 | +0.06 | 0.10 | 0.01 | 0.07 | 0.04 |
| 1783 | +0.30 | 0.90 | 0.02 | +0.17 | +0.13 | 0.26 | 0.09 | 0.11 | 0.04 |
| 2279 | +0.28 | 1.45 | 0.07 | +0.01 | +0.02 | 0.19 | 0.09 | 0.05 | 0.04 |
| 4112 | +0.27 | 1.30 | +0.08 | 0.05 | 0.12 | 0.01 | 0.04 | ||
| 5061 | +0.23 | 1.25 | +0.16 | 0.08 | +0.03 | 0.06 | 0.06 | ||
| mean | +0.304 | 0.057 | +0.077 | +0.074 | 0.129 | 0.050 | 0.045 | 0.041 | |
| 0.044 | 0.042 | 0.089 | 0.048 | 0.106 | 0.071 | 0.043 | 0.015 | ||
| μ | 0.016 | 0.019 | 0.040 | 0.018 | 0.040 | 0.027 | 0.016 | 0.006 |
| Element | Turn-off Stars | μ | Carretta Giants | Carraro Giants | ||
|---|---|---|---|---|---|---|
| Fe/H | +0.30 | 0.02 | +0.47 | 0.07 | +0.39 | 0.02 |
| O/Fe | 0.06 | 0.02 | 0.31 | 0.08 | ||
| Mg/Fe | +0.08 | 0.04 | +0.20 | 0.05 | ||
| Si/Fe | +0.07 | 0.02 | 0.01 | 0.10 | +0.02 | 0.03 |
| Ca/Fe | 0.13 | 0.04 | 0.15 | 0.08 | 0.03 | 0.02 |
| Ti/Fe | 0.05 | 0.03 | 0.03 | 0.09 | 0.02 | 0.03 |
| Ni/Fe | +0.04 | 0.01 | 0.07 | 0.07 | 0.01 | 0.04 |
| Star | Element | Teff | log g | [Fe/H] | Total | |
|---|---|---|---|---|---|---|
| 75 K | 0.20 | 0.10 | 0.20 | |||
| MJP 303 | Fe I | 0.05 | 0.01 | 0.00 | 0.04 | 0.06 |
| Fe II | 0.04 | 0.07 | 0.02 | 0.06 | 0.09 | |
| O I | 0.07 | 0.05 | 0.00 | 0.03 | 0.09 | |
| Mg I | 0.03 | 0.04 | 0.00 | 0.02 | 0.05 | |
| Si I | 0.01 | 0.02 | 0.01 | 0.03 | 0.04 | |
| Ca I | 0.06 | 0.04 | 0.01 | 0.05 | 0.09 | |
| Ti I | 0.08 | 0.01 | 0.00 | 0.04 | 0.09 | |
| Cr I | 0.07 | 0.01 | 0.00 | 0.03 | 0.08 | |
| Ni I | 0.05 | 0.00 | 0.01 | 0.04 | 0.06 | |
| MJP 885 | Fe I | 0.04 | 0.01 | 0.00 | 0.05 | 0.06 |
| Fe II | 0.06 | 0.10 | 0.02 | 0.07 | 0.14 | |
| O I | 0.08 | 0.08 | 0.00 | 0.03 | 0.12 | |
| Mg I | 0.04 | 0.03 | 0.01 | 0.04 | 0.06 | |
| Si I | 0.01 | 0.02 | 0.01 | 0.04 | 0.04 | |
| Ca I | 0.06 | 0.04 | 0.01 | 0.06 | 0.09 | |
| Ti I | 0.08 | 0.02 | 0.01 | 0.04 | 0.09 | |
| Cr I | 0.07 | 0.02 | 0.00 | 0.03 | 0.08 | |
| Ni I | 0.03 | 0.01 | 0.01 | 0.05 | 0.06 |