1–4
Universal void density profiles from simulation and SDSS
Abstract
We discuss the universality and self-similarity of void density profiles, for voids in realistic mock luminous red galaxy (LRG) catalogues from the Jubilee simulation, as well as in void catalogues constructed from the SDSS LRG and Main Galaxy samples. Voids are identified using a modified version of the ZOBOV watershed transform algorithm, with additional selection cuts. We find that voids in simulation are self-similar, meaning that their average rescaled profile does not depend on the void size, or – within the range of the simulated catalogue – on the redshift. Comparison of the profiles obtained from simulated and real voids shows an excellent match. The profiles of real voids also show a universal behaviour over a wide range of galaxy luminosities, number densities and redshifts. This points to a fundamental property of the voids found by the watershed algorithm, which can be exploited in future studies of voids.
keywords:
catalogues – cosmology: observations – large-scale structure of Universe – methods: numerical – methods: data analysis1 Introduction
Voids are recognised as particularly interesting objects for cosmology for many reasons. Of particular interest recently has been their use as probes of the expansion history via the Alcock-Paczynski test (e.g. [Lavaux & Wandelt 2012], [Hamaus et al. 2014c]), void-galaxy correlations ([Hamaus et al. 2014a], [Paz et al. 2013]) and the weak lensing signal of stacked voids (e.g. [Krause et al. 2013], [Clampitt & Jain 2014]). It has even been suggested that the integrated Sachs-Wolfe effect of voids on the CMB can be measured ([Granett et al. 2008]), though theoretical expectations and more recent observational results (e.g. [Nadathur et al. 2012], [Flender et al. 2013], [Cai et al. 2013], [Hotchkiss et al. 2015]) do not support this.
Many of these studies have assumed that voids are self-similar objects, in particular that the density distribution in each void can be simply rescaled depending on the size of the void, and sometimes that this distribution is universal—that is, that the rescaled void properties are independent of the properties of the tracer population in which the voids were identified or the survey redshift. The form of the density profile itself has also been the subject of study (e.g. [Colberg et al. 2005], [Ceccarelli et al. 2013], [Nadathur & Hotchkiss 2014], [Sutter et al. 2014], [Ricciardelli et al. 2014], [Hamaus et al. 2014b], [Nadathur et al. 2014]), but there is a lack of consensus on the functional form of the profile as well as on the questions of self-similarity and universality.
We make use of data from the Jubilee -body simulation ([Watson et al., 2014]) and SDSS DR7 galaxy catalogues to further investigate these issues. The voids are identified using a modified version of the ZOBOV watershed transform void finder ([Neyrinck 2008]) with further selection criteria imposed to avoid spurious detections arising from Poisson noise or survey boundary contamination effects. The void catalogues from SDSS data are taken from [Nadathur & Hotchkiss 2014], and cover voids identified in six spectroscopic volume-limited galaxy samples (dim1, dim2, bright1, bright2, lrgdim and lrgbright; [Blanton et al. 2005, Kazin et al. 2010]), with widely varying luminosity cuts and galaxy densities. For Jubilee data we use an HOD model applied to halos on the light cone ([Watson et al., 2014, Nadathur et al. 2014]) to obtain two mock LRG samples, referred to as JDim and JBright, whose properties match those of the lrgdim and lrgbright, and extract voids from those.
2 Method
To identify voids we use a modification of the ZOBOV algorithm ([Neyrinck 2008]), which uses a Voronoi tessellation field estimator (VTFE) to reconstruct the galaxy density field from discrete point distribution, and then joins local minima of this field together to form voids according to the watershed algorithm. We account for the finite redshift extents of the samples and the irregular SDSS survey mask through the use of buffer particles at all survey boundaries. We restrict the merging of zones of density minima beyond linking densities and apply a strict selection criterion on the minimum VTFE density in the void, . This last criterion is introduced to counter shot noise effects. Even in a uniform Poisson distribution of points, ZOBOV will always find spurious ‘voids’ with ; however, fewer than of these spurious voids have ([Nadathur & Hotchkiss 2014]). We have also examined stricter criteria and , which do not materially affect our conclusions.
For each void, we define its centre to be the volume-weighted barycentre of the member galaxies of the void as identified by ZOBOV, , where is the volume of the Voronoi cell of the th galaxy, and the void effective radius to be the volume of a sphere occupying a volume equal to the sum of the Voronoi volumes of the void member galaxies.
To measure the average (stacked) galaxy density profile, we first assume self-similarity to rescale all distances from the void centre in units of the radius and construct a series of spherically symmetric radial shells each of width in rescaled units. Then if mean density in the th shell is estimated using the VTFE itself
| (1) |
where is the volume of the Voronoi cell of the galaxy , is its density inferred from the inverse of the Voronoi volume; the sum over runs over all galaxies in the th shell of void (not only void member galaxies); and the sum over includes all voids in the stack. The error in is estimated from jacknife samples excluding all galaxies from each of the voids in turn.
[Nadathur et al. 2014] also examined the performance of two other density estimators. The commonly used ‘naive’ estimator, , where is the volume of the th radial shell of the th void and is the number of galaxies contained within it, was shown to be systematically biased low in low density regions such as void centres. A better estimator based on Poisson statistics is ; however, while this is optimal for simulations in a cubic box with periodic boundary conditions, it suffers from volume-leakage effects when the galaxy positions are restricted to a finite (and highly irregular) survey window, which cause it to underestimate the density at distances for voids close to the survey edge.
3 Results
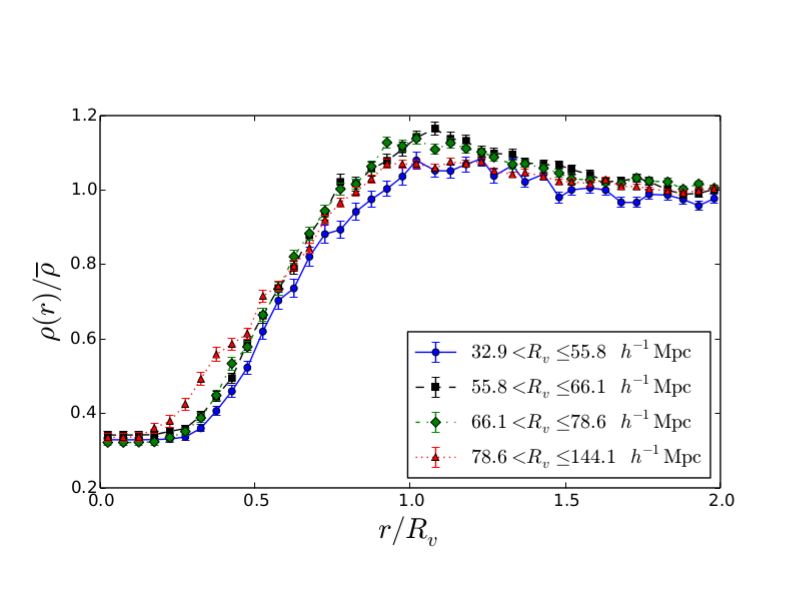
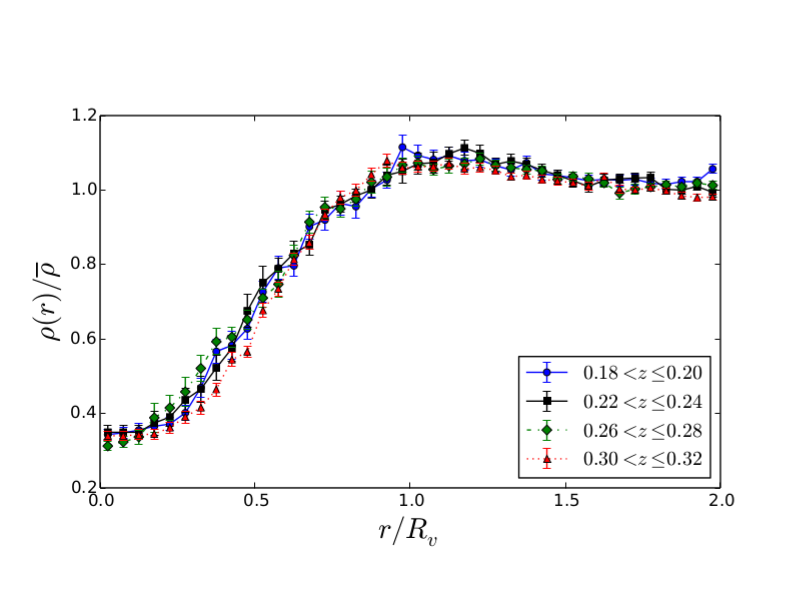
Self-similarity. Although the stacked density estimator of eq.(1) assumes self-similarity, we can also directly test this assumption for consistency by splitting the full stack of voids into different subsets. We find that a small subset () of voids in simulation consist of more than 5 different density minima amalgamated together by the watershed algorithm, and these voids shows a different density profile to the others. This is due to averaging over the internal substructure of these voids, and is also manifest in the greater distance of the barycentre from the minimum density centre. These voids can be removed from the full sample by hand, or they can be eliminated by a stricter (but somewhat arbitrary) choice of the zone merging criterion, as used by [Hamaus et al. 2014b]. When this is done, the remaining voids show no dependence of the mean stacked profile on the void radius or redshift (Fig. 1). We find that a simple fitting formula of the form , with , , and , provides a reasonable fit to the simulation data. This describes a one-parameter family of curves over the void size parameter .
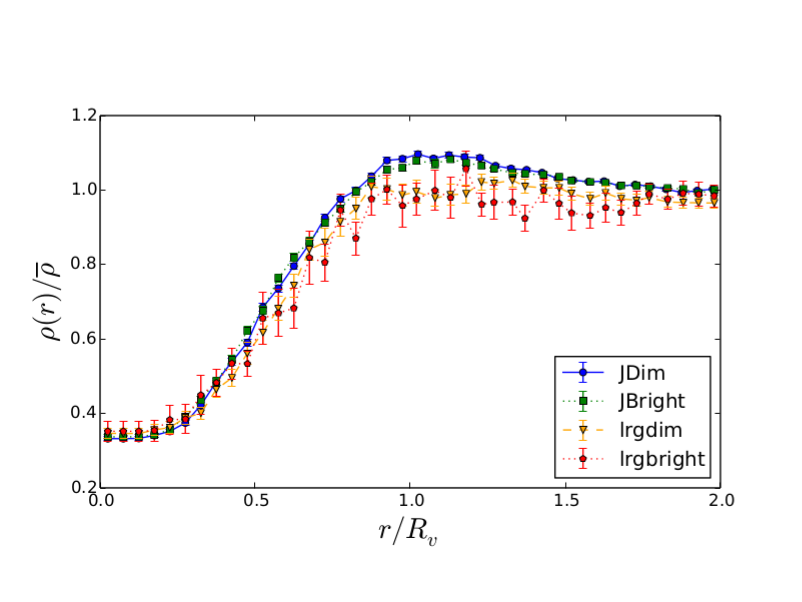
Agreement with SDSS. Fig. 2 shows that up to distances there is very good agreement between the density profiles from Jubilee and SDSS data. There is however a residual small difference at , where in simulation we see an overdense compensating wall at the void edge. This may reflect some small inadequacies of the HOD modelling of LRGs in these regions, but a more likely explanation is that these are residual artefacts of the SDSS survey mask. Further detailed study of the effect of the survey mask in simulations will clarify this issue.
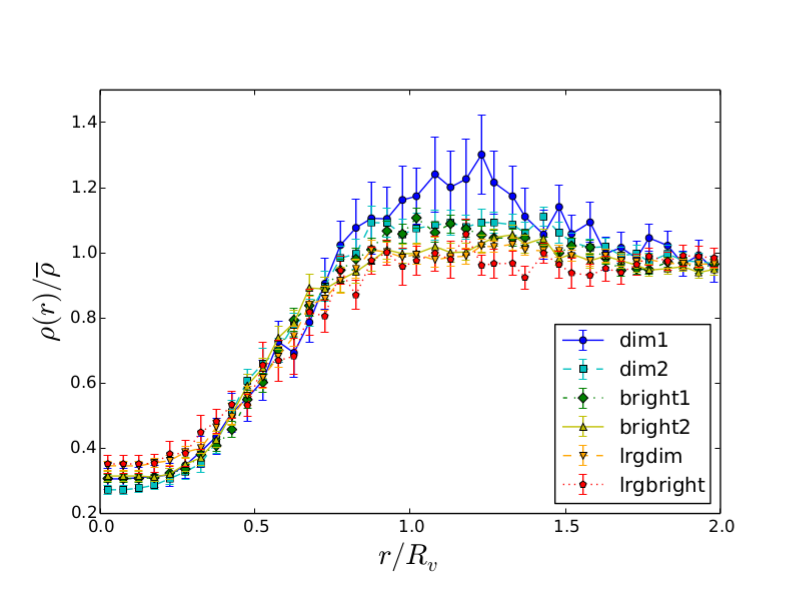
Universality. In Fig. 2, we show the dependence of the average stacked profile on the properties of the tracer galaxies using SDSS data. These samples span a wider range of redshifts (from for dim1 to for lrgbright), absolute magnitudes (from for dim1 to for lrgbright) and mean void sizes (from Mpc for dim1 to Mpc for lrgbright) than is available in our mock catalogues. Nevertheless, the results indicate a remarkable degree of universality in the stacked void profile across all galaxy samples. This universality is most pronounced close to the void centres; small differences are seen at the void edge. The trend seen in this edge region is consistent with the expectation that samples at lower redshift should show higher densities in the void walls simply due to greater growth of structure at late times.
4 Conclusions
The density profile of voids is a subject of great interest for cosmology. Several studies have implicitly assumed the self-similarity and universality of this profile; our aim in this work has been to examine the validity of these assumptions. We find that voids in the Jubilee simulation are indeed self-similar, and that the measured profile matches that seen for voids in the SDSS DR7. In addition we have shown that void profiles from SDSS galaxy samples covering a wide range of galaxy magnitudes and number densities are also universal, being essentially indistinguishable from each other within the void interior. This significantly extends the results found from simulation. It provides a reference point for comparisons with theoretical models ([Sheth & van de Weygaert 2004]) and may prove to be a useful observational tool to constrain cosmology.
References
- [Blanton et al. 2005] Blanton M. R. et al., 2005, AJ, 129, 2562
- [Cai et al. 2013] Cai Y.-C., Neyrinck M. C., Szapudi I., Cole S., Frenk C. S., 2013, ArXiv e-prints, 1301.6136
- [Ceccarelli et al. 2013] Ceccarelli L., Paz D., Lares M., Padilla N., Lambas D. G., 2013, MNRAS, 434, 1435
- [Clampitt et al. 2013] Clampitt J., Cai Y.-C., Li B., 2013, MNRAS, 431, 749
- [Clampitt & Jain 2014] Clampitt J., Jain B., 2014, ArXiv e-prints, arXiv:1404.1834
- [Colberg et al. 2005] Colberg J. M., Sheth R. K., Diaferio A., Gao L., Yoshida N., 2005, MNRAS, 360, 216
- [Flender et al. 2013] Flender S., Hotchkiss S., Nadathur S., 2013, JCAP, 1302, 013
- [Granett et al. 2008] Granett B. R., Neyrinck M. C., Szapudi I., 2008, ApJ, 683, L99
- [Hamaus et al. 2014a] Hamaus, N., Wandelt B. D., Sutter P. M., Lavaux G. and Warren M. S., 2014, Phys. Rev. Lett., 112, 041304
- [Hamaus et al. 2014b] Hamaus N., Sutter P. M., Wandelt B. D., 2014, Phys. Rev. Lett., 112, 251302
- [Hamaus et al. 2014c] Hamaus N., Sutter P. M., Lavaux G. and Wandelt B. D., 2014, ArXiv e-prints, arXiv:1409.3580
- [Hotchkiss et al. 2015] Hotchkiss S., Nadathur S., Gottlöber S., et al., 2015, MNRAS, 446, 1321
- [Kazin et al. 2010] Kazin E. A. et al., 2010, ApJ, 710, 1444
- [Krause et al. 2013] Krause E., Chang T.-C., Doré O., Umetsu K., 2013, ApJ, 762, L20
- [Lavaux & Wandelt 2012] Lavaux G., Wandelt B. D., 2012, ApJ, 754, 109
- [Nadathur & Hotchkiss 2014] Nadathur S., Hotchkiss S., 2014, MNRAS, 440, 1248
- [Nadathur et al. 2012] Nadathur S., Hotchkiss S., Sarkar S., 2012, JCAP, 1206, 042
- [Nadathur et al. 2014] Nadathur S., Hotchkiss S., Diego J. M., et al., 2014, ArXiv e-prints, arXiv:1407.1729
- [Neyrinck 2008] Neyrinck M. C., 2008, MNRAS, 386, 2101
- [Paz et al. 2013] Paz D., Lares M., Ceccarelli L., Padilla N., Lambas D. G., 2013, MNRAS, 436, 3480
- [Ricciardelli et al. 2014] Ricciardelli E., Quilis V., Varela J., 2014, MNRAS, 440, 601
- [Sheth & van de Weygaert 2004] Sheth R. K., van de Weygaert R., 2004, MNRAS, 350, 517
- [Sutter et al. 2014] Sutter P. M., Lavaux G., Hamaus N., Wandelt B. D., Weinberg D. H., Warren M. S., 2014, MNRAS, 442, 462
- [Watson et al., 2014] Watson W. A. et al., 2014, MNRAS, 438, 412