Astrochemistry at work in the L1157–B1 shock: acetaldehyde formation
Abstract
The formation of complex organic molecules (COMs) in protostellar environments is a hotly debated topic. In particular, the relative importance of the gas phase processes as compared to a direct formation of COMs on the dust grain surfaces is so far unknown. We report here the first high-resolution images of acetaldehyde (CH3CHO) emission towards the chemically rich protostellar shock L1157-B1, obtained at 2 mm with the IRAM Plateau de Bure interferometer. Six blueshifted CH3CHO lines with = 26-35 K have been detected. The acetaldehyde spatial distribution follows the young ( 2000 yr) outflow cavity produced by the impact of the jet with the ambient medium, indicating that this COM is closely associated with the region enriched by iced species evaporated from dust mantles and released into the gas phase. A high CH3CHO relative abundance, 2–3 10-8, is inferred, similarly to what found in hot-corinos. Astrochemical modelling indicates that gas phase reactions can produce the observed quantity of acetaldehyde only if a large fraction of carbon, of the order of 0.1%, is locked into iced hydrocarbons.
keywords:
Molecular data – Stars: formation – radio lines: ISM – submillimetre: ISM – ISM: molecules1 Introduction
Complex organic molecules (COMs) have a key role among the many molecules so far detected in space: since they follow the same chemical rules of carbon-based chemistry, which terrestrial life is based on, they may give us an insight into the universality of life. Of course, large biotic molecules are not detectable in space, certainly not via (sub)millimeter observations. However, to determine whether pre-biotic molecules may form in space, we first need to understand the basic mechanisms that form smaller COMs. There is an extensive literature on the subject and still much debate on how COMs may form in space (e.g. Herbst & van Dishoeck 2009; Caselli & Ceccarelli 2012; Bergin 2013). Two basic processes are, in principle, possible: COMs may form on the grain surfaces or in gas phase. It is possible and even probable that the two processes are both important in different conditions for different molecules.
Acetaldehyde (CH3CHO) has been detected in a large range of interstellar conditions and with different abundances, namely in hot cores (Blake et al. 1986), hot corinos (Cazaux et al. 2003), cold envelopes (Jaber et al. 2014), Galactic Center clouds (Requena-Torres et al. 2006) and pre-stellar cores (Öberg et al. 2010). Grain surface models predict that CH3CHO is one of the simplest COMs and can be formed either by the combination of two radicals on the grain surface, CH3 and HCO, which become mobile when the grain temperature reaches 30 K (Garrods & Herbst 2006), or by irradiation of iced CH4, CO2 and other iced species (Bennett et al. 2005). For the former route, the two radicals are predicted to be formed either because of the photolysis of more complex molecules on the grain mantles or, more simply, because of the partial hydrogenation of simple biatomic molecules on the grain mantles (Taquet et al. 2012). Conversely, gas phase models claim that acetaldehyde is easily formed by the oxidation of hydrocarbons, which are produced by the hydrogenation of carbon chain on the grain mantles (Charnley et al. 1992, 2004). Finally, a further possible mechanism involving formation in the very high density gas-phase immediately after ice mantles are sublimated has been proposed by Rawlings et al. (2013).
In general, it is very difficult to distinguish which of these three mechanisms are at work and, consequently, their relative importance. The chemically rich shocked region L1157-B1 offers a unique possibility to test these theories, as it is a place where the dust is not heated by the protostar, but some of the grain mantles are sputtered/injected in the gas phase because of the passage of a shock (see e.g. Fontani et al. 2014). The L1157-mm protostar ( = 250 pc) drives a chemically rich outflow (Bachiller et al. 2001), associated with molecular clumpy cavities (Gueth et al. 1996), created by episodic events in a precessing jet. Located at the apex of the more recent cavity, the bright bow shock called B1 has a kinematical age of 2000 years. This shock spot has been the target of several studies (e.g. the Large Programs Herschel/CHESS111http://www-laog.obs.ujf-grenoble.fr/heberges/chess/ (Chemical Herschel Surveys of Star forming regions; Ceccarelli et al. 2010; and IRAM-30m/ASAI222http://www.oan.es/asai (Astrochemical Survey At IRAM). In this Letter we report high spatial resolution observations of acetaldehyde, with the aim to constrain and quantify the contribution of gas phase chemistry to the CH3CHO formation.
2 Observations
L1157-B1 was observed with the IRAM Plateau de Bure (PdB) 6-element array in April–May 2013 using both the C and D configurations, with 21–176 m baselines, filtering out structures 20, and providing an angular resolution of 25 23 (PA = 90). The primary HPBW is . The observed CH3CHO lines (see Table 1) at 134–136 GHz were detected using the WideX backend which covers a 4 GHz spectral window at a 2 MHz ( 4.4 km s-1) spectral resolution. The system temperature was 100–200 K in all tracks, and the amount of precipitable water vapor was generally 5 mm. Calibration was carried out following standard procedures, using GILDAS-CLIC333http://www.iram.fr/IRAMFR/GILDAS. Calibration was performed on 3C279 (bandpass), 1926+611, and 1928+738 (phase and amplitude). The absolute flux scale was set by observing MWC349 ( Jy at 134 GHz). The typical rms noise in the 2 MHz channels was 0.7 mJy beam-1.
3 Results: Images and Spectra
Acetaldehyde emission has been clearly (S/N 10) detected towards L1157–B1. Fig. 1 shows the map of the CH3CHO(70,7–60,6) E and A lines integrated emission. In order to verify whether the present CH3CHO image is altered by filtering of large-scale emission, we produced the CH3CHO(70,7–60,6) E+A spectrum summing the emission measured at PdBI in a circle of diameter equal to the half-power beam width (HPBW) of the IRAM-30m telescope (17). We evaluated the missing flux by comparing such emission with the spectrum directly measured with the single-dish (from the ASAI spectral survey, Lefloch et al., in preparation). As already found for HDCO by Fontani et al. (2014), with the PdBI we recover more than 80% of the flux, indicating that both tracers do not have significant extended structures. The spatial distribution reported in Fig. 1 shows that CH3CHO is mainly associated with two regions: (i) the eastern B0-B1 cavity opened by the precessing jet (called ‘E-wall’, see Fig. 1 in Fontani et al. 2014), and (ii) the arch-like structure composed by the B1a-e-f-b clumps identified by CH3CN (called ‘arch’). The red, turquoise, and magenta polygons shown in Fig. 1 sketch out these two regions, intersecting at the position of the B1a clump. Note that B1a is in turn located where the precessing jet is expected to impact the cavity producing a dissociative J-shock (traced by high velocity SiO, H2O, [FeII], [OI], and high-J CO emission: e.g. Gueth et al. 1998, Benedettini et al. 2012).
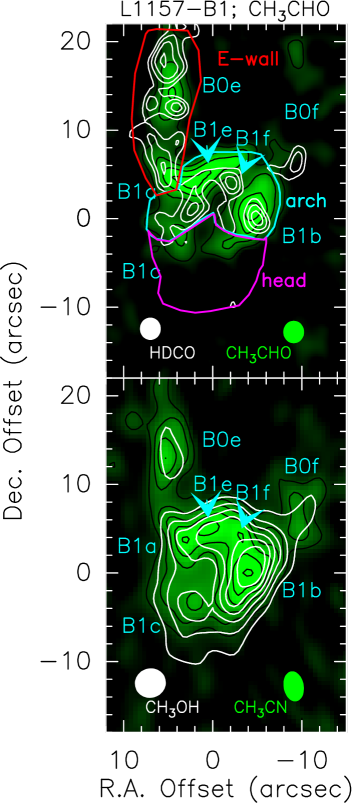
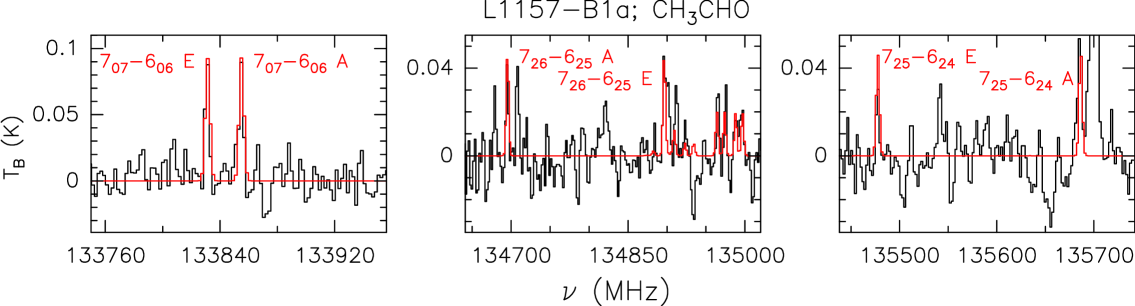
Figure 2 shows the CH3CHO line spectrum observed with the 3.6 GHz WideX bandwidth towards the brightest clump, B1a. Up to six lines ( = 26–35 K, see Table 1) are detected with a S/N 3. Using the GILDAS–Weeds package (Maret et al. 2011) and assuming optically thin emission and LTE conditions, we produced the synthetic spectrum (red line in Fig. 2) that best fits the observed one. Note that the CH3CHO lines are blue-shifted, by 2 km s-1, with respect to the cloud systemic velocity (+2.6 km s-1: Bachiller & Peréz Gutiérrez 1997), and have linewidths of 8 km s-1. Similarly, we extracted the CH3CHO line spectrum towards the three B1 zones, ‘E-wall’, ‘arch’, and ‘head’, shown in Fig. 1. Table 2 reports the measured peak velocities, intensities (in scale), FWHM linewidths, and integrated intensities, for each of the three zones.
| Transition | a | a | a | log(A/s-1)a |
|---|---|---|---|---|
| (GHz) | (K) | (D2) | ||
| (70,7–60,6)E | 133.830 | 26 | 88.5 | –4.04 |
| (70,7–60,6)A | 133.854 | 26 | 88.4 | –4.08 |
| (72,6–62,5)A | 134.694 | 35 | 81.3 | –4.11 |
| (72,6–62,5)E | 134.895 | 35 | 79.7 | –4.12 |
| (72,5–62,4)E | 135.477 | 35 | 79.7 | –4.11 |
| (72,5–62,4)A | 135.685 | 35 | 81.3 | –4.10 |
a From the Jet
Propulsion Laboratory database (Pickett et al. 1998).
| Transition | a | a | a | a | b | CH3CHO/CH3OH | CH3CHO/HDCO |
|---|---|---|---|---|---|---|---|
| (mK) | (km s-1) | (km s-1) | (mK km s-1) | (1012 cm-2) | (10-2) | ||
| 10 K – 70 K | 10 K – 70 K | 10 K – 70 K | |||||
| E-wall | |||||||
| 70,7–60,6 E | 30(3) | +0.4(0.4) | 8.2(1.0) | 264(28) | |||
| 5.0(0.3)–9.2(0.5) | 1.7(0.1)–11.0(0.6) | 1.9(0.2)–0.9(0.1) | |||||
| 70,7–60,6 A | 29(3) | +0.5(0.5) | 8.6(1.3) | 263(31) | |||
| Arch | |||||||
| 70,7–60,6 E | 71(7) | –0.9(0.3) | 9.2(0.8) | 748(54) | |||
| 15.9(0.1)–29.4(0.1) | 0.6(0.1)–4.2(0.1) | 7.6(1.1)–3.7(0.5) | |||||
| 70,7–60,6 A | 76(7) | –0.2(0.9) | 8.0(0.5) | 608(42) | |||
| Head | |||||||
| 70,7–60,6 E | 14(3) | +0.9(0.5) | 8.0(1.1) | 81(13) | |||
| 1.7(0.3)–3.1(0.5) | 0.2(0.1)–0.7(0.1) | 1.5 | |||||
| 70,7–60,6 A | 13(3) | +0.9(0.6) | 5.2(1.6) | 81(13) | |||
a The errors are the gaussian fit uncertainties. The spectral resolution is 4.4 km s-1. b Derived using the (70,7–60,6) E and A emissions.
4 CH3CHO abundance
Figure 1 compares the CH3CHO distribution with that of HDCO (Fontani et al. 2014), showing an excellent agreement, with weak or no emission at the head of the bow B1 structure (called ‘head’). The acetaldehyde emission is concentrated towards the ‘E-wall’ and ‘arch’ zones, namely the part of B1 associated with the most recent shocked material, as probed by the HDCO emission. This is further supported by the fact that the brightest acetaldehyde emission comes where also CH3OH, another dust mantle product, and CH3CN, a 6-atoms COM, emission peak (Codella et al. 2009, Benedettini et al. 2013). Finally, the CH3CHO observed emission is also confined in the low-velocity range ( 8 km s-1) of the L1157-B1 outflow, which is dominated by the extended B1 bow-cavity, according to Lefloch et al. (2012) and Busquet et al. (2014). In summary, similarly to HDCO, CH3CHO traces the extended interface between the shock and the ambient gas, which is chemically enriched by the sputtering of the dust mantles.
To derive the column density, we used the LTE populated and optically thin assumption and best fitted the six detected lines of Tables 1–2. Towards the B1a peak, we find = 9 1013 cm-2, and a rotational temperature of = 15 K, in agreement with the value derived for the molecular cavity from single-dish CO and HDCO measurements (10–70 K; Lefloch et al. 2012, Codella et al. 2012). Assuming rotational temperatures between 10 and 70 K (Table 2) we derived a column density of 5–30 1012 cm-2 in the ‘E-wall’ and ‘arch’ regions, and 2–3 1012 cm-2 in the ‘head’. The size of the regions (at 3 level) is 9 (‘E-wall’), 7 (‘arch’), and 8 (‘head’). An estimate of the CH3CHO abundance can be derived using the the CO column density 1017 cm-2 derived by Lefloch et al. (2012) on a 20 scale. We derived using the CH3CHO spectrum extracted on the same scale and assuming 10–70 K. We find 0.9–1.6 1013 cm-2, which implies a high abundance, 2–3 10-8, similar to what has been measured in hot-corinos ( 2–6 10-8, Cazaux et al. 2003), and larger than that measured in prestellar cores ( 10-11, Vastel et al. 2014) and towards high-mass star forming regions ( 10-11–10-9, Cazaux et al. 2003; Charnley 2004).
5 Gas phase formation of CH3CHO
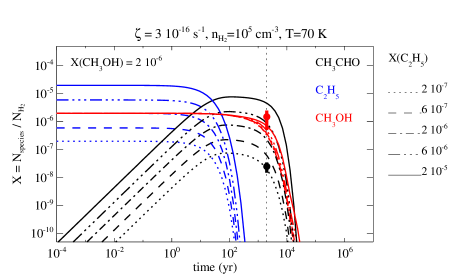
The ratio between and the column density of HDCO, i.e. a molecule which in L1157-B1 is predominantly released by grain mantles (Fontani et al. 2014), is higher (even if we consider the uncertainties, see Table 2) in the ‘arch’ with respect to the ‘E-wall’ by a factor 2–8. Assuming the same grain mantle composition and release mechanism, this difference suggests that, in the ‘arch’, a significative fraction of the observed CH3CHO is formed in the gas phase. In the gas phase, the injection from grain mantles of ethane (C2H6) is expected to drive first C2H5 and successively acetaldehyde (e.g. Charnley 2004; Vasyunin & Herbst 2013): the overlap between the HDCO (Fontani et al. 2014) and CH3CHO emitting regions supports this scenario. We can, therefore, use the measured CH3CHO abundance to constrain the quantity of C2H5 that has to be present in the gas phase in order to produce the observed quantity of CH3CHO. To this end, we use the chemical code ASTROCHEM444http://smaret.github.com/astrochem/, a pseudo time dependent model that follows the evolution of a gas cloud with a fixed temperature and density considering a network of chemical reactions in the gas phase. We followed the same 2-steps procedure adopted in Podio et al. (2014) and Mendoza et al. (2014), to first compute the steady-state abundances in the cloud (i.e. Tkin=10 K, n=104 cm-3, =3 1016 s-1); and then we follow the gas evolution over 2000 yr at the shocked conditions (i.e. Tkin=70 K and n=105 cm-3). To estimate the influence of a possibly larger gas Tkin during the passage of the shock, we also run cases with temperatures up to 1000 K. We adopt the OSU555http://faculty.virginia.edu/ericherb chemical network and assume visual extinction of AV = 10 mag and grain size of 0.1 m. We assume that the abundances of OCS and CO2 are also enhanced by the passage of the shock, namely their abundance in step 2 is = 6 10-5 and = 6 10-6. Similarly, we assume that the abundance of methanol in step 2 is 2 10-6, in agreement with the most recent determination in L1157-B1 by Mendoza et al. (2014). Finally, we varied the C2H5 abundance from 2 10-7 to 2 10-5. As expected, the predicted steady-state abundance of acetaldehyde in the cloud is very low (1.5 10-15). However, once C2H5 is in the gas phase, it rapidly reacts with oxygen forming abundant acetaldehyde on timescale shorter than 100 years (Fig. 3). The CH3CHO abundance reaches the observed value, 2–3 10-8, at the shock age (2000 years), for C2H5 2–6 10-7. Note that we obtain the same result if the gas temperature is K, and a 30% higher value at 1000 K. Figure 3 shows also that the CH3CHO/CH3OH abundance ratio is expected to drop between 103 yr and 104 yr. A different age could, therefore, justify the slightly smaller CH3CHO/CH3OH ratio observed towards the ‘head’ region.
6 Discussion and conclusions
We have shown that acetaldehyde is abundant, 2–3 10-8, in the gas associated with the passage of a shock and enriched by iced species sputtered from grain mantles and injected into the gas phase. The measured acetaldehyde abundance could be consistent with the scenario of oxydation of gaseous hydrocarbons formed in a previous phase and released by the grain mantles. However, the abundance of the C2H5 required to reproduce the measured CH3CHO is very high, 2–6 10-7, namely less than 0.6% the elemental gaseous carbon. There are no observations of C2H5, hence it is impossible to compare with direct estimates of the abundance of this molecule. However, it has been argued that large quantities of frozen methane, of a few % of iced mantle water, is found around the L1527-mm protostar, where the detection of CH3D (Sakai et al. 2012) indicates 0.4–1.5 . This large abundance has been attributed to a low density of the pre-collapse core from which L1527-mm originated (Aikawa et al. 2008). Interestingly, the analysis of the deuteration of water, methanol and formaldehyde in L1157-B1 led Codella et al. (2012) to conclude that also the mantles of L1157-B1 were formed in relatively low density ( 103 cm-3) conditions.
To conclude, in the specific case of L1157-B1, gas phase reactions can produce the observed quantity of acetaldehyde only if a large fraction of carbon, of the order of 0.1%, is locked into iced hydrocarbons. Further observations of the hydrocarbons abundance in L1557-B1 are needed to confirm or dismiss our hypothesis.
Acknowledgments
The authors are grateful to P. Caselli for instructive comments and suggestions, as well as to the IRAM staff for its help in the calibration of the PdBI data. This research has received funding from the European Commission Seventh Framework Programme (FP/2007-2013, n. 283393, RadioNet3), the PRIN INAF 2012 – JEDI, and the Italian Ministero dell’Istruzione, Università e Ricerca through the grant Progetti Premiali 2012 – iALMA. LP has received funding from the European Union Seventh Framework Programme (FP7/2007-2013, n. 267251). CC and BL acknowledge the financial support from the French Space Agency CNES, and RB from Spanish MINECO (FIS2012-32096).
References
- Aikawa et al. (2008) Aikawa Y., Wakelam V., Garrod R.T., & Herbst E. 2008, ApJ 674, 993
- Bachiller & Peréz Gutiérrez (1997) Bachiller R., & Peréz Gutiérrez M. 1997, ApJ 487, L93
- Benedettini et al. (2012) Benedettini, M., Busquet, B., Lefloch, B., et al. 2012, A&A 539, L3
- Bennett et al. (2005) Bennett C.J., Osamira Y., Lebar M.D., & KAiser R.I. 2005, ApJ 634, 968
- Bergin (2013) Bergin, E.A. 2013, XVII Special Courses at the National Observatory of Rio de Janeiro. AIP Conference Proceedings, arXiv:1309.4729
- Blake et al. (1986) Blake G.A., Masson C.R., Phillips T.G., & Sutton E.C. 1986, ApJS 60, 357
- Busquet et al. (2014) Busquet G., Lefloch B., Benedettini, M., et al. 2014, A&A 561, 120
- Benedettini et al. (2013) Benedettini, M., Viti, S., Codella, C., et al. 2013, MNRAS 436, 179
- Caselli & Ceccarelli (2012) Caselli, P. & Ceccarelli, C. 2012, A&ARv, 20, 56
- Cazaux et al. (2003) Cazaux S., Tielens A.G.G.M., Ceccarelli C., et al. 2003, ApJ 593, L51
- Ceccarelli et al. (2010) Ceccarelli C., Bacmann A., Boogert A., et al. 2010, A&A 521, L22
- Charnley (2004) Charnley S.B., 2004, Adv. Space Res. 33, 23
- Charnley et al. (1992) Charnley S.B., Tielens A.G.G.M., & Millar T.J. 1992, ApJ 399, L71
- Codella et al. (2009) Codella C., Benedettini M., Beltrán M.T., et al. 2009, A&A 507, L25
- Codella et al. (2012) Codella C., Ceccarelli C., Lefloch B., et al. 2012, ApJ, 757, L9
- Fontani et al. (2011) Fontani F., Codella C., Ceccarelli C., et al. 2014, ApJ 788, L43
- Garrod & Herbst (2006) Garrod R.T., & Herbst E. 2006, A&A 457, 927
- Garrod et al. (2007) Garrod R.T., Wakelam V., & Herbst E. 2007, A&A 467, 1103
- Garrod et al. (2008) Garrod R.T., Weaver S.L.W., & Herbst E. 2008, ApJ 682, 283
- Garrod et al. (2009) Garrod R.T., Vasyunin A.I., Semenov D.A., Wiebe D.S., & Henning Th. 2009, ApJ 700, L43
- Gueth et al. (1996) Gueth F., Guilloteau S., & Bachiller R. 1996, A&A 307, 891
- Gueth et al. (1998) Gueth F., Guilloteau S., & Bachiller R. 1998, A&A 333, 287
- Herbst & van Dishoeck (2009) Herbst E., & van Dishoeck E.F. 2009, ARA&A 47, 427
- Jaber et al. (2014) Jaber A.A., Ceccarelli C., Kahane C., & Caux E. 2014, ApJ 791, 29
- Lefloch et al. (2012) Lefloch B., Cabrit S., Busquet G., et al. 2012, ApJ, 757, L25
- Maret et al. (2011) Maret S., Hily-Blant P., Pety J., et al., A&A 526, A47
- Öberg et al. (2010) Öberg K.I., Bottinelli S., Jørgensen J.K., van Dishoeck E.F. 2010, ApJ 716, 825
- Occhiogrosso et al. (2010) Occhiogrosso A., Vasyunin A., Herbst E., et al. 2014, A&A 564, 123
- Pickett et al. (1998) Pickett H.M., Poynter R.L., Cohen E.A., et al. 1998, J. Quant. Spectrosc. & Rad. Transfer 60, 883
- Podio et al. (2014) Podio L., Lefloch B., Ceccarelli C., Codella C., & Bachiller R. 2014, A&A 565, 64
- Requena-Torres et al. (2006) Requena-Torres M.A.; Martín-Pintado J., Rodríguez-Franco A., et al. 2006, A&A 455, 971
- Rawlings et al. (2013) Rawlings J.M.C., Williams D.A., Viti S., & Cecchi-Pestellini C. 2013, MNRAS 430, 264
- Sakai et al. (2012) Sakai N., Shirley Y.L., Sakai T., et al. 2012, ApJ 758, L4
- Taquet et al. (2012) Taquet, V., Ceccarelli, C., & Kahane, C. 2012, ApJ 784, L3
- Vastel et al. (2014) Vastel C., Ceccarelli C., Lefloch B., & Bachiller R. 2014, ApJ 795, L2
- Vasyunin et al. (2013) Vasyunin A.I., & Herbst E. 2013, ApJ 769, 34