Spatial Variation of the Correlated Color Temperature of Lightning Channel
Abstract
In present work, we propose the analysis method of lightning based on the color analysis. We analyzed the digital still images in which the cloud-to-ground (CG) and intracloud (IC) lightning flashes are shown. Applying some digital image processing techniques, we extracted lightning channels. Then, the correlated color temperature (CCT) of the extracted lightning channels was obtained by mapping digital pixels of the extracted lightning channels to CIE 1931 -chromaticity diagram. Our results indicate that the CCT of lightning channels changes spatially. Furthermore, it suggests that the energy of lightning channels changes spatially.
keywords:
Color analysis, Lightning, Lightning channel, Correlated color temperature1 Introduction
Lightning is very high-speed and very large natural phenomenon. In general, we cannot predicate when and where it occurs. Also, it is difficult that we directly observe properties of lightning. From these reason, lightning is indirectly observed by using a electric field sensor, a optical sensor, or digital still/video camera etc. It can be considered that from now on, performance of these instruments recording lightning will be higher. In recent years, the studies of lightning using the high-performance and high speed camera have increased [1, 2, 3]. These results provide new insights to lightning researchers. In addition, it is also considered that developing the analytical methods is necessary. In this paper we propose the new analytical method of lightning based on the color analysis technique.
We analyzed the lightning channel based on the color analysis. First of all, we extracted lightning channels in digital still images and then performed the color analysis of the extracted lightning channels, where we used OpenCV library [4]. Our results show that the CCT of lightning channels changes spatially. It is considered that if the CCT of a lightning channel is higher than other channels, the energy of the lightning channel also higher than the other. Thus, since the CCT of lightning channels changes spatially, the energy of lightning also changes spatially.
2 Lightning images and extraction of lightning channel
2.1 Lightning images
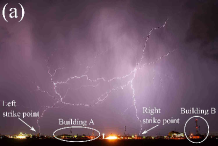
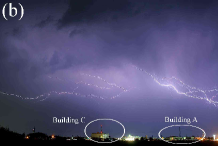
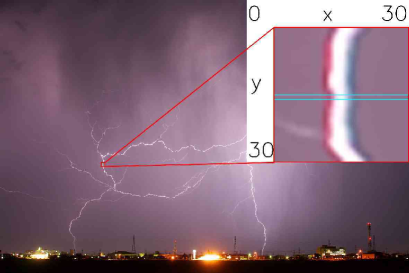
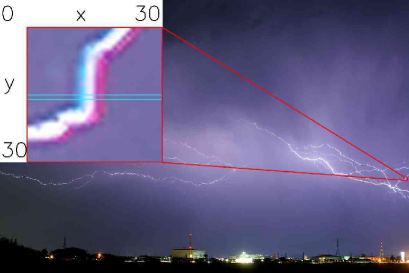
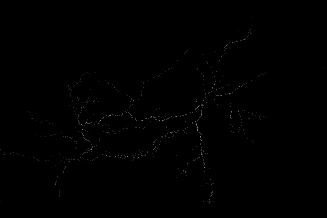
We used two lightning flash images shown in Fig. 1 [5]. The images were captured in Chikusei City, Ibaraki Prefecture, Japan, on October 27th, 2008. The images were saved as uncompressed files and optical filters, e.g. ND filters, did not be used. For this reason, it is considered that the information deteriotation on the digital images is minimized. Therefore the lightning flash images used in this work can be used to analyze colors of the lightning channels.
2.2 Extraction of lightning channels
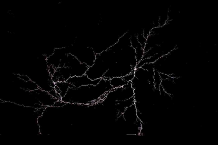
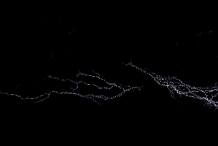
We have to extract lighting channels from the lightning flash images (Fig. 1). We can see many unwanted parts for the color analysis (e.g. buildings, artificial light sources, and cloud luminescence accompany with a lightning flash in the images. These unwanted parts are unnecessary to analyze colors of the lightning channels. Thus we extracted the lightning channels in the images by applying digital image processing techniques. The extracted lightning channels are shown in Fig. 2.
The extraction method is based on masking of digital image processing. The extraction procedure is as follows: (1)Inpainting, (2)Smoothing (blur), (3)Sobel edge detection, (4)Thresholding, (5)Smoothing (median filter), (6)Filling process, (7)Thinning process, and (8)Masking. We run in turn the image processing above using OpenCV library [4]. Steps (6) and (7) in the extraction procedure are created by our work.
3 Reduction technique of chromatic aberration
In this section we explain a reduction tequnique of chromatic aberration in the lightning flash images. Usually, in a image created by the optical system, chromatic aberration is unavoidable. When we analyze lightning channels on digital images, the chromatic aberration should be removed from the images. Figs. 3 and 4 show the example of the chromatic aberration on the lightning channel in the CG and IC flash images. The insets on Figs. 3 and 4 show the enlarged lightning channel, which have the size pixels. Along the lightning channels in the insets (Figs. 3 and 4), the red and blue color is running. This spread is the chromatic aberration. In order to see the chromatic aberration in detail, as an example we plot the pixel value on the line between two pale blue lines in the insets (see Figs. 3 (Right) and 4 (Right)). In Figs. 3 (Right) and 4 (Right), the vertical axis denotes the pixel value which have the range – ( levels), and the -axis denotes the line between the two pale blue lines. From the variation of the pixel values, we can see that there is the difference of the spread of the pixel value for the R-, G-, and B-components. This spreads attribut to the chromatic aberration. The chromatic aberration is unnecessary to analyze the color of the lightning channel.
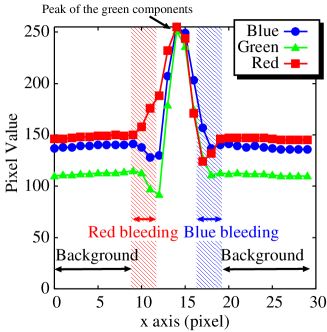
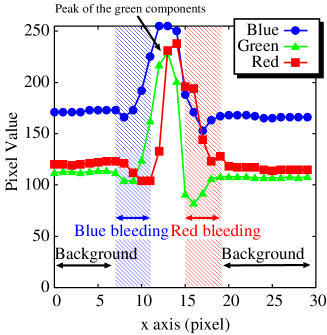
Usually, in optics, it is well known that the green light has a smaller dispersion of the chromatic aberration than the red and blue light. This fact indicates that, in Figs. 3 (Right) and 4 (Right), the effect of the chromatic aberration near the peak of the green is smaller. Hence, in order to eliminate the chromatic aberration, we created Algorithm 1.
This algorithm extract the RGB components (, , ) at the peak of the G-component of lightning channel, namely, the RGB conponents at the part of the smaller effect of the chromatic aberration. Figs. 5 and 6 show images applied the Algorithm 1 to the extracted lightning channels shown in Fig. 2 (a) and (b). The left side of Figs. 5 and 6 containes the saturated pixels reaching , but the right side of Figs. 5 and 6 does not contain it.


4 Variation of the correlated color temperature of the lightning channel
We have studied the variation of the CCT of the lightning channels shown in Figs. 5 and 6. As indicated by Uman and Orville [6], lightning opacity is thin. That is, lightning is not the Planckian radiator. Therefore, we cannot identify the temperature of the lightning channel by considering the color temperature. However the color of the light emitted from the lightning is meaningful, since the color contains the information in the interior of lightning channels. Thus we draw attention to the CCT of the lightning channels.
4.1 Correlated color temperature
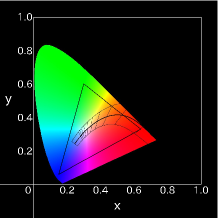
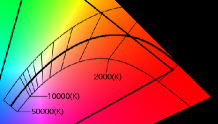
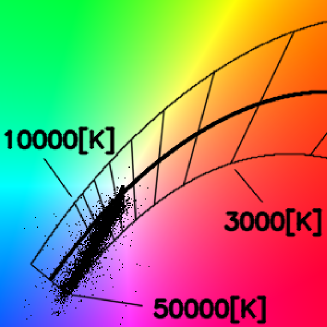
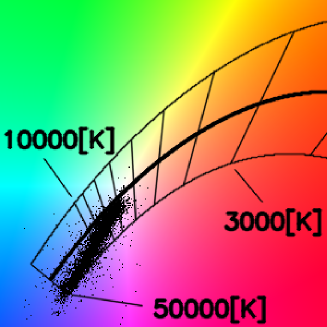
We describe conversion methods from sRGB color space to the CIE XYZ color space. The color space of the lightning flash images (Fig. 1) is sRGB[7]. The CCT is discussed on the -chromaticity diagram. Fig. 7 (left) shows the CIE 1931 -chromaticity diagram in which the sRGB color triangle and the Planckian locus are depicted. Fig. 7 (right) shows a enlarged figure near the Planckian locus in which the Planckian locus (thick line), the equal uv lines of uv along with the Planckian locus, and the isotemperature lines (thin lines) acrossing with the Planckian locus are depicted. The length of the isotemperature lines is uv. The CCT is generally discussed in the range uv.
To analyze the lightning channels (Figs. 5 and 6) based on the CCT, we have converted the sRGB color space to the CIE XYZ color space. Here are the conversion method from the sRGB color space to the CIE XYZ color space [7].
We first divid the nonlinear components, , and , by and then we obtain the normalized values,
Then the normalized nonlinear components, , and , are transformed to linear components, , and , as follows :
If , , , then
else if , , ,
The linear components , and are converted to the CIE XYZ system by the equation [8]:
| (1) |
Using the tristimulus value and the chromaticity coordinates on the -chromaticity diagram are expressed by
| (2) |
4.2 Correlated color temperature of the lightning channels
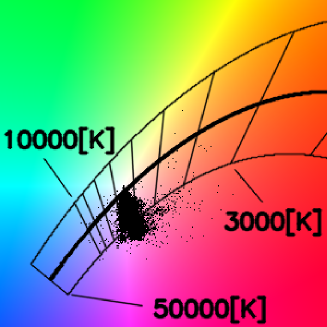
Applying the conversion method mentioned above, we obtained the CCT of the lightning channel. Figs. 8 and 9 denote the projected points for the CG and IC lightning channels shown in Figs. 5 and 6, respectively. In Figs. 8 and 9, the Planckian locus (thick line), the isotemperature lines crossing the Planckian locus and the equal uv lines of uv are also depicted. From Figs. 8 and 9, it is found that many points distribute in the range uv, but there are also points distributing to the outside of the range uv. Since the CCT is discussed in the range uv, in this work we focus only on the points in the range uv. The projected points for the CG lightning is mainly concentrated in the narrow CCT range, about – [K], but that for the IC lightning distribute in the wide range: about – [K].
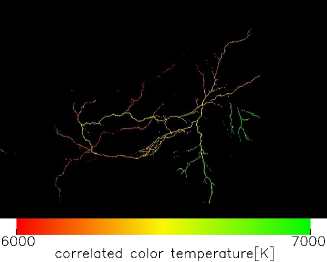
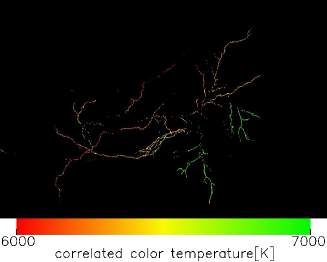
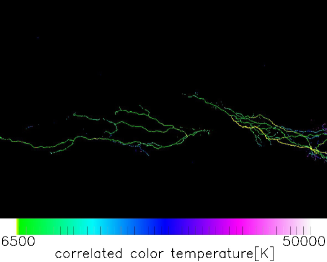
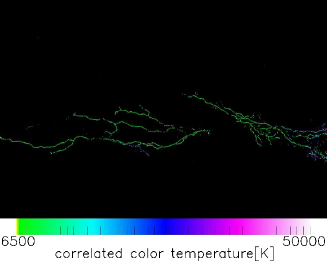
In order to look at the spatial variation of the CCT of the lightning channel, we remapped the projected points on CIE 1931 -chromaticity diagram shown in Figs. 8 and 9 to the former -dimensional images (see Figs. 10 and 11) inheriting the CCT. The projected points within the equal uv lines of uv were remapped, but the outside points of the equal uv lines of uv were eliminated. Furthermore in Figs. 10 and 11, to emphasize small variation of the CCT, we narrowed the CCT range to – [K] for the CG flash and to – [K] for the IC flash. The color bars in Figs. 10 and 11 indicate the CCT. The ranges of the color bar are – [K] for the CG flash and – [K] for the IC flash. Figs. 10 (left) and 11 (left) containe the saturated pixels (), but Figs. 10 (right) and 11 (right) do not contain. In Figs. 10 and 11, the lightning channel was thickened to pixels, because the extracted lightning channel is very thin, namely confirming the variation of the CCT is too difficult. Notice that the color on the color bar is to emphasize the variation of the CCT, and does not coincide with the actual color as to the color temperature of the Planckian radiator.

5 Discussion
5.1 Identification of the lightning events in the CG and IC lightning images
| ID | Time (JST) | Lightning location | Polarity | Current | CG/IC | |
|---|---|---|---|---|---|---|
| (ns) | Latitude | Longitude | (kA) | |||
| 1 | 21:17:6:591327450 | 36.3683∘N | 139.9669∘E | 6 | CG | |
| 2 | 21:18:27:558320409 | 36.3536∘N | 139.9745∘E | 13 | IC | |
| 3 | 21:18:27:589571036 | 36.3428∘N | 139.9891∘E | 28 | CG | |
| 4 | 21:18:27:735903133 | 36.328∘N | 139.9989∘E | 9 | CG | |
| 5 | 21:20:40:116117691 | 36.3649∘N | 139.9905∘E | 68 | CG | |
| 6 | 21:20:40:148843700 | 36.3569∘N | 139.9951∘E | 12 | CG | |
| 7 | 21:21:19:214825550 | 36.3473∘N | 139.978∘E | 7 | CG | |
| 8 | 21:22:12:826584983 | 36.3561∘N | 139.9834∘E | 31 | CG | |
| 9 | 21:22:12:849340650 | 36.3965∘N | 140.0426∘E | 13 | CG | |
| 10 | 21:23:2:212293887 | 36.334∘N | 140.0356∘E | 14 | CG | |
| 11 | 21:23:58:705277763 | 36.3595∘N | 140.0087∘E | 11 | CG | |
| 12 | 21:24:10:326889443 | 36.3608∘N | 139.98∘E | 8 | IC | |
| 13 | 21:25:18:83780450 | 36.3327∘N | 140.052∘E | 15 | CG | |
| 14 | 21:25:18:83784281 | 36.3583∘N | 140.0108∘E | 21 | CG | |
| 15 | 21:25:18:108304626 | 36.3747∘N | 139.9733∘E | 6 | CG | |
| 16 | 21:25:39:614264250 | 36.3662∘N | 139.9693∘E | 7 | IC | |
| 17 | 21:28:9:397386500 | 36.3708∘N | 139.9782∘E | 19 | IC | |
| 18 | 21:28:9:418860575 | 36.3836∘N | 140.077∘E | 5 | CG | |
| 19 | 21:29:41:912989800 | 36.3322∘N | 139.9863∘E | 5 | IC | |
| 20 | 21:32:15:530283215 | 36.316∘N | 140.0776∘E | 35 | CG | |
| 21 | 21:32:15:603968541 | 36.376∘N | 140.0589∘E | 11 | CG | |
| 22 | 21:33:12:666414500 | 36.3266∘N | 140.0708∘E | 14 | CG | |
| 23 | 21:33:12:667979150 | 36.3639∘N | 140.032∘E | 7 | IC | |
| 24 | 21:34:0:937847200 | 36.3565∘N | 140.0204∘E | 11 | IC | |
| 25 | 21:41:58:745186600 | 36.3424∘N | 140.0718∘E | 8 | CG | |
| 26 | 21:44:16:176844671 | 36.338∘N | 140.0767∘E | 43 | CG | |
| 27 | 21:44:16:187369400 | 36.3374∘N | 140.1224∘E | 7 | CG | |
| 28 | 21:46:29:646441950 | 36.3721∘N | 140.0536∘E | 5 | IC | |
| 29 | 21:46:29:847440271 | 36.4008∘N | 140.0779∘E | 31 | CG | |
| 30 | 22:3:21:489762200 | 36.3375∘N | 140.1234∘E | 7 | IC | |
We have identified the strike points of the CG lightning image (Fig. 1 (Left)) using lightning data in Table 1. The data in Table 1 denote the lightning events in 9:15–10:15 in the investigation area in Chikusei City, Ibaraki Prefecture, Japan, on October 27th, 2008. The investigation area is km km square and the center of investigation area is located at lat. N and long. E. The data in Table 1 were commercially provided by Franklin Japan Corporation. The provided data were observed by the Japan Lightning Detection Network (JLDN) operated by Franklin Japan Corporation. The detection efficiency of the JLDN is greater than for CG flashes and for IC flashes. The median location accuracy is better than km. The data in Table 1 include ID numbers, time (JST), the location (lat. and long.), the polarity (+/-), the estimated peak current (kA), and CG/IC index. The locations of lightning events are given by World Geodetic System 1984 (WGS84) and latitude and longitude are given in decimal degrees. The time in Table 1 is based on the Japan Standard Time (JST), where using Coordinated Universal Time (UTC), JST is expressed by .
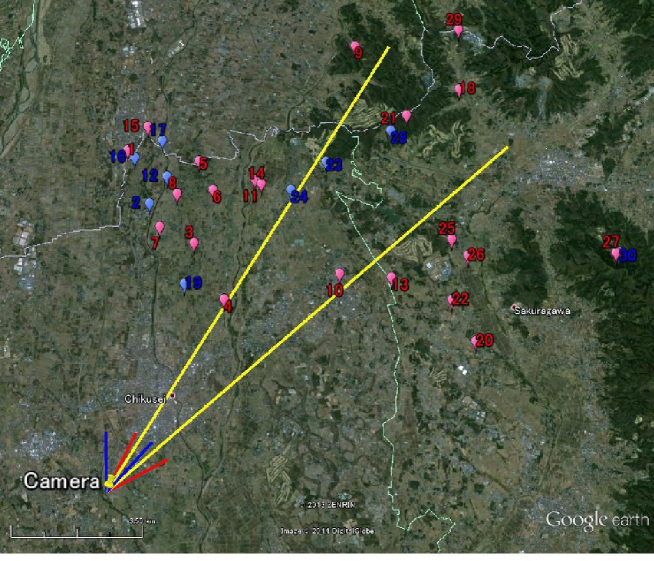
We have investigated the geographic locations of the lightning events in Table 1. Fig. 12 shows the locations of the CG and IC lightning events in Table 1 and the photographing location. In Fig. 12 the CG and IC lightning events are denoted by the red and blue balloons, respectively. The yellow pushpin indicates the photographing location. Approximate directions of the two lightning strike points in Fig. 1 (Left) are denoted by the yellow lines. The red lines near the photographing location (yellow pushpin) denote the field of view of the CG flash image (Fig. 1 (Left)). The blue lines near the photographing location (yellow pushpin) are the field of view of the IC flash image (Fig. 1 (Right)). In Fig. 12, there are some candidates of the two strike points in the CG flash image (Fig. 1 (Left)) along the two yellow lines. Therefore it is difficult to identify the lightning strike points using only the geographical location.
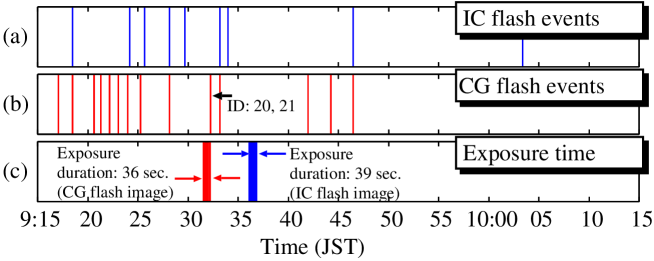
We look at the time of the lightning events in Table 1. We have depicted to Fig. 13 the schematic illustration of the time with respect to the lightning events and the exposure duration of the CG and IC flash images (Fig. 1 (Left) and (Right)). Fig. 13 (a) shows the individual times of the IC flash events in Table 1 and there are IC flash events in : – : JST. Fig. 13 (b) shows the individual times of the CG flash events in Table 1. In Fig. 13 (b), there are lightning events in : – : JST, while it seems that there are lightning events. Namely, seven CG flash events are overlapping because these events occurred nearly simultaneously. Fig. 13 (c) shows the exposure duration for the CG and IC flash images in Fig. 1 (Left) and (Right). The beginning time of the exposure is :: JST for the CG flash and is :: JST for the IC flash. The exposure duration for the CG and IC flashes are and second, respectively. By comparing Fig.13 (b) and (c), it follows that the flash events, ID: and , are most appropriate to the CG flash events of Fig. 1 (Left) where the ID numbers are shown in Table 1. Thus we determined that the lightning event of the ID: is the right side of the lightning strikes in Fig. 1 (Left). Similarly the lightning event of the ID: is the left side of the lightning strikes in Fig. 1 (Left).
On the other hand, we cannot identify the IC flash shown in Fig. 1 (Right). In Fig. 13 (a), there are no flash events near the time :: JST which is the beginning time of the exposure for the IC lightning events shown in Fig. 1 (Left). In the case of IC lightning, the detection efficiency of JLDN is about . It is considered that the IC flash event in Fig. 1 (Right) could not be detected.
5.2 Correlated color temperature and energy of the lightning channel
We discuss both the CCT and related energy of the lightning channel removed the saturated pixels reaching . In general, it can be considered that the saturated part of the lightning channel have higher energy. But we cannot know the accurate information for the saturated pixels of the lightning image. Hence, we study the CCT and the related energy of the lightning channel removing the saturated part, namely we used Figs. 10 (right) and 11 (right).
We think that the CCT is related to the energy of the lightning channel. Usually, the spectra of the short wavelength increase with increasing the CCT. Thus it can be considered that lightning channels having higher CCT have the higher energy than the other channels. As for the CCT of the CG lightning channel (Fig. 10 (right)), we can find that the CCT around the right strike channel (ID: ) is relatively higher than the other channel. The CCT around the right strike channel (ID: ) distribute in about – K and this CCT are displayed gradually by using the colors from yellow to green. The CCT around the left strike channel (ID: ) and other branch channels distribute in about – K and are displayed gradually by using the colors from red to yellow. As stated above, the right strike channel (ID: ) have higher CCT than the others. Thus we consider that in Fig. 10 (right), the right strike channel (ID: ) have higher energy than the left strike channel and other channels. Moreover, from Table 1, the currents of the left and right strick channels (ID: and ) are kA and kA. Namely, . This means that the energy of the lightning channel having larger current is higher than that having the lower current.
From Fig. 11 (right), which was removed the saturated pixels, it is found that the CCT of the IC lightning channel mainly distribute in the range about – K and is gradually displayed by the colors (green – cyan). We can also find that there are the slight pixels in about – K gradually displayed by the colors from cyan to blue to purple.
From Fig. 10 and 11, we found that the CCT of the lightning channel changes spatially. This also means that the energy of the lightning channel changes spatially. Totally, the CCT on the IC lightning channel is higher than the CG lightning channels. This indicate that the energy of the IC lightning channel shown in Fig.1 (Right) was higher than the CG lightning channel shown in Fig.1 (Left).
We add the discussion for the saturated pixels on the lightning channel. In Fig. 10 (left) and 11 (left) the yellow channels having 6500 K (disappear in Fig. 10 (right) and 11 (right), respectively) are the saturated channels. The corresponding channels in the original images shown in Fig. 1 (Left) and (Right) are seen more brightly. It is reported by Idone and Orville [9], Gomes and Cooray [10], Wang et al. [11], and Zhou et al. [12] that there exists a strong positive correlation between the channel current and light intensity of lightning channel. For the above reason, it can be considered that the current on the saturated part is high, although the details on the saturated part cannot be known. It can be summarized that the bright channel on the saturated part have high current and high energy. Furthermore, Rubenstei et al.[13] and Rakov et al.[14] reported that there is a positive linear correlation between the peak current and the leader electric field change. It is considered that the electric field changes around the bright channel having the saturated pixels is large.
6 Conclusions
From Fig.10 and 11, we have found that the CCT of the lightning channel changes spatially. This also means that the energy of the lightning channel changes spatially. Since the lightning images (Fig.1 (Left) and (Right)) were captured by exposing the image sensor, the amount of light captured by the image sensors in the still camera was integrated in the exposure time second for the CG flash and second for the IC flash. For this reason, we did not analyze the temporal variation. If high-speed video camera is used, the more details of the spatio-temporal variation of both the CCT and energy of the lightning channel will be obtained.
7 Acknowledgements
The authors would like to gratefully acknowledge storm chaser Yutaka Aoki for providing the digital still images of the CG and IC flash and would also need to acknowledge Franklin Japan Corporation that commercially provided JLDN data. The authors would like to thank Yu Iida and Singo Sakihama for valuable discussion.
References
- [1] Tom A. Warner, Observations of simultaneous upward lightning leaders from multiple tall structures, Atmos. Res. 117 (2011) 45–54.
- [2] Vladislav Mazur, Lothar H. Ruhnke, Tom A. Warner, Richard E. Orville, Recoil leader formation and development, J. Electrost 71 (2013) 763–768.
- [3] J. Montanyà, O. A. Van der Velde, V. March, D. Romero, G. Sola, N. Pineda, High-speed video of lightning and x-ray pulses during the – observation campaigns in northeastern spain, Atmos. Res. 117 (2011) 91–98.
- [4] OpenCV ver., Open Source Computer Vision Library, http://www.sourcefoge.net/projects/opencvlibrary/ (downloaded in 2013).
- [5] Yutaka Aoki, The lightning images were provided by storm chaser Yutaka Aoki. (captured on October 27th, 2008, provided in November 2012).
- [6] M. A. Uman and R. E. Orville, The opacity of lightning, J. Geophys. Res. 70 (1965) 5491–5497.
- [7] IEC 61966-2-1, Multimedia systems and equipment - Colour measurements and management - Part 2-1: Colour management - Default RGB color space - sRGB (International Electrotechnical Commission, Geneva, 1999-10.
- [8] Recommendation ITU-R BT. 709-5 (04/2002), Parameter values for the HDTV standards for production and international programme exchange. URL:http://www.itu.int/dms_pubrec/itu-r/rec/bt/R-REC-BT.709-5-200204-I!!PDF-E.pdf (last accessed on Dec 25, 2014).
- [9] V. P. Idone, R. E. Orville, Correlated peak relative light intensity and peak current in triggered lightning subsequent return strokes, J. Geophys. Res. 90 (1985) 6159–6164.
- [10] C. Gomes and V. Cooray, Correlation between the optical signatures and current waveforms of long sparks: applications in lightning research, J. Electrost 43 (1998) 267–274.
- [11] D. Wang, N. Takagi, T. Watanabe, V. A. Rakov, M. A. Uman, K. J. Rambo, M. V. Stapleton, A comparison of channel-base currents and optical signals for rocket-triggered lightning strokes, Atmos. Res. 76 (2005) 412 – 422.
- [12] E. Zhou, W. Lu, Y. Zhang, B. Zhu, D. Zheng, Y. Zhang, Correlation analysis between the channel current and luminosity of initial continuous and continuing current processes in an artificially triggered lightning flash, Atmos. Res. 129–130 (2013) 79–89.
- [13] M. Rubenstein, F. Rachidi, M. A. Uman, R. Thottappillil, V. A. Rakov, and C. A. Nucci, Characterization of vertical electric fields m and m from triggered lightning, J. Geophys. Res. 100 (1995) pages 8863–8872.
- [14] V. A. Rakov, M. A. Uman, K. J. Rambo, M. I. Fernandez, R. J. Fisher, G. H. Schnetzer, R. Thottappillil, A. Eybert-Berard, J. P. Berlandis, P. Lalande, A. Bonamy, P. Laroche, and A. Bondiou-Clergerie, New insights into lightning processes gained from triggered-lightning experiments in Florida and Alabama, J. Geophys. Res. 103 (1998) pages 14117–14130.