Band Structure and Terahertz Optical Conductivity of Transition Metal Oxides: Theory and Application to CaRuO3
Abstract
Density functional plus dynamical mean field calculations are used to show that in transition metal oxides, rotational and tilting (GdFeO3-type) distortions of the ideal cubic perovskite structure produce a multiplicity of low-energy optical transitions which affect the conductivity down to frequencies of the order of or mV (terahertz regime), mimicking non-Fermi-liquid effects even in systems with a strictly Fermi-liquid self-energy. For CaRuO3, a material whose measured electromagnetic response in the terahertz frequency regime has been interpreted as evidence for non-Fermi-liquid physics, the combination of these band structure effects and a renormalized Fermi-liquid self-energy accounts for the low frequency optical response which had previously been regarded as a signature of exotic physics. Signatures of deviations from Fermi-liquid behavior at higher frequencies ( meV) are discussed.
Fermi-liquid theory provides the canonical picture of metals; the observation of deviations from Fermi-liquid behavior is thus of intense interest as a potential indication of novel physics. The defining feature of a Fermi-liquid is the existence of electronlike quasiparticles whose low temperature and frequency properties are characterized by an effective mass that is independent of frequency and a scattering rate that is parametrically smaller than frequency or temperature (typically varying as or ). The perovskite ruthenate CaRuO3 has been the subject of considerable attention in this context because its frequency-dependent conductivity has been reported Lee02; Kamal06 to vary as a power of frequency with an exponent less than unity. The anomalous dependence extends to very low frequencies of the order of THz ( meV) Kamal06, and this has been interpreted as indicating a breakdown of Fermi-liquid physics in this material. Similar interpretations have been given of optical data in SrRuO3 Kostic98. On the other hand, recent dc transport measurements in CaRuO3 found quantum oscillations and a quadratic temperature dependence of the resistivity Schneider14 below K – characteristic of a Fermi-liquid. The link between the frequency-dependent and dc transport measurements has not been established and a model accounting for the optical conductivity is not known.
In this Letter we present density functional theory (DFT) plus dynamical mean field theory (DMFT) calculations which indicate that band structure effects associated with octahedral rotations of the ideal perovskite crystal structure produce optically active interband transitions that contribute to the conductivity on scales as low as THz ( meV) and can mimic non-Fermi-liquid physics. As an application we show that the observed terahertz conductivity of CaRuO3 is consistent with Fermi-liquid-like quasiparticles and quantify the departures from Fermi-liquid physics that occur at higher scales.
The standard arguments relating optical conductivity and electron self-energy may conveniently be framed in terms of an approximation due to Allen Allen71; Allen04; Basov11:
| (1) |
Here is the Fermi function and the ⋆ denotes complex conjugation. Equation (7) is expected to be reasonable when interband transitions are neglected.
In a simple Drude metal, , with representing the time between scatterings of electrons off of impurities. Use of this self-energy in Eq. (7) yields the familiar Drude conductivity . Use of the Fermi-liquid form yields a conductivity with a characteristic scaling form Berthod13 (see also Refs. Stricker14; Chubukov-2012) that we will refer to as the single-band Fermi-liquid (SBFL) conductivity. If the self-energy takes the non-Fermi-liquid form with , one has at low frequency, so that the term proportional to in the denominator of the argument of the integral in Eq. (7) may be neglected. A scaling analysis of Eq. (7) then shows that for small , , with the divergence cut off by temperature.
We compare expectations based on Eq. (7) to realistic calculations of the frequency-dependent conductivity of CaRuO3. This material crystallizes in a GdFeO3-distorted version of the ideal cubic perovskite structure. In the latter, there are three near-Fermi-surface bands derived from the three states. The GdFeO3-distorted structure has four Ru ions in the unit cell, leading to 12 -derived near-Fermi-surface bands. The -derived bands are the eigenvalues of a Hamiltonian matrix with being a wave vector in the first Brillouin zone. is obtained by using maximally localized Wannier function (MLWF) Marzari97; Souza01 techniques to project the Kohn-Sham Hamiltonian found from a spin-unpolarized DFT band calculation onto the near-Fermi-surface states. The effects of electron-electron interactions are encoded in the self-energy , also a matrix, which we compute by applying single-site DMFT to the corresponding to the experimental structure of CaRuO3 with standard Slater-Kanamori interactions parametrized by eV and eV (see the Supplementary Material supp for details of DFT and DMFT calculations). Electron propagation in the -derived bands is thus described by the matrix Green function ( for the cubic structure and for the experimental one)
| (2) |
For the situations we consider there are no vertex corrections to the current operator in the single-site dynamical mean field approximation, essentially because no on-site optical transitions are allowed (see the Supplementary Material supp for a more detailed discussion and also Ref. Khurana90 for the single-band case), so the conductivity becomes
The matrix current operator is derived in a standard way from (note that in systems with more than one atom per unit cell, care must be taken to use a basis in which each atom acquires the Peierls phase appropriate to its physical position within the unit cell Wang11; Tomczak09). The trace is over momentum and band indices. In our calculations, the four-dimensional integral (in frequency and momentum space) is performed using a Gaussian quadrature with points in each direction. The Allen formula [Eq. (7)] may be derived from Eq. (Band Structure and Terahertz Optical Conductivity of Transition Metal Oxides: Theory and Application to CaRuO3) if the matrices are diagonal (no interband transitions) and when the transport function (i.e. the density of states weighted by current matrix elements) depends weakly on energy.
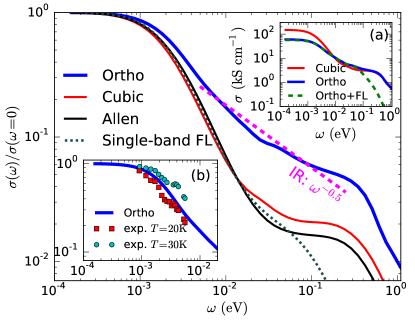
The main panel of Fig. 1 presents the normalized conductivity calculated using Eq. (Band Structure and Terahertz Optical Conductivity of Transition Metal Oxides: Theory and Application to CaRuO3) with , and appropriate to the experimental structure of CaRuO3. The conductivity in the midinfrared regime () appears to vary as a power law with being in the range , similar to the power law reported experimentally Lee02. The lower inset compares the calculated conductivity to recent measurements Schneider14, which come from samples with significantly lower impurity scattering than samples studied earlier Kamal06. The quantitative correspondence between calculation and data is good.
Also shown in Fig. 1 are the conductivities obtained from Eq. (Band Structure and Terahertz Optical Conductivity of Transition Metal Oxides: Theory and Application to CaRuO3) using the and corresponding to the ideal cubic structure (while keeping the same self-energies as for the real structure) and by using the Allen formula [Eq. (7)] again for the same self-energies. (The Allen formula results are obtained as an equally weighted sum over three terms, one for each diagonal entry in the self-energy matrix). In the terahertz and subterahertz regime ( meV) the cubic or Allen results exhibit a much more rapid roll-off from the dc plateau than does the experimental structure conductivity, while in the mid-IR ( meV) regime the cubic or Allen results exhibit an approximate plateau if the DMFT self-energy is used.
As the self-energies used in the cubic and orthorhombic calculations are exactly the same, the difference between the results is not a self-energy effect and does not correspond to non-Fermi-liquid physics. To probe the effect of the self-energy, we also display in the main panel the SBFL result (with parameters determined from a fit to the DMFT self-energy in Fig. 3), and in the inset of Fig. 3(a) the conductivity obtained when using a Fermi-liquid self-energy and the realistic orthorhombic structure. We see that the choice of self-energy hardly influences the low frequency result; it is only at frequencies higher than meV that the choice of self-energy significantly influences the calculation.
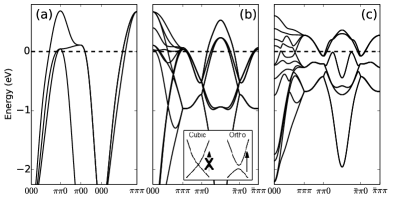
The key approximation of both the Allen and SBFL formulas is the neglect of interband transitions. The difference between these approximations and the calculation for the experimental structure thus arises from optically active interband transitions, which are seen to affect the conductivity down to scales as low as THz. To explicate the origin of these transitions, we present in Fig. 2 our calculated band structures. The left panel shows the near-Fermi-surface bands found for the ideal cubic structure. Direct interband transitions between the three bands are possible in principle; however, the different orbital symmetry of the different bands means that the matrix elements are small, especially in the lower frequency regime, so that the cubic and Allen results are similar. At higher energies, interband transitions have some effect in the cubic structure as well.
The middle panel shows the bands of the cubic structure, folded into the Brillouin zone of the experimental structure. The backfolding creates the possibility of many low-lying interband transitions, but in the cubic structure these transitions are not optically active, as they do not correspond to zero-momentum transfer. The right panel shows the band structure obtained for the experimental structure. The octahedral rotations reduce the overlap between states on different sites, causing a band narrowing from to eV visible, for example, in the energies near the point and flattening the dispersion in the near-Fermi-surface region. The zero frequency conductivity of the orthorhombic case is thus smaller (by a factor of ) than the cubic result (see the inset in Fig. 1). The rotations also allow matrix elements between nearby states, opening additional minigaps where the cubic bands cross, further flattening the bands at the Fermi level and, crucially, activating optical matrix elements between the backfolded bands. Starting at meV, these become important, changing the functional form of the conductivity. At high frequencies the experimental and cubic structure conductivities become very similar, as the small gaps are unimportant.
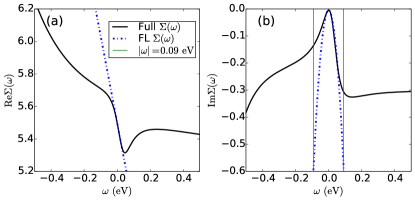
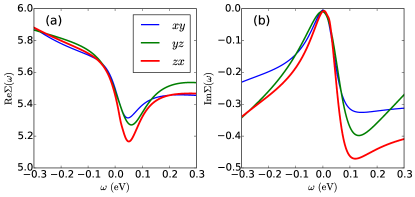
To study the nature of the non-Fermi-liquid effects in the conductivity of CaRuO3 we present in Fig. 3 a plot of the real and imaginary parts of the self-energy calculated for one of the three orbitals (the self-energies associated with the other two are similar). Also shown is a fit of the self-energy to the functional form
| (4) |
Here is a dimensionless constant giving the mass renormalization , is the temperature and the characteristic energy sets the scale of the scattering rate. The parameter (Fermi-liquid) for the plotted orbital but about to for the other two perhaps because the coherence temperature is not quite reached. From Fig. 3 we see that at very low frequencies meV the self-energy approximately takes the Fermi-liquid form, but for larger frequencies meV pronounced () deviations occur. On the positive frequency (electron addition) side the imaginary part of the self-energy saturates for eV and the real part loses most of its frequency dependence. On the negative frequency (electron removal) side the imaginary part of the self-energy increases (although not as rapidly as the Fermi-liquid ) and exhibits a large peak (not shown) at eV. The low frequency at which deviations from Fermi-liquid behavior occur is characteristic of multiorbital systems with a sizeable Hund’s coupling Georges13.
At very low frequencies ( meV), the frequency is less than so the scattering rate is in effect constant. The cubic and Allen formula conductivities in Fig. 1 are indeed well described by a Drude form with frequency independent scattering rate meV. However, in the orthorhombic structure interband transitions cause the conductivity to decay much less rapidly than expected from the Drude formula at frequencies meV.
Suppose now that the self-energy was well described by the Fermi-liquid form even at frequencies higher than meV. Inspection of the upper inset of Fig. 1 shows that for meV the corresponding conductivity becomes much smaller than either the cubic or the experimental system conductivity. [One sees this from the behavior of the SBFL curve in the main panel of Fig. 1, but it can also be derived directly (see the Supplementary Material supp) by inserting Eq. (6) into Eq. (7), setting temperature and scaling the internal integration variable by the external frequency to yield The real part of this expression has an approximately Lorentzian Drude-like decay with decay constant meV, which describes well the high-frequency behavior of the Fermi-liquid results.) The slower decay of the actual conductivity is a signature of deviations from Fermi-liquid physics. It results in particular from the saturation of the scattering rate and the strong deviation of Mravlje11 from the low frequency linear behavior apparent in Fig. 3. In this non-Fermi-liquid higher-frequency regime, the similarity of the conductivities for the cubic and experimental structure conductivities shows that band structure effects are of less importance here, implying that information about the self-energy may be extracted from the conductivity.
Formally inverting Eqs. (7) or (Band Structure and Terahertz Optical Conductivity of Transition Metal Oxides: Theory and Application to CaRuO3) to obtain self-energies from measured conductivities is an ill-posed and essentially unsolvable inversion problem. However the widely used “memory function” method Basov05 provides considerable insight. The typical procedure is to express the complex conductivity in terms of an optical mass enhancement and scattering rate defined as
| (5) |
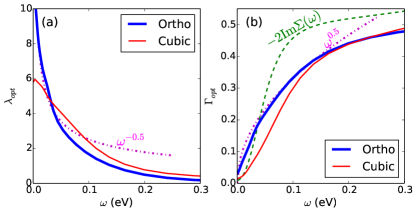
The objects and are often interpreted as mass enhancement and scattering rate, respectively, and are assumed to provide information about the electron self-energy. Their frequency dependence is determined by the frequency dependence of the complex conductivity while the overall magnitude is determined by the constant . In the two panels of Fig. 4 we present the and determined from our calculations, using the directly computed sum rule values eV and eV (computed for the orthorhombic direction).
For the cubic and Allen-formula cases, where interband transitions are not important, the scattering rate found from the memory function is in reasonable agreement with a particle-hole average of an imaginary part of the self-energy. The scattering rate magnitude is correctly estimated and the low frequency behavior is clear. The low frequency limit of the mass corresponds precisely to the quasiparticle mass enhancement and the decrease of mass at higher frequency reflects the flattening of the curve Stricker14.
For calculations performed with the experimental structure the situation is different: at low frequencies the inferred scattering rate is too large by a factor and has the wrong concavity. In fact, the inferred scattering rate is roughly consistent with an behavior and, similarly, over a limited low frequency range the optical mass can be fit as . This suggests that caution is warranted in performing a memory function analysis of the low frequency data on GdFeO3-distorted materials. However, the reasonable correspondence at higher frequencies ( meV) between the optical scattering rate and the imaginary part of the self-energy (averaged over positive and negative frequencies) again confirms that in this range the conductivity does give a reasonable estimate of the magnitude and the saturation frequency of the self-energy, and in this sense reveals non-Fermi-liquid behavior of the Hund’s metal kind.
In summary, using CaRuO3 as an example we have shown that real materials effects, in particular a multiplicity of optically allowed low-lying transitions arising from band folding due to rotational and tilt distortions, can produce a low frequency conductivity of the form previously associated with non-Fermi-liquid physics. A direct diagnosis of universal Fermi-liquid behavior from the optical conductivity, along the lines of Ref. Berthod13, only applies when such effects are not important. Our results call for a reexamination of other reports of unusual optical response, for instance in SrRuO3, which has a ferromagnetic ground state and a smaller orthorhombic distortion, and for which ARPES spectra consistent with Fermi-liquid behavior are observed Shai13. It is also important to examine whether low-lying interband transitions complicate the analysis Sulewski88; Katsufuji99; Yang06; Nagel-2012; Mirzaei13 of the ratio of the and terms in the optical scattering rate, which has been argued to be inconsistent with Fermi-liquid theory.
Acknowledgements.
H.T.D. acknowledges support from the Deutsche Forschungsgemeinschaft (DFG) within Projects No. FOR 1807 and No. RTG 1995, as well as the allocation of computing time at Jülich Supercomputing Centre and RWTH Aachen University through JARA-HPC. J.M. acknowledges support of the Slovenian research agency under the program P1-0044. A.G. acknowledges a grant from the European Research Council (ERC-319286 QMAC) and the Swiss National Science Foundation (NCCR-MARVEL). The work of A.J.M. on this project was supported by the US National Science Foundation under grant DMR-1308236.References
- Lee et al. (2002) Y. S. Lee, J. Yu, J. S. Lee, T. W. Noh, T.-H. Gimm, H.-Y. Choi, and C. B. Eom, Phys. Rev. B 66, 041104 (2002).
- Kamal et al. (2006) S. Kamal, D. M. Kim, C. B. Eom, and J. S. Dodge, Phys. Rev. B 74, 165115 (2006).
- Kostic et al. (1998) P. Kostic, Y. Okada, N. C. Collins, Z. Schlesinger, J. W. Reiner, L. Klein, A. Kapitulnik, T. H. Geballe, and M. R. Beasley, Phys. Rev. Lett. 81, 2498 (1998).
- Schneider et al. (2014) M. Schneider, D. Geiger, S. Esser, U. S. Pracht, C. Stingl, Y. Tokiwa, V. Moshnyaga, I. Sheikin, J. Mravlje, M. Scheffler, and P. Gegenwart, Phys. Rev. Lett. 112, 206403 (2014).
- Allen (1971) P. B. Allen, Phys. Rev. B 3, 305 (1971).
- Allen (2015) P. B. Allen, Phys. Rev. B 92, 054305 (2015).
- Basov et al. (2011) D. N. Basov, R. D. Averitt, D. van der Marel, M. Dressel, and K. Haule, Rev. Mod. Phys. 83, 471 (2011).
- Berthod et al. (2013) C. Berthod, J. Mravlje, X. Deng, R. Žitko, D. van der Marel, and A. Georges, Phys. Rev. B 87, 115109 (2013).
- Stricker et al. (2014) D. Stricker, J. Mravlje, C. Berthod, R. Fittipaldi, A. Vecchione, A. Georges, and D. van der Marel, Phys. Rev. Lett. 113, 087404 (2014).
- Maslov and Chubukov (2012) D. L. Maslov and A. V. Chubukov, Phys. Rev. B 86, 155137 (2012).
- Marzari and Vanderbilt (1997) N. Marzari and D. Vanderbilt, Phys. Rev. B 56, 12847 (1997).
- Souza et al. (2001) I. Souza, N. Marzari, and D. Vanderbilt, Phys. Rev. B 65, 035109 (2001).
- (13) See Supplemental Material, which includes Refs. Bensch90; QE-2009; QEPseudo; Perdew96; Momma11; Mostofi08; Imada98; Mravlje11; Vaugier12; Dang_srocro; Werner06; triqs_project; Vidberg77 for details of DFT and DMFT calculations, the optical conductivity, the real-frequency self-energy and the discussion of the vertex corrections.
- Bensch et al. (1990) W. Bensch, H. W. Schmalle, and A. Reller, Solid State Ionics 43, 171 (1990).
- Giannozzi et al. (2009) P. Giannozzi et al., Journal of Physics: Condensed Matter 21, 395502 (19pp) (2009).
- (16) We used the pseudopotentials Ca.pbe-nsp-van.UPF, Ru.pbe-n-van.UPF and O.pbe-rrkjus.UPF from www.quantum-espresso.org/pseudopotentials.
- Perdew et al. (1996) J. P. Perdew, K. Burke, and M. Ernzerhof, Phys. Rev. Lett. 77, 3865 (1996).
- Momma and Izumi (2011) K. Momma and F. Izumi, Journal of Applied Crystallography 44, 1272 (2011).
- Mostofi et al. (2008) A. A. Mostofi, J. R. Yates, Y.-S. Lee, I. Souza, D. Vanderbilt, and N. Marzari, Computer Physics Communications 178, 685 (2008).
- Imada et al. (1998) M. Imada, A. Fujimori, and Y. Tokura, Rev. Mod. Phys. 70, 1039 (1998).
- Mravlje et al. (2011) J. Mravlje, M. Aichhorn, T. Miyake, K. Haule, G. Kotliar, and A. Georges, Phys. Rev. Lett. 106, 096401 (2011).
- Vaugier et al. (2012) L. Vaugier, H. Jiang, and S. Biermann, Phys. Rev. B 86, 165105 (2012).
- Dang et al. (2015) H. T. Dang, J. Mravlje, A. Georges, and A. J. Millis, Phys. Rev. B 91, 195149 (2015).
- Werner et al. (2006) P. Werner, A. Comanac, L. de’ Medici, M. Troyer, and A. J. Millis, Phys. Rev. Lett. 97, 076405 (2006).
- Parcollet et al. (2015) O. Parcollet, M. Ferrero, T. Ayral, H. Hafermann, I. Krivenko, L. Messio, and P. Seth, Computer Physics Communications (2015), in press.
- Vidberg and Serene (1977) H. J. Vidberg and J. Serene, Journal of Low Temperature Physics 29, 179 (1977).
- Khurana (1990) A. Khurana, Phys. Rev. Lett. 64, 1990 (1990).
- Wang et al. (2011) X. Wang, L. de’ Medici, and A. J. Millis, Phys. Rev. B 83, 094501 (2011).
- Tomczak and Biermann (2009) J. M. Tomczak and S. Biermann, Phys. Rev. B 80, 085117 (2009).
- Georges et al. (2013) A. Georges, L. d. Medici, and J. Mravlje, Annual Review of Condensed Matter Physics 4, 137 (2013).
- Basov and Timusk (2005) D. N. Basov and T. Timusk, Rev. Mod. Phys. 77, 721 (2005).
- Shai et al. (2013) D. E. Shai, C. Adamo, D. W. Shen, C. M. Brooks, J. W. Harter, E. J. Monkman, B. Burganov, D. G. Schlom, and K. M. Shen, Phys. Rev. Lett. 110, 087004 (2013).
- Sulewski et al. (1988) P. E. Sulewski, A. J. Sievers, M. B. Maple, M. S. Torikachvili, J. L. Smith, and Z. Fisk, Phys. Rev. B 38, 5338 (1988).
- Katsufuji and Tokura (1999) T. Katsufuji and Y. Tokura, Phys. Rev. B 60, 7673 (1999).
- Yang et al. (2006) J. Yang, J. Hwang, T. Timusk, A. S. Sefat, and J. E. Greedan, Phys. Rev. B 73, 195125 (2006).
- Nagel et al. (2012) U. Nagel, T. Uleksin, T. Rõõm, R. P. S. M. Lobo, P. Lejay, C. C. Homes, J. S. Hall, A. W. Kinross, S. K. Purdy, T. Munsie, T. J. Williams, G. M. Luke, and T. Timusk, Proc. Natl. Acad. Sci. USA 109, 19161 (2012).
- Mirzaei et al. (2013) S. I. Mirzaei, D. Stricker, J. N. Hancock, C. Berthod, A. Georges, E. van Heumen, M. K. Chan, X. Zhao, Y. Li, M. Greven, N. Barišić, and D. van der Marel, Proceedings of the National Academy of Sciences 110, 5774 (2013).
Supplementary Material for
Band Structure and Terahertz Optical Conductivity of Transition Metal Oxides: Theory and Application to CaRuO3
I Density Functional Calculations
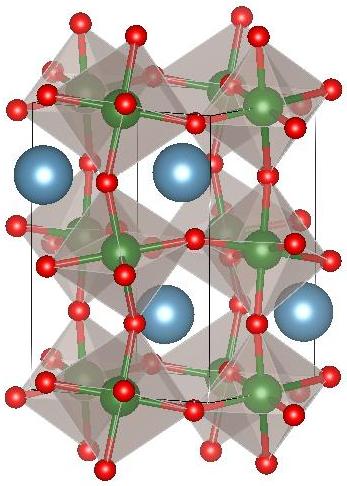
We obtained the Hamiltonian matrix and the current operator for both the ideal cubic perovskite structure (lattice constant Å) and the experimentally observed structure (atomic positions from Ref. Bensch90 - see Fig. 1S for the lattice structure) by using maximally localized Wannier function techniques Marzari97; Souza01 to project the Kohn-Sham Hamiltonian found from a spin-unpolarized density functional theory (DFT) band calculation onto the near-Fermi-surface states. The DFT calculations were performed using Quantum ESPRESSO QE-2009; QEPseudo with a mesh of , cutoff frequency Ry and the Perdew-Burke-Ernzerhof exchange correlation functional Perdew96.
The projection to the near-Fermi-surface bands was performed using the wannier90 code Mostofi08. For the experimental structure, the energy window for the projection is from to eV; for the ideal cubic structure, it ranges from to eV. We find that in the ideal cubic structure the Ru -derived bands overlap the oxygen bands in the region of the zone center (energies eV or more below the Fermi level), leading to imperfections in the Wannier fit in these regions, especially in the one Ru per unit cell calculation. These small details relate to states several eV away from the Fermi surface and do not affect our conclusions, which concern excitations with energies eV.
II Dynamical Mean Field Theory Calculations
We obtained the self-energy from single-site dynamical mean field (DMFT) calculations where the correlated orbitals are the -derived bands of the corresponding to the experimental structure of CaRuO3 and the additional interactions are of the rotationally invariant Slater-Kanamori form Imada98 with eV and eV. The and parameters are close to those found in previous studies for Sr2RuO4 Mravlje11; Vaugier12 and very recent studies of SrRuO3 and CaRuO3 Dang_srocro. However, the precise values are not important here: our goal is not to model the materials in quantitative detail but rather to uncover general features.
Our DMFT calculations use the hybridization expansion version of continuous-time quantum Monte Carlo method Werner06 implemented in the TRIQS package triqs_project, and temperature set to K. The momentum integral in the DMFT self-consistent loop is calculated using Gaussian quadrature with points in each direction. The resulting imaginary-time self-energies are continued using the Pade method Vidberg77.
In the DMFT approximation the self-energy is local so is block diagonal in the Wannier basis of orbitals localized on the Ru sites. On each site an orbital basis may be found for which the self-energy is, to a very good approximation, orbitally diagonal. In all of the cases we have considered this basis is the one found by the wannier90 code, and is such that for each Ru site, the local and axes point towards the three different directions of the RuO6 octahedron. Within this basis, the off-diagonal elements of the Hamiltonian matrix contribution is small, less than 10% of the matrix norm. (We have tested that using a more optimal choice of basis with off-diagonal contribution of about 5% of the matrix norm does not change the results appreciably.) A simple rotation relates the orbital basis on one Ru site in the unit cell to that in another. The important part of the self-energy is thus a diagonal matrix and we neglect the off-diagonal terms in our calculations. The three diagonal components of the self-energies turn out to be similar.
III Optical conductivity calculations
The optical conductivity [Eq. (3) in the manuscript] is a four-dimensional integral in frequency and momentum space. We calculate by using Gaussian quadrature with 60 points in each direction. For the frequency integration, because of in , we set the integrating interval for from to with the Fermi width (reminding that K in our calculations and is the Fermi-Dirac distribution).
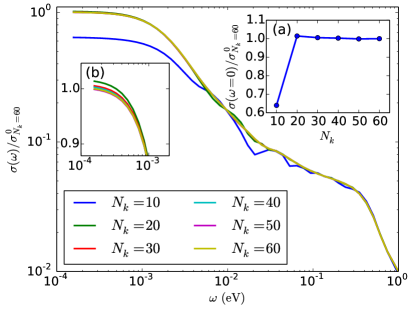
Using points per direction is already good enough to justify the convergence of the calculations. We have checked for some cases by comparing optical spectra produced using different numbers of points per direction. Figure 1S demonstrates the dependence of the result on the number of integral points for the case of distorted structure CaRuO3. It shows that the result converges quickly as the number of points per direction reaches 60. The optical spectra are reasonably converged by and the DC conductivity converges at .
IV The self-energy
Here for completeness we show the orbital dependence of the self-energy in Fig. 1S.
Fitting the low frequency behavior of the self-energy to the form
| (6) |
yields eV, and for and orbitals respectively. Here the orbital labelling is with reference to the octahedral directions characteristic of an RuO6 octahedron.
V Optical conductivity for single band Fermi liquid
Here we give the details of the derivation of the optical conductivity obtained if the Fermi liquid self-energy is substituted into the Allen formula of the main text. We begin from the Allen formula,
| (7) |
where the denotes complex conjugation.
VI Vertex Corrections
Here we briefly discuss the vertex corrections in the multiband situation considered here.
What is needed for vertex corrections to vanish is
-
1.
No on-site optical (dipole-allowed) transitions: the optical absorption process requires moving an electron from one site to another. This is trivially satisfied in the single-band model, but is also satisfied in multiband models of the type we consider where the interacting on-site orbitals are -derived and all have the same even parity. If one were to consider a more general model that included say the Ru or orbitals, and were to include interactions linking the and orbitals, then vertex corrections would be non-vanishing.
-
2.
Point parity symmetry. The issue here is that if condition (1) is satisfied, the dipole required for the optical transition is made by moving an electron from one site to another. If moving the electron to the left or to the right creates equal magnitude dipoles with opposite signs, no on-site effect can be generated and vertex corrections do not arise.
Mathematically a vertex correction arises from ; if the conditions above are satisfied then (which in single-site DMFT is site-local) is a scalar and there is no vector in the problem which can allow to couple to it to first order. Specifically, in the formalism used in our paper the Green’s function is a matrix. In the Wannier basis that we use, (-derived states localized on the 4 Ru atoms in the unit cell) the self-energy is independent of momentum in the Brillouin zone and is site-diagonal, so that the self-energy matrix is block (site) -diagonal in this basis. The bare conductivity operator has no matrix elements between states on the same site (within the same block): conductivity processes only transfer an electron from one site to another, via a matrix element which has odd parity. In these circumstances, the vertex correction for the optical conductivity indeed vanishes in the single-site approximation.
In a crystal structure of sufficiently low symmetry, hybridization effects could in principle lower the point symmetry of a given Ru site, so that the on-site wave functions did not have pure character (referred to the Ru site), thereby creating a vector in the problem that would allow a non-zero ; this would also activate an on-site optical transition, thereby requiring a vertex correction. However, we know that such effects are very small in the case we consider (to a very good approximation the four Ru in a unit cell are related by a translation and octahedral rotation and the octahedra are close to symmetric), and have been set to zero by the approximation we are forced to make to set the off-diagonal terms in the hybridization function to zero.
We further observe that additional small interband terms would only act to increase the differences between the actual conductivity and the Allen formula, strenghtening our conclusion that one cannot safely draw inferences about non-Fermi-liquid behavior or quasiparticle scattering rates from optical conductivities once the structure becomes non-cubic.
References
- Bensch et al. (1990) W. Bensch, H. W. Schmalle, and A. Reller, Solid State Ionics 43, 171 (1990).
- Marzari and Vanderbilt (1997) N. Marzari and D. Vanderbilt, Phys. Rev. B 56, 12847 (1997).
- Souza et al. (2001) I. Souza, N. Marzari, and D. Vanderbilt, Phys. Rev. B 65, 035109 (2001).
- Giannozzi et al. (2009) P. Giannozzi et al., Journal of Physics: Condensed Matter 21, 395502 (19pp) (2009).
- (5) We used the pseudopotentials Ca.pbe-nsp-van.UPF, Ru.pbe-n-van.UPF and O.pbe-rrkjus.UPF from www.quantum-espresso.org/pseudopotentials.
- Perdew et al. (1996) J. P. Perdew, K. Burke, and M. Ernzerhof, Phys. Rev. Lett. 77, 3865 (1996).
- Momma and Izumi (2011) K. Momma and F. Izumi, Journal of Applied Crystallography 44, 1272 (2011).
- Mostofi et al. (2008) A. A. Mostofi, J. R. Yates, Y.-S. Lee, I. Souza, D. Vanderbilt, and N. Marzari, Computer Physics Communications 178, 685 (2008).
- Imada et al. (1998) M. Imada, A. Fujimori, and Y. Tokura, Rev. Mod. Phys. 70, 1039 (1998).
- Mravlje et al. (2011) J. Mravlje, M. Aichhorn, T. Miyake, K. Haule, G. Kotliar, and A. Georges, Phys. Rev. Lett. 106, 096401 (2011).
- Vaugier et al. (2012) L. Vaugier, H. Jiang, and S. Biermann, Phys. Rev. B 86, 165105 (2012).
- Dang et al. (2015) H. T. Dang, J. Mravlje, A. Georges, and A. J. Millis, Phys. Rev. B 91, 195149 (2015).
- Werner et al. (2006) P. Werner, A. Comanac, L. de’ Medici, M. Troyer, and A. J. Millis, Phys. Rev. Lett. 97, 076405 (2006).
- Parcollet et al. (2015) O. Parcollet, M. Ferrero, T. Ayral, H. Hafermann, I. Krivenko, L. Messio, and P. Seth, Computer Physics Communications (2015), in press.
- Vidberg and Serene (1977) H. J. Vidberg and J. Serene, Journal of Low Temperature Physics 29, 179 (1977).