Origin of Galactic Cosmic Rays from Supernova Remnants
Abstract
We analyze the results of recent measurements of Galactic cosmic ray (GCRs) energy spectra and the spectra of nonthermal emission from supernova remnants (SNRs) in order to determine their consistency with GCR origin in SNRs. It is shown that the measured primary and secondary CR nuclei energy spectra as well as the observed positron-to-electron ratio are consistent with the origin of GCRs up to the energy eV in SNRs. Existing SNR emission data provide evidences for efficient CR production in SNRs accompanied by significant magnetic field amplification. In some cases the nature of the detected -ray emission is difficult to determine because key SNR parameters are not known or poorly constrained.
keywords:
acceleration of particles , cosmic rays , ISM: supernova remnantsPACS:
95.85 Nv, 95.85 Pw, 95.85 Ry, 98.38 Mz, 98.38 Am1 Introduction
Supernova remnants (SNRs) are considered as a main cosmic ray (CR) source. They are able to support a constant density of the Galactic cosmic ray (GCR) population against loss by escape, nuclear interactions and ionization energy loss. The mechanical energy input to the Galaxy from each supernova (SN) is about erg so that with a rate of about one every 30 years the total mechanical power input from supernovae is of the order erg/s (e.g. [1, 2]). Thus supernovae have enough power to drive the GCR acceleration if there exists a mechanism for channeling about 10% of the mechanical energy into relativistic particles.
An appropriate acceleration mechanism is known since 1977 [3]. This is so called regular or diffusive shock acceleration process. The strong shock produced by high velocity ejecta expanding into the ambient medium pick up a few particles from the plasma flowing into the shock fronts and accelerate them to high energies.
The theory of particle acceleration by the strong shocks associated with SNRs at present is sufficiently well developed and specific to allow quantitative model calculations (e.g. see [4, 5, 6, 7, 8] for reviews). Theoretically progress has been due to the development of the kinetic nonlinear theory of diffusive shock acceleration [9, 10, 11, 12, 13]. The theory consistently includes the most relevant physical factors, essential for SNR evolution and CR acceleration, and it is able to make quantitative predictions of the expected properties of CRs produced in SNRs and their nonthermal radiation.
There are also strong theoretical and observational reasons, that argue for a significant amplification of the magnetic field as a result of the pressure gradient of the accelerating CRs, exciting instabilities in the precursor of the SNR shock. The most important consequence of magnetic field amplification in SNRs is the substantial increase of the maximal energy of CRs, accelerated by SN shocks, that presumably provides the formation of GCR spectrum inside SNRs up to the energy eV.
Considerable progress have been achieved during the last years in experimental determination of GCR spectra and spectra of nonthermal emission of SNRs. To empirically confirm that the main part of GCRs indeed originates in SNRs one has to check the consistency of the theoretical expectations with the observed properties of GCRs and nonthermal emission of SNRs.
Here we analyze the existing data especially those obtained in recent experiments PAMELA, Fermi and AMS-02 together with observational results of nonthermal emission of SNRs in order to check their consistency with GCR origin in SNRs.
2 Production of CRs in SNRs
Acceleration of CRs in SNRs starts at some relatively low energy when some kind of suprathermal particles begin to cross the SNR shock front. Any mechanism which supply suprathermal particles into the shock acceleration is called injection.
Some small fraction of the postshock thermal gas particle population are able to recross the shock that means the beginning of their shock acceleration. This is the most general and the most intense injection mechanism. It occurs for all kind of ions and electrons existing in the interstellar medium (ISM) and therefore it is relevant for primary CRs only. The corresponding injection rate is determined by the number of particles involved into the acceleration from each medium volume crossed the shock and by the momentum of these particles [9]:
| (1) |
Here is the number density of considered elements in ISM, is the sound speed, the subscripts 1(2) refer to the point just ahead (behind) the shock. Typical values of the dimensionless injection parameters which provide CR production with required efficiency are and . Since positrons, antiprotons and nuclei Li, Be, B are not represented in the ISM secondary CRs can not be produced due to such an injection.
Kinetic energy of all kind of GCR particles is considerably larger then the energy of gas particles injected from the postshock thermal pool. Therefore all GCRs which meet the expanding SNR shock are naturally involved into the diffusive shock acceleration. CR acceleration due to this second relevant injection mechanism is usually called ”reacceleration”.
Since GCR energy spectra are relatively steep and have a peak at kinetic energy GeV their injection parameters can be represented in the form
| (2) |
where is the total number of GCR species per unit volume and is their mean momentum, that corresponds to .
Primary nuclei during their acceleration inside SNRs produce secondary nuclei in nuclear collisions with the background gas like GCRs do it in the Galactic disk. Essential fraction of these already energetic particles has possibility to be involved in further shock acceleration. This is the third mechanism of CR production inside SNRs. For the first time it was studied to describe the formation of secondary CR nuclei spectra [14].
Secondaries with momentum are created throughout the remnant, everywhere downstream and upstream of SNR shock up to the distances of the order of the diffusive length of their parent primary CRs with momentum . Essential part of these particles are naturally involving in the acceleration at SNR shock. It includes all the particles created upstream and the particles created downstream at distances less than their diffusive length from the shock front. Since diffusive length is increasing function of momentum for the Bohm type diffusion coefficient which is realized during efficient CR acceleration in SNRs the spectrum of secondary CRs for the first time intersecting the shock front is very hard within wide range of their momenta . This makes the secondary particle spectra , produced in SNR, harder compared with the spectra of primaries .
The SNR efficiently accelerates CRs up to some maximal age yr when SNR release all previously accelerated CRs, primaries and secondaries, with the energy spectra and respectively, into surrounding ISM. Here is the particle kinetic energy. These CRs released from SNRs together with secondary CRs produced in ISM form the total secondary and primary CR populations. At sufficiently high energies the s/p ratio of nuclear component within simple leaky box model is given by the expression [14]
| (3) |
where represents the spectrum of secondaries produced in nuclear collisions of primary CRs within the Galactic disk. It is approximately given by the expression [14] , where is the escape length which is the mean matter thickness traversed by GCRs in the course of their random walk in the Galaxy, is the ISM gas density, is the CR escape time from the Galaxy, is the proton mass, is the crossection of secondary CRs production.
At sufficiently high energies the s/p ratio is determined by the ratio produced in the SNRs independently on the propagation model. The same is true for positron to electron ratio even though electrons are not the parent particles for positrons.
The rigidity spectrum of primary CRs accelerated by strong SNR shock within the test particle limit has a pure power law form , which extends up to some maximal value , with power law index . Here and are the rigidity and the charge number of CR particle respectively, is the speed of light, is the proton charge. In the case of efficient CR injection/acceleration which takes place at the expected proton injection rates the shock transition becomes modified due to CR backreaction. The spectrum of CRs accelerated by the modified shock is not a pure power law, it has a concave shape so that it becomes progressively flatter at higher rigidity: at low energies with whereas at high energies with . The deviation from the pure power law spectrum depends on the shock strength so that at early SNR evolutionary epoch can be as large as and can be as small as . The transition region from the steepest part of CR spectrum to its hardest part takes place at or at the energy .
Since the CR residence time within the Galactic confinement volume (or the mean escape time of CRs from this volume) is expected to have power law dependence on CR rigidity the spectrum of primary GCR spectrum remains concave.
The spectrum of secondary GCRs, , consists of two parts. Its low energy part produced in nuclear collisions of primary CRs with ISM nuclei is very steep whereas its high energy part, dominated by the SNR contribution, is expected to be even harder then the primary GCR spectrum. Therefore the secondary GCR spectra are expected to be considerably more concave compared with the primary GCR spectra. As a consequence the rigidity dependence of s/p ratio should have also the concave form.
There are strong theoretical reasons [15, 16, 17, 18] and observations of correspondingly sharp X-ray synchrotron filaments in e.g. SN 1006 [19, 20], that argue for a significant amplification of the magnetic field as a result of the pressure gradient of the accelerating CRs, exciting instabilities in the precursor of the SNR shock [22, 23]. However, as yet there does not exist a convincing dynamical equation for the resulting field amplitudes (for hybrid simulations and a most recent argument regarding large-scale field generation, e.g.[24]). Therefore, field amplification is not directly contained in the form of a kinetic wave equation in the existing nonlinear theory. The effective upstream field amplitude in the precursor at the current epoch is rather determined as a result of the best fit of the calculated to the measured spatially integrated synchrotron spectrum.
The strength of amplified upstream magnetic field varies according to the empirical relation [25]
| (4) |
The most important consequence of magnetic field amplification in SNRs is the substantial increase of the maximum energy of CRs , accelerated by SN shocks. Cutoff energy of CRs accelerated at any given SNR evolutionary stage is determined by geometrical factors and its value can be presented in the form [26]
| (5) |
where and are the shock radius and speed respectively. Therefore the upper (cutoff) CR energy during the Sedov evolutionary phase where the main part of CRs are produced varies as . The maximal CR energy is produced at the beginning of the Sedov phase [26]. Magnetic field amplification in typical SNR provides maximal energy for protons that is required condition to reproduce the spectrum of GCRs up to the knee energy [27].
The most general properties of CR acceleration in SNRs – concave CR rigidity spectra, concave s/p ratios, time dependence of the CR cutoff energy – briefly described in this section play primarily important role when one analyze the consistency of existing data with GCR origin in SNRs.
3 Primary GCRs
The intensities of protons, Helium, three groups of heavier nuclei, and ”All particles” as a function of kinetic energy calculated within kinetic nonlinear theory [27] are presented in Fig. 1 (see also [28] for a similar consideration). The values erg for the explosion energy, for the ejecta mass, yr for the active SNR age and , with for the escape time were used here. One can see that the theory fits the existing data in a satisfactory way up to the energy eV. This is especially true if one considers the difference between the CAPRICE and ATIC-2 experiments from one side and AMS-02 and PAMELA experiments from the other side as a measure of actual experimental uncertainty in these experiments. Therefore it is not so clear whether the Helium spectrum is indeed so noticeably harder than the proton spectrum as measured in the ATIC-2 balloon experiment.
The difficulty for the present theory is the fact that, in order to get consistency with the observed GCR spectra, a strongly energy dependent escape time with is needed, which is beyond the experimentally determined interval [2]. It is not clear at the moment whether or not CR escape from the Galaxy can be so strongly energy dependent.
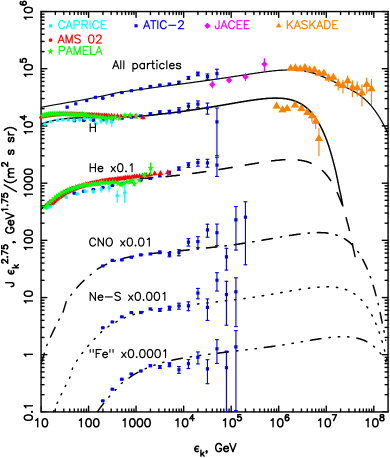
The calculation predicts concave spectra at energies GeV for individual CR species and there is some experimental evidence that the actual proton GCR spectrum is indeed concave. It is difficult to conclude whether Helium and heavier nuclei energy spectra have also concave shape. One needs more precise measurements at GeV in order to be able to arrive at a more stringent conclusion. At the same time the calculated all-particle spectrum has almost a pure power law form up to the knee energy (see Fig. 1).
According to Fig. 1 the knee in the observed all-particle GCR spectrum has to be attributed to the maximum energy of protons, produced in SNRs. The steepening of the all particle GCR spectrum above the knee energy eV is a result of the progressively decreasing contribution of light CR nuclei with increasing energy. Such a scenario is confirmed by the KASCADE experiment which shows relatively sharp cutoffs of the spectra of various GCR species at energies eV [34], so that at energy eV the GCR spectrum is expected to be dominated by the contribution from the iron nuclei.
One can conclude that the existing measurements of primary GCR nuclei are generally consistent with their origin in SNRs.

4 Secondary GCRs
The antiproton-to-proton ratio as a function of kinetic energy, calculated within kinetic nonlinear model [35], together with PAMELA data are shown in Fig. 2. It is seen that antiprotons for energies GeV are produced in SNRs equally effectively by two mechanisms inside SNRs whereas for GeV the creation of antiprotons in p-p collisions and their subsequent acceleration – both inside the SNRs – become dominant. In total the antiproton production in SNRs makes the energy dependence of considerably more flatter so that at GeV the ratio becomes larger by a factor of about five. Within the energy range 30 GeV GeV the energy dependence of the ratio is expected to be very flat.
PAMELA data, which well agree with the calculation [35] (see also [40]) , within the energy range 10 GeV GeV provide the evidence that the actual ratio is indeed flatter than it is expected if antiprotons are created in the ISM only.
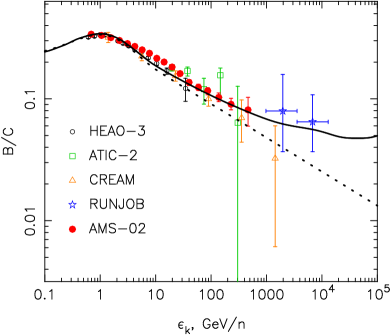
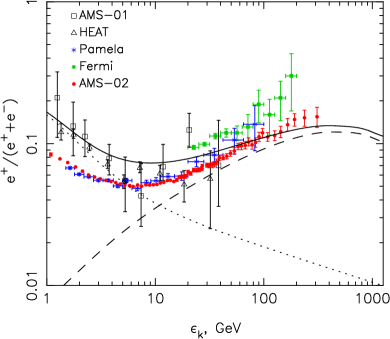
In order to check the consistency of other types of secondary CR production the boron-to-carbon (B/C) and positron to electron plus positron () ratios calculated within the same model and compared in Fig. 3 and 4 respectively with the existing experimental data [35].
Due to the boron production in SNRs the expected B/C ratio undergoes considerable flattening which starts at energy GeV/n. As one can see in Fig. 3 this is consistent with the measurements recently performed in RUNJOB balloon [44] and AMS-02 space [45] experiments even though for more strict conclusion one needs the measurements with higher statistics at energies above 1 TeV/n.
As it is seen in Fig. 4 that the expected ratio due to SNRs contribution very well corresponds to the growing part of this ratio detected in PAMELA [48], Fermi [49] and AMS-02 [50] experiments at energy GeV. Quantitatively there is a good agreement between calculation and AMS-02 data at energy GeV. Note, that the predicted overproduction of positrons at GeV is due to the adopted model of CR propagation inside the Galaxy [52].
The calculated SNR contribution to the secondary CR spectra represents the component which is unavoidably expected if SNRs are the main source of GCRs. Comparison with the existing data leads to the conclusion that the observed high energy excess of secondary nuclei and positrons can be produced in Galactic SNRs. This enables to expect a similar excess in the antiproton energy spectrum. The data expected very soon from AMS-02 experiment will make it clear whether the actual ratio is indeed not less flat at energies GeV than we predict.
5 Nonthermal emission of Galactic SNRs
Direct information about the high-energy CR population in SNRs can be obtained from the observations of the nonthermal emission produced by accelerated CRs in SNRs. The electron CR component is evident in a wide wave length range by the radiation that they produce in SNRs, from radio to -ray emission, whereas in the case of the nuclear CR component a -ray detection is the only possibility to find it. If this nuclear component is strongly enhanced inside SNRs then through inelastic nuclear collisions, leading to pion production and subsequent decay, -rays will be produced at the detectable level (e.g.[53, 10, 11]).
There are a number of physical parameters, whose values are needed to be known to describe the observed properties of young SNRs. SN explosion energy , ejecta mass , ISM number density directly determine the SNR dynamics, the observed size and speed of SN shock . Therefore their values are mainly determined from the fit of and if the SNR age and the SNR distance are known. At the same time there are two other physical parameters which essentially influence the efficiency of the diffusive shock acceleration and its final significance.
The first one is the proton injection rate . There is a good semi-quantitative understanding of the injection rate of nuclear particles into the diffusive shock acceleration process. The actual value of can be extracted from the fit of the observed SNR synchrotron spectrum, whose shape is sensitive to the shock modification due to the CR backreaction that in turn strongly depends on .
The magnetic field strength is the second important parameter. It determines the maximum energy of nuclear CRs which could be achieved during the SNR evolution . Radio observations of synchrotron emission are powerful probes of magnetic fields and electron distributions in SNRs. Electrons with a power-law energy spectrum produce the synchrotron flux with the spectral index . Here is the downstream magnetic field strength, is the shock compression ratio. In the test-particle limit power-law index and therefore . Values observed in young SNRs require concave electron spectrum (progressive hardening to higher energies) with at GeV, as predicted by nonlinear shock acceleration models. The required shock modification is produced by the proton CR component. Therefore the fit of the spectral shape of the radio emission makes it possible to determine the actual proton injection rate . In addition, since the synchrotron emission at frequency are mainly produced by electrons of energy one needs not only efficient CR acceleration with subsequent shock modification but also a high magnetic field G in the acceleration region in order to have at radio frequencies.
All energy of the electrons at high energies , where synchrotron losses are significant, is rapidly and completely transformed into the synchrotron emission independently on the magnetic field value. The synchrotron flux in this X-ray range is determined by the number of injected/accelerated electrons, or by the amplitude . Therefore the fit of X-ray synchrotron spectrum at known proton injection rate gives the estimate of electron to proton ratio . At known synchrotron radio emission depends on the interior magnetic field value . Therefore the fit of radio emission provides the estimate of downstream magnetic field strength .
In addition, since for given synchrotron flux required number of electrons is determined by the amplitude , the relative role of electrons in high-energy -ray production is expected to be low in young SNRs where magnetic field is strongly amplified.
Recent observations with the Chandra and XMM-Newton X-ray space telescopes have confirmed earlier detections of nonthermal continuum emission in hard X-rays from young shell-type SNRs. With Chandra it became even possible to resolve spatial scales down to the arcsec extension of individual dynamical structures like shocks [19, 20, 21]. The filamentary hard X-ray structure is the result of strong synchrotron losses of the emitting multi-TeV electrons in amplified magnetic fields downstream of the outer accelerating SNR shock [22, 23, 25]. This provides an unique possibility for the determination of the SNR magnetic field strength, based on the measured filaments width [23]. These effective magnetic fields turned out to be exactly the same as extracted from the fit of the overall synchrotron spectrum.
In oder to perform the detail comparison of theoretical expectation with the experiment one needs sufficient number of individual SNRs with known values of relevant physical parameters such as the age, distance, ISM density. Unfortunately the number of such SNRs are very limited, especially those which are seen in all wavelength from radio to -ray . It is why every new experimentally established property of nonthermal emission of SNR represents considerable interest for theoretical analysis. Here we analyze the properties of the nonthermal emission from a number of young Galactic SNRs, which are detected -ray sources, in order to find evidence for efficient CR acceleration consistent with GCR origin in SNRs.
5.1 Supernova remnant SN 1006
Historical remnant SN 1006 is the most appropriate SNR for studying the properties of nonthermal emission: the distance kpc was determined using optical measurements with relatively high precision and all other astronomical parameters are quite well known (see [36] and reference there).
As a type Ia supernova SN 1006 presumably expands into a uniform ISM, ejecting roughly a Chandrasekhar mass . The values of several scalar key parameters (proton injection rate , electron to proton ratio and the interior magnetic field strength ) can be determined from a fit of the solutions that contain these parameters to the observed spatially integrated synchrotron emission data. The parameter values for SN 1006, evaluated in this way [37], agree very well with the Chandra measurements of the X-ray synchrotron filaments.
In order to explain the detailed -ray spectrum, the values of the hydrodynamic supernova explosion energy erg and erg are taken to fit the observed shock size pc and shock speed km/s at the current epoch yr for the ISM hydrogen number densities and , respectively. These densities are consistent with the observed level of the -ray emission. Note that the best fit value of the upstream magnetic field strength G is almost non-sensitive to .
Fig. 5 illustrates the consistency of the calculated synchrotron and -ray spectra with the observed spatially integrated spectra [36]. The H.E.S.S. data [56] for the NE and SW limbs, respectively, have been multiplied by a factor of 2, in order facilitate comparison with the full deduced -ray flux. As can be seen from Fig. 5, the calculated synchrotron spectrum fits the observations both in the radio and the X-ray ranges very well. Note that the radio spectral index value is a clear indication of the modified SNR shock.
The only important parameter which can not be determined from the analysis of the synchrotron emission data is the external gas number density : Fig. 5 shows that the spectrum of synchrotron emission is almost non-sensitive to the ambient gas density. Consequently numerical solutions have been calculated for the pair of values (solid curve) and (dashed curve) which appear to bracket the density range consistent with the H.E.S.S. -ray measurements.
As a result the flux of TeV emission detected by H.E.S.S. is predicted to be consistent with an ISM hydrogen number density , consistent with the expectation from X-ray measurements.
Above 10 GeV the theoretical spectral energy flux can be approximated analytically as a slowly rising power law with an exponential cutoff
with cutoff energies TeV and 37 TeV for and , respectively. These two analytical curves, representing the best fit to the H.E.S.S. data, within 4%, respectively coincide with the calculated curves presented in Fig. 5.
The Fermi upper limit at GeV energies [57] is consistent with such a hard -ray spectrum.
The cutoff energy value TeV is unexpectedly low since the overall proton power-law spectrum extends up to a proton energy eV [37]. The reason is the progressive decrease of overlap between the radial gas density profile and the radial profile of the proton distribution function at energies eV. This leads to a lower cutoff of the -ray spectrum compared with what one would expect in the simple case of energy-independent overlap of CR protons with the gas distribution.
This spread of CRs into the upstream region which, for the highest energies , is faster than the shock expansion and represents the diffusive escape of CRs from the expanding SNR, as it was predicted [6]. Such a CR escape is expected in particular in the Sedov phase when the maximal energy of CRs, accelerated in the given evolutionary phase, decreases with time, because the value of is shock-size limited (see [26] for details) rather than time limited. At any given phase (where is the sweep-up time) efficient CR acceleration at the SN shock takes place only for energies , whereas for CRs with energies , produced during earlier times, the acceleration process becomes inefficient and these CRs expand into the upstream region. CR escape is relatively slow if Bohm diffusion in the amplified magnetic field takes place everywhere upstream for any CR energy. In reality this is expected to be true only for CRs with energies in the vicinity of the shock, where these CRs produce significant magnetic field amplification. At large distances upstream of the shock, , or/and for higher CR energies , CR diffusion should be much faster than Bohm diffusion. Therefore, in actual SNRs CR escape is expected to be faster and more intense than the present model predicts (see [58] for more detailed considerations). Since SN 1006 is only at the very beginning of the Sedov phase this underestimate of the magnitude of escape is not very critical however.
The sum of all above results suggests the conclusion that SN 1006 is a source with a high efficiency of nuclear CR production, required for the GCR sources, both in flux as well as in cutoff energy.
5.2 Tycho’s supernova remnant
The kinetic nonlinear model has been used in detail to investigate Tycho’s SNR as the remnant of a type Ia SN in a homogeneous ISM, in order to compare the results with existing data [59]. It was argued that consistency of the standard value of stellar ejecta mass and a total hydrodynamical explosion energy erg [60] with the gas dynamics, acceleration theory and the existing -ray measurements required the source distance to exceed kpc in order to be consistent with the existing HEGRA upper limit for TeV -ray emission. The corresponding ambient gas number density had then to be lower than cm-3. On the other hand, the rather low distance estimates from independent measurements together with internal consistency arguments of the theoretical model made it even more likely that the actual -ray flux from Tycho is “only slightly’ below the HEGRA upper limit. The strong magnetic field amplification produced by accelerated CRs implied a mean field strength of G and as such implied in addition that the -ray flux is hadronically dominated. The shock was modified with an overall compression ratio and a subshock compression ratio ; the latter is consistent with the observed radio index [61].
The TeV -ray emission from Tycho detected by VERITAS [62] corresponds very well to the above expectation. As can be seen from Fig.6 a new -ray spectrum calculated within the kinetic nonlinear theory (shown by the dashed line) is well consistent with the VERITAS measurements. For the proton injection rate this is still compatible with the above-mentioned shock modification and softening of the observed radio synchrotron emission spectrum. The new distance kpc and the corresponding new ambient ISM number density cm-3 were taken in order to fit the observed TeV -ray emission.
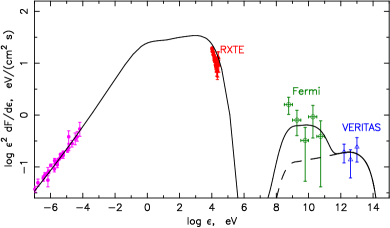
However the -ray spectrum measured by the Fermi LAT at energies 400 MeV to 100 GeV [64] is considerably (by a factor 2 to 5) above the value predicted by the kinetic theory (see Fig.6). This excess of GeV -ray emission, when compared with the theoretical predictions, requires a more detailed consideration of this object and its environment, taking into account new physical factors which had been hitherto neglected.
The physics aspect which is not included in the spherically symmetric model is an essential inhomogeneity of the ambient ISM on spatial scales that are smaller than the SNR radius. It is rather an inherent nonuniformity of the average ISM on account of (i) the interplay between its radiative heating by the diffuse galactic UV field and the radiative cooling of the gas and/or (ii) the stochastic agitation of the ISM by the mechanical energy input from supernova explosions occurring in the galactic environment. The first effect is a thermal instability and thus a mechanism for small-scale cloud formation in the ISM driven by runaway radiative cooling [65]. Specifically the balance between line-emission cooling and gas heating due to the ultraviolet background radiation leads to two thermally stable equilibrium ISM phases [66]. One of them is the so-called warm interstellar medium with a typical gas number density cm-3 and temperature K, the other one a cold neutral medium with cm-3 and K. According to simulations the scale of dense clouds is typically pc (e.g. [67]). Therefore the typical ISM should be treated as two-phase medium composed of uniform warm ISM (phase I) and small-scale dense clouds (phase II) embedded in the warm ISM.
In order to determine the specific properties of the CRs and their nonthermal emission in the case of a two-phase ISM the latter was approximated in a simple form, as a uniform warm phase with gas number density plus an ensemble of small-scale dense clouds with gas number density [68]. The warm diluted ISM phase is assumed to have a volume filling factor , whereas the clouds occupy a relatively small fraction of space with filling factor . It is in addition assumed that most of the gas mass is contained in the warm phase, which means that . Due to this fact the SN shock propagates in the two-phase ISM without essential changes compared with the case of a purely homogeneous ISM with number density . Therefore it produces inside the phase I of the ISM roughly the same amount of CRs and nonthermal emission as in the case of a homogeneous ISM. Then one has to estimate the additional contribution of the clouds in order to determine the overall spectrum of CRs. Using the scaling laws for the spectrum amplitude and cutoff energy of shock accelerated CRs one can easily estimate the values of relevant parameters of -ray emission created in shocked clumps (amplitude and shape of -ray spectrum and its cutoff energy) and determine the -ray flux from the clumps.
The total -ray flux , expected from Tycho’s SNR for a two-phase ISM is shown in Fig.6 [68]. One can see that it fits the existing data in a satisfactory way. The considerable increase (by a factor of 5) of the -ray emission at energies GeV expected in the case of a purely homogeneous ISM is due to the contribution of clumps which contain only 10% of the ISM mass.
One can conclude that the observed properties of Tycho’s SNR are consistent with the efficient nuclear CR production even though this scenario requires the confirmation that Tycho’s SNR indeed expands into a clumpy ISM.
5.3 Supernova remnant RX J1713-3946
RX J1713-3946 is a shell-type supernova remnant (SNR), located in the Galactic plane, that was discovered in X-rays with ROSAT [69]. The study of this SNR with the ASCA satellite [70, 71] have shown that the observable X-ray emission is entirely non-thermal, and this property was confirmed in later XMM observations [72]. The radio emission of this SNR is weak: only part of the shell could be detected in radio synchrotron emission up to now, with a poorly known spectral form [73].
RX J1713-3946 was also detected in very high energy -rays with the CANGAROO [74, 75] and H.E.S.S. [78] telescopes. Especially the latter observations show a clear shell structure at TeV energies which correlates well with the ASCA contours.
The difficulty for the theoretical description is the fact that several key parameters of this source are either not known or poorly constrained. This already concerns the distance and age of the object. It was demonstrated that consistent description of this object is achieved [79] following present consensus which puts the distance at 1 kpc, the age to about 1600 years and that the primary explosion must have been a type II/Ib SN event with a massive progenitor star whose mass loss in the main sequence phase created a hot wind bubble in a high-density environment. The solution for the overall remnant dynamics then yields the value for the expansion velocity of the outer shock, given the total mechanical energy erg released in the explosion. To obtain a consistent solution for the broadband nonthermal emission the injection rate and interior magnetic field G are needed. Note that since the value of radio spectral index is not determined the estimated proton injection rate is not as reliable as in the case of SN 1006 or Tycho’s SNR.
The properties of small scale structures of SNR RX J1713.7-3946 seen in X-rays [80], provide even stronger evidence that the magnetic field inside the SNR is indeed considerably amplified.
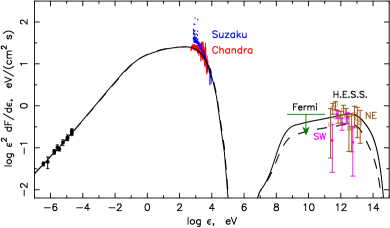
The calculated overall broadband spectral energy distribution [81] is displayed in Fig.7, together with the experimental data from ATCA at radio wavelengths, as estimated for the full remnant by Aharonian et al. [78], the X-ray data from ASCA, GeV -ray spectrum from Fermi [82] and the TeV -ray spectra from H.E.S.S. [77]. The overall fit of the existing data except Fermi data, which appeared later on (see below), is impressive, noting that the choice of a few key parameters like , , in the theory allows a spectrum determination over more than 19 decades.
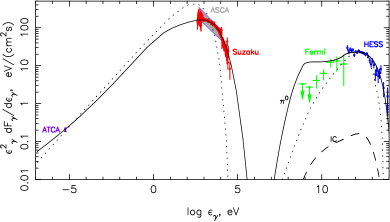
The same observed spectrum can also be compared with a theoretical spectrum (Fig.7) in which a very low ion injection rate () and a rather low downstream magnetic field strength of G was assumed. This corresponds to a dominantly leptonic -ray test particle spectrum without field amplification. The IC-scattered diffuse radiation field is the CMB without any additions. The electron injection strength was fitted such that an optimum fit with the observations in the radio and X-ray ranges is achieved, cf. Fig.7. We note that the form of the X-ray spectrum is only very poorly fitted in this leptonic scenario, since otherwise the radio data can not simultaneously be fitted. Also the -ray spectrum has a maximum which is much too sharp in comparison with the observed H.E.S.S. spectrum. At -ray energies of 1 GeV the spectral energy flux density is a factor of about 30 below the value in the hadronic scenario. Therefore it was expected that the measurements of GeV-emission would provide the clear discrimination between these two scenarios. However the recently appeared Fermi measurements of the RX J1713.7-3946 spectrum at energies 1-100 GeV [82] have not provided the clear resolution of this problem. As it is seen in Fig.7 Fermi data are situated almost in the middle between the predictions of leptonic and hadronic scenarios. While the hard measured spectrum at GeV energies is interpreted by the Fermi collaboration [82] and in some theoretical considerations [83, 84] as a strong argument in favor of a leptonic scenario the origin of -ray emission of RX J1713.7-3946 is still debated.
It was suggested, that the interpretation of the -ray observed emission of RX J1713.7-3946 changes dramatically, if the SNR expands in a clumpy medium [83, 85, 86]. This is indeed expected if the SNR progenitor is a massive star in a molecular cloud. The dense clumps remain unshocked inside SNR if their density considerably (by a factor of about ) exceeds the density ( cm-3) of surrounding warm medium [85]. CRs accelerated at the SN shock in the diluted medium penetrate the clumps and efficiently produce there -ray emission. Since CR diffusion coefficient is increasing function of energy, higher energy CRs penetrate more efficiently. Therefore CR energy spectrum inside the clumps and corresponding spectrum of hadronic -ray emission are expected to be much harder compared with the case of uniform medium. If the clumps contain the dominant fraction of the mass in the SNR hadronic -ray emission can explain the hard Fermi spectrum [85, 86].
The described scenario happens under the assumption that every clump is surrounded by the transition layer containing magnetic field which strength is highly enhanced (up to G) compared with its value in the surrounded medium. Such a layer considerably reduce CR diffusion inside the clump so that only CRs with energy above 1 TeV are able to penetrate the clump. According to the results of MHD simulation [85] this indeed can happen in the downstream region where plasma flow speed shear produces magnetic field amplification around the clump surface. However such an effect is expected to be much weaker upstream, within the shock precursor region and downstream during the initial time period (here is the SNR age) when magnetic field is not yet amplified considerably [85]. If the clumps in these regions are not surrounded by the boundary layers, CRs more efficiently penetrate the clumps compared to the simple estimates [86]. Then the -ray energy spectrum produced by these CRs is expected to be less harder as compared with estimates [85, 86].
We can conclude that further computational and observational efforts are needed in order to determine the nature of -ray emission of RX J1713.7-3946 .
5.4 Supernova remnant VelaJr.(RX J0852.0-4622)
VelaJr.(or RX J0852.0-4622) is a shell-type SNR with a diameter of , located in the Galactic plane. The SNR was originally discovered in X-rays with the ROSAT satellite [87]. In projection along the line of sight, RX J0852.0-4622 lies entirely within the still much larger Vela SNR and is only visible in hard X-rays, where the thermal radiation from the Vela SNR is no longer dominant. While non-thermal emission from the shell of RX J0852.0-4622 has been confirmed by several X-ray observatories [88, 89], a detection of thermal X-ray emission from the shell or the interior is not well established because of the confusion with the Vela SNR.
The radio emission of RX J0852.0-4622 is weak. In fact the SNR radio shell was only identified after its discovery in X-rays. The radio spectrum of RX J0852.0-4622 is therefore not well determined. Only for the northeastern rim a spectral index can be derived with moderate accuracy [90].
The shell of RX J0852.0-4622 was also detected in very high energy (VHE) -rays by the H.E.S.S. collaboration [91, 92], with a -ray flux as large as that from the Crab Nebula.
Vela Jr. represents the SNR which is very similar to RX J1713.7-3946 . The difficulty for the theoretical description is the fact that key parameters of this source (distance, age, radio emission spectrum) are either not known or poorly constrained.
The present-day parameters kpc, ers, yr, G, and , estimated from the overall fit of the observed nonthermal emission, lead to good agreement between the calculated and the measured spectral energy distribution of the synchrotron emission in the radio to X-ray ranges at the present time (Fig. 8) [94]. The steepening of the electron spectrum at high energies due to synchrotron losses and the smooth cutoff of the overall electron spectrum together naturally yield a fit to the X-ray data with their soft spectrum. Such a smooth spectral behavior is achieved in an assumed upstream field G (which leads to the above downstream field ).
Fig. 8 also shows the calculated -ray spectral energy distributions due to -decay, IC emission, and nonthermal Bremsstrahlung, together with the existing experimental data.
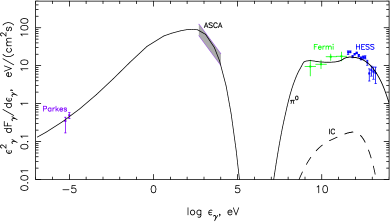
According to the calculation, the hadronic -ray production exceeds the electron contribution by more than two orders of magnitude at all energies. For energies TeV the -ray spectrum is expected to be close to , whereas starting from TeV it has a smooth extended cutoff despite the comparatively much sharper cutoff of the proton energy spectrum. It is clearly seen from Fig.8 that the calculated spectrum fits the H.E.S.S. measurements in a satisfactory way.
The predicted -ray emission [94] at GeV-energies was very well confirmed by the Fermi measurements [93]. This leads to the conclusion that RX J0852.0-4622 represents a hadronically dominated source of -rays and typical source of GCRs. However other considerations of this remnant argued that the gas density required by hadronic models would imply an intense X-ray line emission, which is not observed [95]. It is not clear at the moment whether this problem could be eliminated by the adjustment of poorly constrained key parameters of RX J0852.0-4622 within the hadronic model, which is so well consistent with observation. Further observational and theoretical studies are needed to obtain better estimates of relevant astronomical SNR parameters and to obtain more justified conclusions about the origin of -ray emission.
5.5 Diffuse Galactic gamma-ray background radiation
Since the source cosmic rays (SCRs) which are still confined inside all existing active SNRs have much more hard spectrum compared with GCRs, SCRs inevitably make a strong contribution to the “diffuse” -ray flux from the Galactic disk at all energies above a few GeV, if the population of SNRs is the main source of the GCRs. According to estimates [96], the SCR contribution becomes significant at energies greater than 100 GeV.
The diffuse Galactic -ray emission (DGE) from the full sky has recently been analyzed and compared with the observations with the Fermi-LAT for high energies [97]. The DGE had been modeled using the GALPROP code (e.g. [98]). These phenomenological models were constrained to reproduce directly measured GCR data and were then used to calculate the DGE. To construct a model for the expected total -ray emission, the -ray emission from the resolved point sources together with the residual instrumental -ray background and the extragalactic diffuse -ray background – both assumed to be isotropic – were added to the DGE model. In the inner Galaxy, the emission of the resolved sources apparently reaches a fraction of percent of the expected overall spectral energy flux density at GeV [97].
In the Galactic Plane these models systematically underpredict the data above a few GeV, and they do so increasingly above about 10 GeV until 100 GeV [97]. In the present paper this difference between data and model will be called the ”Fermi-LAT Galactic Plane Surplus” (FL-GPS). It is most pronounced in the inner Galaxy. According to Ackermann et al. [97], it can however also be seen in the outer Galaxy, with even a small excess at intermediate latitudes.
The modern gamma-ray instruments are able to detect individual SNR situated at relatively small distance kpc. Therefore most of the existing Galactic SNRs can not be resolved and contribute in DGE only. In Fig.9 a calculated -ray spectrum of the low latitude inner Galaxy (, ) is presented [99]. Besides the overall emission model it includes the contribution of SCRs confined within unresolved SNRs.
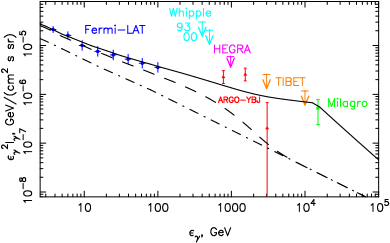
As shown in Fig.9, the discrepancy between the observed “diffuse” intensity and standard model predictions at energies above a few GeV [97] can be attributed to the SCR contribution alone up to GeV.
As one can see further from Fig.9, the expected -ray flux at TeV is consistent with the HEGRA upper limit, the Whipple upper limits [100], the Tibet-AS upper limits [101], and with the fluxes measured by the Milagro detector [102] at TeV, as well as with those obtained with the ARGO-YBJ detector [103] in the TeV range, taken at face value. Unfortunately, existing measurements do not coincide well in their longitude (l) / latitude (b) coverage with the corresponding ranges for it Fermi-LAT that correspond to / . For this reason the following comparisons must be taken with reservations.
These considerations demonstrate that the SCRs inevitably make a strong contribution to the “diffuse” -ray flux from the Galactic disk at all energies above a few GeV, if the population of shell-type SNRs is the main source of the GCRs. This explains the Fermi-LAT Galactic Plane Surplus. The quantitative estimates show in addition that the SCR contribution dominates over the extrapolated Fermi-LAT model for the total diffuse emission - which includes detected sources and isotropic Backgrounds - at energies greater than 100 GeV due to its substantially harder spectrum. The diffuse emission measured by Milagro at 15 TeV and by ARGO-YBJ at TeV energies provide limited evidence for that.
6 Conclusions
The proton GCR energy spectrum measured in ATIC-2, AMS 02, PAMELA and KASKADE experiments is generally consistent with its origin in Galactic SNRs. It has a slightly concave shape and extends up to a maximal energy eV as expected from nonlinear theory of CR acceleration in SNRs.
ATIC-2 data alone clearly show that at energies 30 GeV – 30 TeV Helium energy spectrum is essentially harder then the proton spectrum. Considering ATIC-2 data together with PAMELA and AMS 02 data it is already not so obvious that Helium energy spectrum is indeed so much harder at energies above 100 GeV.
SNR contribution into the secondary CR spectra and into the diffuse -ray background represents the hard component which is unavoidably expected if SNRs are the main source of GCRs. Comparison of the data, obtained in RUNJOB, Fermi, PAMELA and AMS 02 experiments, with theoretical expectations leads to a conclusion that the observed high energy excess of positrons, secondary nuclei and diffuse -ray background can be produced in Galactic SNRs. This enable to expect similar excess in the antiproton energy spectrum. The data expected very soon from AMS-02 experiment will make it clear whether the actual ratio is indeed not less flat at energies GeV then it is expected due to SNRs contribution.
Existing SNR emission data provide the evidences for the efficient CR production in SNRs accompanied by significant magnetic field amplification. At the same time the situation here is not completely clear yet: together with the cases of SN 1006 and Tycho’s SNR which observed properties well correspond to the theoretical expectations, there are other young SNRs RX J1713.7-3946 and VelaJr.(RX J0852.0-4622) for which the nature of the detected -ray emission is difficult to determine mainly because some key SNR parameters are not known or poorly constrained.
The further progress in our understanding of CR origin will be achieved due to the new measurements of GCR spectra and SNR emission spectra performed with essentially more sensitive instruments.
Acknowledgments
The author thanks H.J. Völk for valuable comments. This work is supported by the Russian Foundation for Basic Research (grants 13-02-00943 and 13-02-12036) and by the Council of the President of the Russian Federation for Support of Young Scientists and Leading Scientific Schools (project No. NSh-3269.2014.2).
References
- Ginzburg and Syrovatski [1964] V.L. Ginzburg, S.I. Syrovatskii, The Origin of Cosmic Rays, Pergamon Press and Macmillan Comp. 1964.
- Berezinsky et al. [1990] V.S. Berezinsky, S.V. Bulanov, V.L. Ginzburg et al., Astrophysics of Cosmic Rays, North-Holland Publ. Comp.1990.
- [3] G.F. Krymsky, Soviet Phys. Dokl. 23 (1977) 327.
- Drury [1983] L’O.C. Drury, Rep. Progr. Phys. 46 (1983) 973.
- Blandford and Eichler [1987] R. Blandford, D. Eichler, Phys. Rep. 154 (1987) 1.
- Berezhko and Krymsky [1988] E.G. Berezhko, G.F. Krymsky, Soviet Phys.-Uspekhi 31 (1988) 27.
- Malkov and Drury [2001] M.A. Makov, L’O.C. Drury, Rep. Progr. Phys. 64 (2001) 429.
- Berezhko [2008] E.G. Berezhko, Adv. Space Res. 41 (2008) 429.
- Berezhko et al. [1996] E.G. Berezhko et al., J. Exp. Theor. Phys. 82 (1996) 1.
- Berezhko and Völk [1997] E.G. Berezhko, H.J. Völk, Astropart. Phys. 7 (1997) 183.
- Berezhko and Völk [2000a] E.G. Berezhko, H.J. Völk, Astron. Astrophys. 357 (2000) 283.
- Zirakashvili and Ptuskin [2009] V.N. Zirakashvili, V.S. Ptuskin, in: Proc. 31st ICRC, Lodz 2009.
- Kang [2010] H. Kang, J. Korean Astron. Soc. 43 (2010) 25.
- Berezhko et al. [2003] E.G. Berezhko et al., Astron. Astrophys. 410 (2003) 189.
- Lucek & Bell [2000] S.G. Lucek, A.R. Bell, MNRAS 314 (2000) 65.
- Bell & Lucek [2001] A.R. Bell, S.G. Lucek, MNRAS 321 (2001) 433.
- Bell [2004] A.R. Bell, MNRAS 353 (2004) 550.
- Caprioli [2014] D. Caprioli, A. Spitkovsky, arXiv:1401.7679v1[astro-ph.HE]
- Bamba et al. [2003] A. Bamba et al., Astrophys. J. 589 (2003) 827; 2014, these proceedings.
- Long et al. [2003] K.S. Long et al. , Astrophys. J. 586 (2003) 1162.
- Vink & Laming [2003] J. Vink, J.M. Laming, Astrophys. J. 548 (2003) 758
- Berezhko et al. [2003] E. G. Berezhko et al., Astron. Astrophys. 412 (2003) L11
- Berezhko & Völk [2004] E. G. Berezhko, H. J. Völk, Astron. Astrophys. 419 (2004) L27.
- Reville & Bell [2012] B. Reville, A.R. Bell, MNRAS 419 (2012) 2433.
- Völk et al. [2005] H. J. Völk et al., A&A 505 (2005) 169.
- Berezhko [1996] E.G. Berezhko, Astropart. Phys. 5 (1996) 367.
- Berezhko & Völk [2007] E.G. Berezhko, H. J. Völk, Astrophys. J. 661 (2007) L175.
- Ptuskin et al. [2010] V.S. Ptuskin, Astrophys. J. 718 (2010) 31.
- Boezio et al. [2003] M. Boezio et al., Astropart. Phys. 19 (2003) 583.
- AMS [2013] http://www.ams02.org
- Pamela [2009] O. Adriani et al., Science 332 (2011) 69.
- Panov et al. [2006] A. D. Panov et al. 2006, astro-ph/0612377.
- Asakimori et al. [2003] K. Asakimori et al. Astrophys. J. 502 (2003) 278.
- Antoni et al. [2005] T. Antoni et al. Astropart. Phys. 24 (2005) 1.
- Berezhko and Ksenofontov [2014] E.G. Berezhko, L.T. Ksenofontov, Astrophys. J. 791 (2014) L22.
- Berezhko et al. [2012] E.G. Berezhko et al., Astrophys. J. 759 (2012) 12.
- Berezhko et al. [2009] E.G. Berezhko et al., A&A 505 (2009) 169
- Adriani et al. [2010] O. Adriani et al., Phys. Rev. Lett. 105 (2010) 121101.
- Donato et al. [2001] F. Donato et al., Astrophys. J. 563 (2001) 172.
- Blasi & Serpico [2009] P. Blasi, P.D. Serpico, Phys. Rev. Lett. 103 (2009) 081103.
- Engelmann et al. [1990] J.J. Engelmann et al., Astron. Astrophys. 233 (1990) 96.
- Panov et al. [2008] A.D. Panov et al., in: Proc. of 30th ICRC, Merida 2007, V. 2, p. 3.
- Ahn et al. [2008] H.S. Ahn et al., Astropart. Phys. 30 (2008) 133.
- Derbina et al. [2005] V.A. Derbina et al., Astrophys. J. 628 (2005) L41.
- Aguilar [2013] M. Aguilar, CERN Courier 53 (2013) 22.
- Aguilar et al. [2007] M. Aguilar et al., Phys. Lett. B 646 (2007) 145.
- Beatty et al. [2004] J.J. Beatty et al., Phys. Rev. Lett. 93 (2004) 241102.
- Adriani et al. [2009] O. Adriani et al. Nature 458 (2009) 607.
- Ackermann et al. [2012] M. Ackermann et al., Phys. Rev. Lett. 108 (2012) 011103.
- Aguilar et al. [2013] M. Aguilar et al., Phys. Rev. Lett. 110 (2013) 141102.
- Berezhko & Ksenofontov [2013] E.G. Berezhko, L.T. Ksenofontov, J. Phys.: Conf. Ser. 409 (2013) 012025.
- Moskalenko & Strong [1998] I.V. Moskalenko, A.W. Strong, Astrophys. J., 493 (1998) 694.
- Drury et al. [1994] L.O’C. Drury et al., Astron. Astrophys. 287 (1994) 959.
- Allen et al. [2004] G.E. Allen et al., Adv. Space Res. 33 (2004) 440.
- Bamba et al. [2008] A. Bamba et al., PASJ 60 (2008) S153.
- Acero et al. [2010] F. Acero et al., Astron. Astrophs. 516 (2010) A62.
- Araya [2012] M. Araya, F. Frutos, MNRAS 425 (2012) 2810.
- Ptuskin & Zirakashvili [2003] V. S. Ptuskin, V. N. Zirakashvili, A&A 403 (2003) 1.
- Völk et al. [2008] H.J. Völk et al., A&A 483 (2008) 529.
- Badenes et al. [2006] C. Badenes et al., Astrophys. J. 645 (2006) 1373.
- Reynolds & Ellison [1992] S.P. Reynolds, D.C. Ellison, Astrophys. J. 399 (1992) L75.
- Acciari et al. [2011] V. A. Acciari et al., Astrophys. J. 730 (2011) L20.
- Allen et al. [1999] G.E. Allen et al., in: 26th ICRC, Salt Lake City 1999, V.3, p.480.
- Giordano et al. [2012] F. Giordano, et al., Astrophys. J. 744 (2012) L2.
- Field [1965] G. B. Field, Astrophys. J. 142 (1965) 531.
- Wolfire et al. [2003] M. G. Wolfire et al., Astrophys. J. 587 (2003) 278.
- Audit & Hennebelle [2010] E. Audit, P. Hennebelle, A&A 511 (2010) A76.
- Berezhko et al. [2013] E.G. Berezhko et al., Astrophys. J. 763 (2013) 14.
- Pfeffermann & Aschenbach [1996] E. Pfeffermann, B. Aschenbach, 1996, in Roentgenstrahlung from the Universe, ed. H.H. Zimmermann, J. Trümper, & H. Yorke (MPE Rep. 263; Garching: MPE), 267.
- Koyama et al. [1997] K. Koyama et al. PASJ 49 (1997) L7.
- Slane et al. [1999] P. Slane et al., Astrophys. J. 525 (1999) 357.
- Cassam-Chenaï et al. [2004] G. Cassam-Chenaï et al., A&A 427 (2004) 199.
- Lazendic et al. [2004] J.S. Lazendic et al., Astrophys. J. 602 (2004) 271.
- [Muraishi et al. [2000] H. Muraishi et al., A&A 374 (2000) 895.
- Enomoto et al. [2002] R. Enomoto et al., Nature 416 (2002) 823.
- Aharonian et al. [2004] F.A. Aharonian et al., Nature 432 (2004) 75.
- Aharonian et al. [2007] F.A. Aharonian et al., A&A 464 (2007) 235.
- Aharonian et al. [2006] F.A. Aharonian et al., A&A 449 (2006) 223.
- Berezhko and Völk [2006] E.G. Berezhko, H.J. Völk, A&A 451 (2006) 981.
- Hiraga et al. [2005] J.S. Hiraga et al., A&A 431 (2005) 953.
- Berezhko and Völk [2009] E.G. Berezhko, H.J. Völk, A&A 511 (2010) A34.
- fermi [2011] A.A. Abdo et al., Astrophys. J. 734 (2011) 28.
- Zirakashvili, Aharonian [2010] V.N. Zirakashvili, F.A. Aharonian, Astrophys. J.708 (2010) 965.
- Ellison et al. [2012] D.C. Ellison et al., Astrophys. J. 744 (2012) 39.
- Inoue et al. [2012] T. Inoue et al. Astrophys. J. 744 (2012) 71.
- Gabici and Aharonian [2014] S. Gabici, F.A. Aharonian, arXiv:1406.2322v1 [astro-ph.HE].
- Aschenbach [1998] B. Aschenbach, Nature 396 (1998) 141.
- Slane et al. [2001] P. Slane et al., Astrophys. J. 548 (2001) 814.
- Bamba et al. [2005] A. Bamba et al., Astrophys. J. 632 (2005) 294.
- Duncan & Green [2000] A.R. Duncan, D.A. Green, A&A 364 (2000) 732.
- Aharonian et al. [2005] F.A. Aharonian et al.,A&A 437 (2005) L7.
- Aharonian et al. [2007] F.A. Aharonian et al., Astrophys. J. 661 (2007) 236.
- Fermi [2011] T. Tanaka et al.,, Astrophys. J. 740 (2011) L41.
- Berezhko et al. [2009] E.G. Berezhko et al., Astron. Astrophys. 505 (2009) 641.
- Lee et al. [2012] S.H. Lee et al., Astrophys. J. 767 (2013) 20.
- Berezhko and Völk [2000b] E.G. Berezhko, H.J. Völk, Astrophys. J. 540 (2000) 923.
- Ackermann et al. [2012] M. Ackermann et al., Astrophys. J. 750 (2012) 3.
- Strong [2007] A.W. Strong, AApSS 309 (2007) 35.
- Völk and Berezhko [2013] H.J. Völk, E.G. Berezhko, Astrophys. J. 777 (2013) 149.
- Reynolds et al. [1993] P.T. Reynolds et al., Astrophys. J. 404 (1993) 206.
- Amenomori et al. [2005] M. Amenomori et al., in: Proc. 29th ICRC (Pune, 2005) 4, 43
- Abdo et al. [2009a] A.A. Abdo et al., Astrophys. J. 688 (2008) 1078.
- Ma et al. [2011] L.L. Ma et al., in: Proc. 32nd ICRC, Beijing 2011, doi: 10.7529/ICRC2011/V07/0256.
- Aharonian et al. [2001] F.A. Aharonian et al., A&A 375 (2001) 1008.
- LeBohec et al. [2000] S. LeBohec et al., Astrophys. J. 539 (2000) 209.