2014 Vol. X No. XX, 000–000
22institutetext: Physical Research Laboratory, Navarangpura, Ahmedabad-380009, India.
33institutetext: Korea University of Science and Technology (UST), Korea.
\vs\noReceived ; accepted
Near-infrared studies of nova V5584 Sgr in the pre-maximum and early decline phase ∗
Abstract
We present near-infrared spectroscopic and photometric observations of nova V5584 Sgr taken during the first 12 days following its discovery on Oct. 26.439 UT 2009. The evolution of the spectra is shown from the initial P Cygni phase to an emission line phase. The prominent carbon lines seen in the spectra closely match those observed in a FeII class nova outburst. The spectra show first-overtone CO bands in emission between 2.29-2.40 m. By examining WISE and other publicly available data, we show that the nova underwent a pronounced dust formation phase during February - April 2010.
keywords:
infrared: spectra - line : identification - stars : novae, cataclysmic variables - stars : individual (V5584 Sgr) - techniques : spectroscopic;1 Introduction
Nova Sagittarii 2009 No. 4 (V5584 Sgr) was discovered on Oct. 26.439 UT 2009 by Nishiyama and Kabashima on two 60s unfiltered CCD frames at a magnitude of 9.3 in V (Nishiyama et al. (2009)). Nothing was visible at this position on their two survey frames taken respectively on Oct 20.449 UT 2009 with limiting magnitude 13.9 and Oct. 21.451 UT 2009 with limiting magnitude 13.4. Corelli (2009) has reported that nothing was visible at the nova position on the Palomar plate (limiting magnitude 21) taken on Oct. 26.764 UT 2008.
A low-resolution optical spectrum obtained by Kinugasa et al. (2009) on Oct. 27.4 UT 2009, with the 1.5m telescope at Gunma Astronomical Observatory showed hydrogen Balmer series absorption lines, with H having a prominent P-Cygni profile and a full width at half-maximum (FWHM) of about 600 km s-1 suggesting the object to be a nova in its early stage. The absorption minimum of the H was blue-shifted by 900 km s-1 from the emission peak. Another low-resolution spectrum obtained by Maehara (2009) on Oct. 27.42 UT 2009 also showed a similar profile of the H line, suggesting that the object is a classical nova. Munari et al. (2009) have taken low-, medium-, and high-resolution spectra for this nova with the 0.6m telescope of the Schiaparelli Observatory in Varese. The low- and medium-resolution spectra taken on Oct. 28.73 UT 2009 show a well developed and highly reddened absorption continuum. The FWHM of the absorption lines are 310 km s-1. The heliocentric radial velocity of the absorption lines were -283 km s-1 and the separation between the absorption and emission components was 440 km s-1. The high resolution echelle spectra taken on Oct. 29.72 UT 2009 show very weak emission from Balmer and Fe II multiplets. They report V magnitudes of 9.74, 9.31 and 9.21 on Oct. 27.719 UT, 28.709 UT and 29.708 UT 2009, respectively. Munari et al. (2009) have pointed out that the object is a nova of Fe II class and approaching the optical maximum.
The near-infrared (NIR) spectrum taken by Raj et al. (2009) on Oct. 29.58 UT 2009 showed the strong P-Cygni profiles for H I, O I, C I and N I lines. Subsequent observations show strengthening of the emission components and the first overtone CO bands was detected in the spectrum taken on Nov. 5.64 UT 2009. The near-IR observations obtained on Feb. 10 UT 2010 by Russell et al. (2010), after V5584 Sgr came out of the solar conjunction, showed the dust formation in the nova ejecta and the dust temperature was estimated as 880 50 K. The optical spectra taken on Jun. 4 and Aug. 10 UT 2010 by Poggiani (2011) show that the nova had entered the nebular phase.
2 Observations
The near-IR observations were obtained using the 1.2m telescope of Mt. Abu Infrared Observatory from Oct. 28.59 to Nov. 8.56 UT 2009 covering one epoch before the optical maximum and the early decline phase. The spectra were obtained at a resolution of 1000 using a Near-Infrared Imager/Spectrometer with a 256 256 HgCdTe NICMOS3 array. Spectral calibration was done using the OH sky lines that register with the stellar spectra. The spectra of the comparison star SAO 161520 (spectral type A1V; effective temperature 9230 K) were taken at similar airmass as that of V5584 Sgr to ensure that the ratioing process (nova spectrum divided by the standard star spectrum) removes the telluric features reliably. The H I absorption lines in the spectra of standard star were removed manually before ratioing to avoid artificially generated emission lines in the ratioed spectrum. The ratioed spectra were then multiplied by a blackbody curve corresponding to the standard star’s effective temperature to yield the final spectra.
| Date of | Days since | Integration time (s) | Integration time (s) | Nova Magnitude | ||||||
|---|---|---|---|---|---|---|---|---|---|---|
| Observation (UT) | optical max | J-band | H-band | K-band | J-band | H-band | K-band | J-band | H-band | K-band |
| Spectroscopic Observations | Photometric Observations | |||||||||
| 2009 Oct. 28.59 | -1.12 | – | – | – | 250 | 220 | 105 | 6.970.04 | 6.650.04 | 6.450.07 |
| 2009 Oct. 29.58 | -0.13 | 60 | 50 | 90 | 25 | 110 | 50 | – | – | 6.280.06 |
| 2009 Oct. 30.58 | 0.87 | – | – | – | 75 | 110 | 30 | 6.920.05 | 6.530.03 | 6.330.04 |
| 2009 Nov. 02.59 | 3.88 | – | – | – | 50 | 110 | 105 | 6.900.02 | 6.640.04 | 6.370.06 |
| 2009 Nov. 03.59 | 4.88 | 120 | 120 | – | – | – | – | – | – | – |
| 2009 Nov. 04.60 | 5.89 | 90 | – | – | 75 | 110 | 30 | 7.200.06 | 6.880.05 | 6.450.04 |
| 2009 Nov. 05.64 | 6.93 | 90 | 90 | 90 | – | – | – | – | – | – |
| 2009 Nov. 06.58 | 7.87 | 90 | 90 | – | 75 | 110 | 50 | 7.360.03 | 7.160.02 | 6.830.06 |
| 2009 Nov. 07.61 | 8.90 | – | – | – | 100 | 50 | – | 7.840.02 | 7.600.08 | – |
| 2009 Nov. 08.56 | 9.85 | 120 | 120 | 120 | 125 | 75 | 55 | 7.860.04 | 7.660.03 | 7.380.07 |
The photometry was done in clear sky conditions using the NICMOS3 array in the imaging mode in bands. Several frames were obtained in all the bands, in 4 dithered positions, offset by 30 arcsec. The sky frames, which are subtracted from the nova frames, were generated by median combining the dithered frames. The star SAO 161520 (with the -band magnitudes of 4.803, 4.622 and 4.360, respectively) located close to the nova was used for photometric calibration. All data reduction and analysis were done using . The log of the spectroscopic and photometric observations and the magnitudes are given in Table 1.
| Wavelength | Species | Other contributing |
| (m) | lines and remarks | |
| 1.0938 | Pa | |
| 1.1287 | O i | |
| 1.1330 | C i | |
| 1.1381-1.1404 | Na i | C i 1.1415 |
| 1.1600-1.1674 | C i | strongest lines at 1.1653, |
| 1.1659,1.16696 | ||
| 1.1748-1.1800 | C i | strongest lines at 1.1748, |
| 1.1753,1.1755 | ||
| 1.11819-1.1896 | C i | |
| 1.1819-1.2614 | C i, N i | blend of sveral C i and N i lines |
| 1.2461,1.2469 | N i | blended with O i 1.2464 |
| 1.2562,1.2569 | C i | blended with O i 1. 2570 |
| 1.2818 | Pa | |
| 1.3164 | O i | |
| 1.5256 | Br 19 | |
| 1.5341 | Br 18 | |
| 1.5439 | Br 17 | |
| 1.5557 | Br 16 | |
| 1.5701 | Br 15 | |
| 1.5749 | Mg i | blended with Mg i 1.5741, |
| 1.5766,C i 1.5788 | ||
| 1.5881 | Br 14 | blended with C i 1.5853 |
| 1.6005 | C i | |
| 1.6109 | Br 13 | |
| 1.6407 | Br 12 | |
| 1.6806 | Br 11 | |
| 1.6890 | C i | |
| 1.7045 | C i | |
| 1.7109 | Mg i | |
| 1.7362 | Br 10 | affected by C i 1.7339 line |
| 1.7449 | C i | |
| 1.7605-1.7638 | C i | |
| 2.1156-2.1295 | C i | |
| 2.1655 | Br | |
| 2.2056,2.2084 | Na i | |
| 2.2156-2.2167 | C i | |
| 2.29-2.40 | CO | v=2 bands |
| 2.2906 | C i | |
| 2.3130 | C i | |
| 2.3348 | Na i | |
| 2.3379 | Na i |
3 Results
We describe the key results in the following sub-sections.
3.1 General characteristics of and light curves
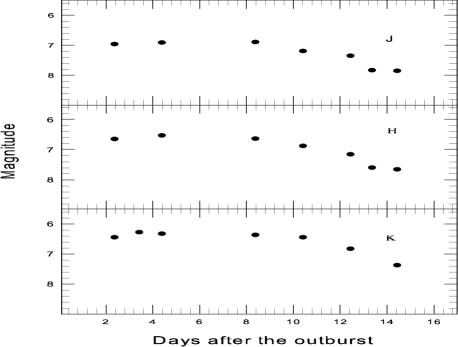
The band light curve based on the data from AAVSO and the band light curves from Mt. Abu Observatory are presented in Figures 1 and 2, respectively. The nova reached a maximum value of = 9.2 on Oct. 29.71 UT 2009. We estimate (time taken by the nova to decline by 2 magnitudes from the optical maximum) to be 25 1 d from a least square regression fit to the post maximum light curve. We determine the absolute magnitude of the nova to be MV = -7.7 0.2 using the maximum magnitude versus rate of decline (MMRD) relation of della Valle & Livio (1995). We derive the reddeing = 0.94 from Schlafly & Finkbeiner (2011) towards the direction of the nova which gives interstellar extinction AV = 2.9 for R = 3.1. Using the distance modulus relation, we obtain a value of the distance = 6.3 0.5 kpc to the nova. Using this value of and the Galactic latitude of the nova -3.1 deg, we estimate the height of the nova to be = 341 30 pc below the Galactic plane. The outburst bolometric luminosity of V5584 Sgr as calculated from MV is LO 1.1 105 L⊙. As there are no observations after 30 days from the discovery date due to the solar conjuction of the nova we estimate the time taken by the nova to decline by 3 magnitudes from the optical maximum = 46 1 d by using the relation = 2.7()0.88 of Warner (1995). The observed value of the outburst amplitude (difference between the limiting magnitude of detection and the optical maximum magnitude) = 12 and = 25 days for V5584 Sgr is consistent with the outburst amplitude versus decline rate plot for classical novae presented by Warner (2008) which shows = 10 - 13 for = 25 days.
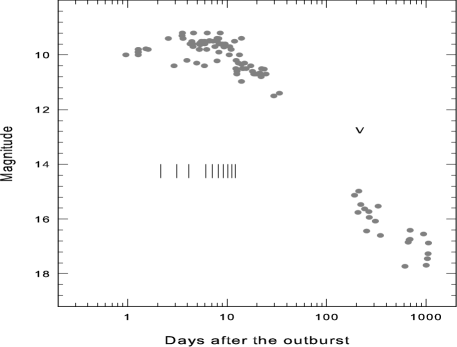
A classification scheme of novae based on the optical light curves is presented by Strope et al. (2010). Such a classification is based on the post-maximum time when the light curve declined by 3.0 magnitudes, namely and the shape of the light curve. We classify the optical light curve of V5584 Sgr as D(46) according to the estimated value of (46 days), where D(46) denotes the dust formation as discussed later in subsection 3.5.
3.2 Line identification, evolution and general characteristics of the spectra
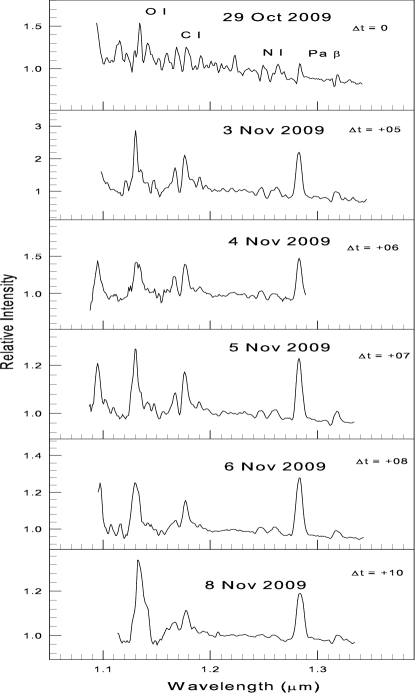
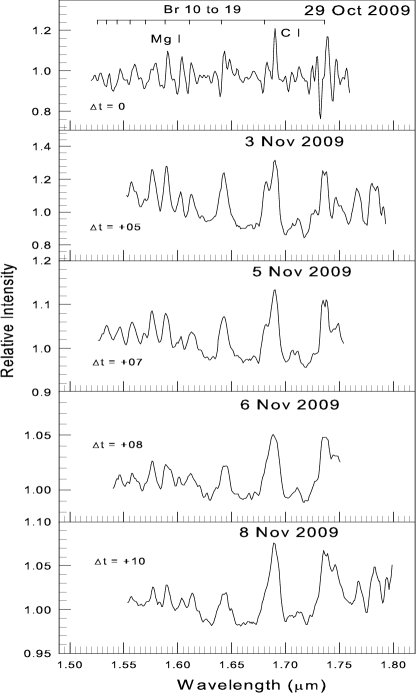
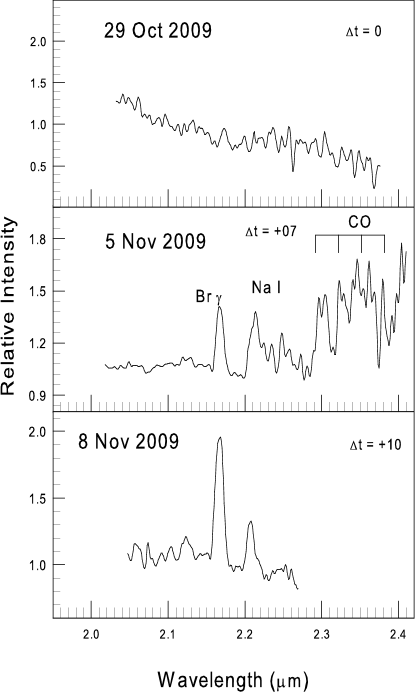
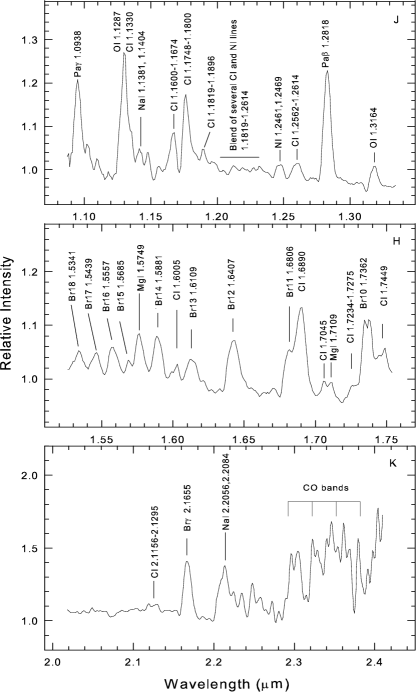
The spectra are presented in Figures 3 to 5 respectively and the line identification in graphical and tabular form are given in Fig. 6 and Table 2, respectively. The near-IR observations presented here cover the pre-maximum light to early post-maximum decline. The first infrared spectra taken on Oct. 29.58 UT 2009 are dominated by lines of hydrogen, neutral nitrogen, carbon and oxygen with prominent P-Cygni profiles. The FWHM of the absorption and emission components of the Pa line are 400 and 560 km s-1 and the separation between the absorption and emission peaks for all the lines is typically in the range of 550-650 km s-1. The next spectra taken on Nov. 3.59 UT 2009 show considerable strengthening of the emission components having P-Cygni absorption with reduced intensity. Spectral templates in the NIR for the characteristic spectra of the Fe II and He/N class of novae have been presented by Banerjee & Ashok (2012). The essential NIR spectral features that distinguish between the Fe II and He/N class of novae are the strong carbon lines in the former class. The spectra presented here show the presence of carbon lines at 1.166 m and 1.175 m in the band, 1.689 m and several lines between 1.72 m and 1.79 m in the band and lines between 2.11 m to 2.13 m and 2.29 m to 2.31 m lines in the band. Thus the carbon rich spectra indicate that V5584 Sgr belongs to Fe II class. The presence of Na and Mg lines (e.g., Na I 2.2056m, 2.2084m) in the spectrum can be regarded as an indicator of dust formation in the nova ejecta (Das et al. (2008)) and this gets further support from the analysis of the 3- to 14-m spectroscopy (Russell et al. (2010)).
3.3 First overtone CO detection and modeling
The first K band spectrum taken on Oct. 29.58 UT 2009, very close to optical maximum, does not show evidence for first overtone CO emission at 2.29 m and beyond. It is possible that CO was present at this stage but below or just at the detection level (see Raj et al. (2011)). Nevertheless, we notice that the K-band spectrum taken on Nov. 5.64 UT 2009 shows clear evidence for first overtone CO emission. This is one of the most interesting result in V5584 Sgr since CO detections are very rare in novae. Among more than 300 Galactic novae, only 9 are found to show CO emissions (i.e., 3). The next K band spectra taken on Nov. 8.56 UT 2009 does not cover the CO emission region so it is not possible to comment on the duration of the CO emission. Based on the detailed studies by Das et al. (2009) and Raj et al. (2012), we have compiled in Table 3 the complete list of novae known to have shown first overtone CO emission. Theoretically, Pontefract & Rawlings (2004) pointed out that CO should form early after outburst and remain approximately constant in strength for 12-15 days thereafter and then get rapidly destroyed. The early appearance of CO in V5584 Sgr is consistent with the predictions. It may be mentioned that models for CO emission as developed by Rawlings (1988) and Pontefract & Rawlings (2004) found that the outer parts of the ejecta have to be much denser and less ionized than the bulk of the wind which favors the formation of substantial molecules. Carbon has to be neutral and in such a neutral carbon region, the carbon ionization continuum, which extends to less than 1102Å, shields several molecular species against the dissociative UV flux from the central star. The relatively denser and cooler environment that is conducive for molecular growth also favors dust formation and every CO forming nova has always been known to form dust. However, the converse case has not be seen. The reason for the non detection of CO in other dust forming novae is not known. A possible reason for the non detection of CO emission in novae with dust formation is the paucity of near-infrared spectral observations in the early phase of nova evolution and its shorter duration. Alternatively, in these novae either CO did not form for reasons which are not clearly understood or it was present but below the detection limit of observations.
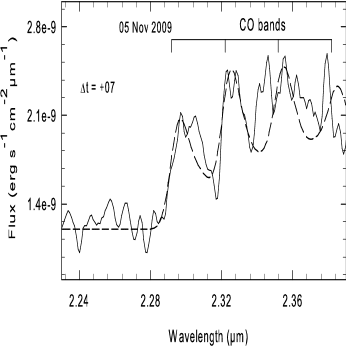
We used the model developed by Das et al. (2009) in the case of V2615 Oph to characterize the CO emission in V5584 Sgr (Fig. 7). Compared to V2615 Oph, the CO detection here is only for one epoch and the S/N of the spectrum is poor (approximately 10) and thus not conducive for accurate modeling. However, since CO detections are rare, it is desirable to have rough model estimates of the CO parameters even if such estimates are not quite accurate. In the model calculations the CO gas is considered to be in thermal equilibrium with the same temperature for calculating the level populations of rotation and vibration bands (see Das et al. (2009) for more details). The data covers only three of the bands ( = 2-0, 3-1, 4-2) and the C I lines at 2.2906 and 2.3130 m are likely blended with Na I lines at 2.3348 and 2.3379 m, thereby giving rise to further complications. Allowing for all these factors, we estimate the temperature to be 3500 750 K and constrain the upper limit for the mass of the CO gas to be in the range 1-6 10-8 M⊙. The errors are fairly large but the central values of the mass and temperature are very similar to the values obtained in V2615 Oph (Das et al. (2009)) and V496 Sct (Raj et al. (2012)). We do not make any attempt to determine the 12C/13C ratio given the low S/N ratio of the spectrum.
3.4 Fireball phase
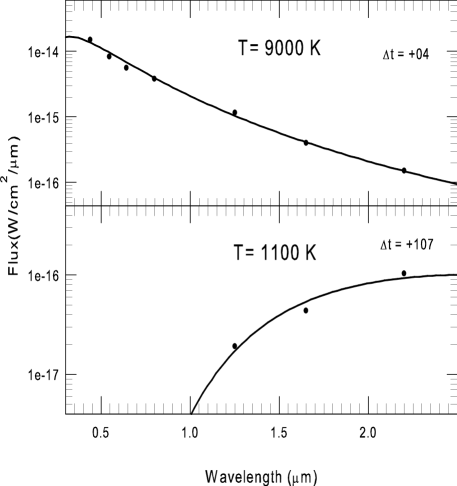
The continuum from a nova’s ejecta near maximum light is known to mimic the photosphere of an A-F spectral type star (Gehrz (2008)). The spectral energy distribution (SED) of the pseudo-photosphere during this fireball stage is generally well approximated by a blackbody. As V5584 Sgr showed pre-maximum rise and has a well-defined optical maximum we have constructed the SED to study the fireball phase for the nova. Using the AAVSO data for the following optical magnitudes =10.4, =9.5, =8.7 and=7.6 for Nov. 2 UT 2009 along with the present magnitudes of Nov. 2.59 UT 2009, we derived the SED in the fireball phase. The observed magnitudes were corrected for extinction using Schlafly & Finkbeiner (2011). We obtain a temperature of = 9000 500 K from a balckbody fit to the SED shown in the top panel of Fig. 8. This is consistent with the A-F spectral type for the pseudo-photospheres displayed by novae at outburst (Gehrz (2008)). Using the relation given by Ney & Hatfield (1978), the blackbody angular diameter in arcseconds is calculated, viz,
where = 6.56 10-15 W cm-2 and = 9000 K. We obtain a value of 0.2 milliarcsec for the angular diameter. This value for the angular diameter can be used to estimate the distance to the nova by assuming a constant expansion rate for the ejecta and the relation given by Gehrz (2008), which follows as
where d is in kpc, in km s-1, t is time after the outburst in days and in milliarcsec. The estimated value of will always be a lower limit since it is applicable for a blackbody (Ney & Hatfield (1978); Gehrz et al. (1980)). Taking = 0.2 milliarcsec estimated above and a value of 600 km s-1 observed for the FWHM of the emission line profile of Pa line in the spectrum taken on Nov. 3.59 UT 2009 for , we get d = 24 kpc. This value for d is about a factor of 4 larger than the distance derived earlier in section 3.1 and indicates that the psudo-photosphere behaves like a grey body with reduced emissivity (see Das et al. (2008), Raj et al. (2011)).
3.5 Dust formation and ejecta mass estimate
The detection of the CO first overtone emission in the spectrum taken on Nov. 5.64 UT 2009 is consistent with the detection of the dust in the nova ejecta reported by Russell et al. (2010) on Feb. 10 UT 2010. Although a decline in brightness at optical wavelengths is expected at the time of dust formation, the lack of observations from 30 till 110 days after the discovery due to the solar conjuction is the likely reason for absense of a sharp fall in the band light curve shown in Fig. 1. The dust formation most likely took place during this time period. The thermal emission from the dust contributes to the near-IR bands and one expects a brightening at these wavelengths.Although our NIR photometric observations presented in Fig. 2 do not cover the dust formation phase, data is available in the Stony Brook database (SMARTS Spectral Atlas of Southern Novae) which clearly shows a brightening in the band from Feb. 14 UT 2010 (,Walter et al. (2012)). From this database, using magnitudes obtained on Feb. 14 UT 2010 (11.36 mag in J, 9.05 mag in H and 6.78 mag in K), we estimate a value of 1100 200 K for the dust shell temperature from the SED plot shown in the lower panel of Fig. 8. It is possible that the thermal emission from the dust, which is seen to be increasing upto the band, peaks at even longer wavelengths.
An approximate estimate of the mass of the dust shell can be made from the thermal component of the SED of Feb. 14 UT 2010 shown in Fig. 8 (lower panel). Using the Woodward et al. (1993) relation, we have calculated the mass of the dust shell, viz,
The mass of the dust shell is in units of , is in W cm-2, the black-body temperature of the dust shell Tdust is in units of 103 K, and the distance to the nova d is in kpc in above relation.
We obtain = 7.35 10-9 for Feb. 14 UT 2010 taking the observed parameters of = 2.98 10-16 W cm-2, = 1.1 103 K and d = 6.3 kpc. Taking a canonical value of 200 for the gas-to-dust ratio, we get 1.5 10-7 M⊙ for the gaseous component of the ejecta. This value is smaller than the typically observed value of 10-6 to 10-4 M⊙.
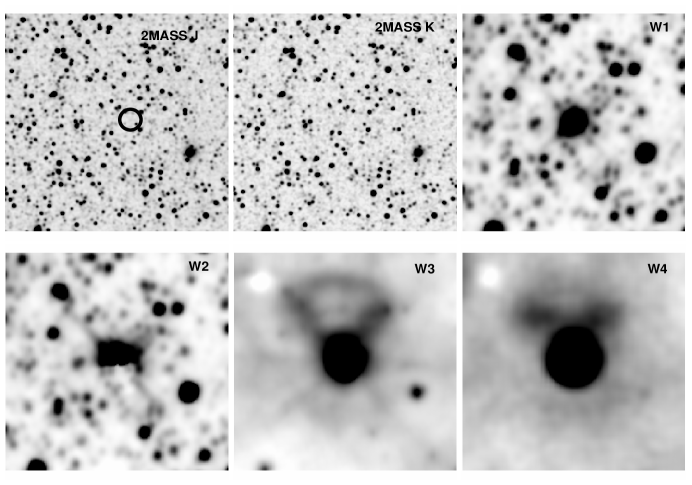
The reasons for the lower mass estimate could be several. It is possible that dust condensation has occurred only in certain regions and not over the entire extent of the ejecta. Further, the black body temperatures may not represent the actual dust temperatures in an accurate manner for two reasons. First, the emissivity of the dust grains depends on their composition and size distribution and the frequency dependence of the emissivity can deviate from that of a blackbody (Kruegel (2003)). Second, the data used for fitting the SED covers only the 1 to 2.5 m region resulting in overestimation of the dust temperature as emission at longer wavelengths is not considered. The dust mass is very sensitive to and its correct estimate should result in enhanced dust mass. The lower dust temperature of 880 50 K derived by Russell et al. (2010) from the 3 to 14 m spectroscopic observations indicate that there is significant contribution at longer wavelengths. The observations from the Wide field Infrared Survey Explorer (WISE) also support emission from the dust at longer wavelengths. WISE detects the source in all the 3.4 (W1), 4.6 (W2), 12 (W3) and 22 m (W4) bands; the emission at the longer W3, W4 bands is very pronounced.
A few notes on the WISE images in Fig. 9 are necessary. The W1 and W2 images were taken at two epochs separated by nearly six months apart namely on Mar. 27 and Sep. 28 UT 2010. These double-epoch images appear to have been combined for the resultant W1, W2 images available at the WISE portal and which are presented here in the figure. For reasons that are not clear, in the process of combining the images certain artifacts have been created in the W2 image and the image of V5584 Sgr were smeared out and also partially obliterated. This is the likely reason why none of the W1, W2, W3 or W4 magnitudes are reported for the source. On the other hand the W3 and W4 images were taken on two very nearby epochs namely on Mar. 27 and Apr. 06 UT 2010 which give a good qualitative idea that pronounced dust emission is present in these wavebands.
| Nova | Detection epoch | Reference |
| after outburst (days) | ||
| NQ Vul | 19 | Ferland et al. (1979) |
| V842 Cen | 25 | Wichmann et al. (1991) |
| V705 Cas | 6 | Evans et al. (1996) |
| V2274 Cyg | 17 | Rudy et al. (2003) |
| V2615 Oph | 9 | Das et al. (2009) |
| V5584 Sgr | 12 | This work |
| V496 Sct | 19 | Rudy et al. (2009) Raj et al. (2012) |
| V2676 Oph | 37 | Rudy et al. (2012b) |
| V1724 Aql | 7 | Rudy et al. (2012a) |
4 Summary
We have presented near-infrared spectroscopy and photometry of nova V5584 Sgr which erupted on Oct. 26.439 UT 2009. From the optical light curve, V5584 Sgr is seen to be a moderately fast nova with = 25 days and a light curve classification of D(46) following the classification scheme of Strope et al. (2010). The distance to the nova and its height below the Galactic plane are estimated to be 6.3 0.5 kpc and 341 30 pc, respectively. The outburst bolometric luminosity of V5584 Sgr as derived from its estimated MV is LO 1.1 105 L⊙. The infrared spectra indicates that the nova is of the Fe II type. The first overtone CO emission is the notable feature of the near-infrared spectrum in the early decline phase. The CO emission is modeled to make estimates of the CO mass and temperature. We discuss dust formation in the nova and make estimates of the mass of the dust and the gas in the ejecta.
5 Acknowledgements
The research work at the Physical Research Laboratory is funded by the Department of Space, Government of India. We are grateful for the availability of AAVSO (American Association of Variable Star Observers) optical photometric data, WISE near and mid-infrared data and near-IR magnitudes from the STONY BROOK/SMARTS data collection. The authors are thankful to the anonymous refree for assiduous comments that improved the manuscript.
References
- Banerjee & Ashok (2012) Banerjee, D. P. K., & Ashok, N. M. 2012, Bulletin of the Astronomical Society of India, 40, 243
- Corelli (2009) Corelli, P. 2009, Central Bureau Electronic Telegrams, 1994, 1
- Das et al. (2009) Das, R. K., Banerjee, D. P. K., & Ashok, N. M. 2009, MNRAS, 398, 375
- Das et al. (2008) Das, R. K., Banerjee, D. P. K., Ashok, N. M., & Chesneau, O. 2008, MNRAS, 391, 1874
- della Valle & Livio (1995) della Valle, M., & Livio, M. 1995, ApJ, 452, 704
- Evans et al. (1996) Evans, A., Geballe, T. R., Rawlings, J. M. C., & Scott, A. D. 1996, MNRAS, 282, 1049
- Ferland et al. (1979) Ferland, G. J., Lambert, D. L., Netzer, H., Hall, D. N. B., & Ridgway, S. T. 1979, ApJ, 227, 489
- Gehrz (2008) Gehrz, R. D. 2008, in Bode M.F., Evans A., eds, Classical Novae, 2nd Edn. Cambridge Univ. Press, Cambridge, p167
- Gehrz et al. (1980) Gehrz, R. D., Grasdalen, G. L., Hackwell, J. A., & Ney, E. P. 1980, ApJ, 237, 855
- Kinugasa et al. (2009) Kinugasa, K., Honda, S., Hashimoto, O., Taguchi, H., & Takahashi, H. 2009, Central Bureau Electronic Telegrams, 1995, 1
- Kruegel (2003) Kruegel, E. 2003, The Physics of Intersteller Dust, The Institute of Physics Ser. in Astron. & Astrophys., Bristol
- Maehara (2009) Maehara, H. 2009, Central Bureau Electronic Telegrams, 1995, 2
- Munari et al. (2009) Munari, U., Saguner, T., Siviero, A., et al. 2009, Central Bureau Electronic Telegrams, 1999, 1
- Ney & Hatfield (1978) Ney, E. P., & Hatfield, B. F. 1978, ApJ, 219, L111
- Nishiyama et al. (2009) Nishiyama, K., Kabashima, F., & Corelli, P. 2009, Central Bureau Electronic Telegrams, 1994, 1
- Poggiani (2011) Poggiani, R. 2011, Ap&SS, 333, 115
- Pontefract & Rawlings (2004) Pontefract, M., & Rawlings, J. M. C. 2004, MNRAS, 347, 1294
- Raj et al. (2011) Raj, A., Ashok, N. M., & Banerjee, D. P. K. 2011, MNRAS, 415, 3455
- Raj et al. (2009) Raj, A., Ashok, N. M., Banerjee, D. P. K., & Hornoch, K. 2009, Central Bureau Electronic Telegrams, 2002, 1
- Raj et al. (2012) Raj, A., Ashok, N. M., Banerjee, D. P. K., et al. 2012, MNRAS, 425, 2576
- Rawlings (1988) Rawlings, J. M. C. 1988, MNRAS, 232, 507
- Rudy et al. (2003) Rudy, R. J., Dimpfl, W. L., Lynch, D. K., et al. 2003, ApJ, 596, 1229
- Rudy et al. (2012a) Rudy, R. J., Laag, E. A., Crawford, K. B., et al. 2012a, Central Bureau Electronic Telegrams, 3287, 1
- Rudy et al. (2009) Rudy, R. J., Prater, T. R., Puetter, R. C., Perry, R. B., & Baker, K. 2009, IAU Circ., 9099, 1
- Rudy et al. (2012b) Rudy, R. J., Russell, R. W., Sitko, M. L., et al. 2012b, Central Bureau Electronic Telegrams, 3103, 1
- Russell et al. (2010) Russell, R. W., Laag, E. A., Rudy, R. J., Skinner, M. A., & Gregory, S. A. 2010, IAU Circ., 9118, 2
- Schlafly & Finkbeiner (2011) Schlafly, E. F., & Finkbeiner, D. P. 2011, ApJ, 737, 103
- Strope et al. (2010) Strope, R. J., Schaefer, B. E., & Henden, A. A. 2010, AJ, 140, 34
- Walter et al. (2012) Walter, F. M., Battisti, A., Towers, S. E., Bond, H. E., & Stringfellow, G. S. 2012, PASP, 124, 1057
- Warner (1995) Warner, B. 1995, Cataclysmic Variable Stars, Cambridge Astrophys. Ser. Cambridge Univ. Press
- Warner (2008) Warner, B. 2008, in Bode M.F., Evans A., eds, Classical Novae, 2nd Edn. Cambridge Univ. Press, Cambridge, p21
- Wichmann et al. (1991) Wichmann, R., Krautter, J., Kawara, K., & Williams, R. E. 1991, in The Infrared Spectral Region of Stars, edited by C. Jaschek & Y. Andrillat, 353
- Woodward et al. (1993) Woodward, C. E., Lawrence, G. F., Gehrz, R. D., et al. 1993, ApJ, 408, L37