Critical adsorption of polyelectrolytes onto charged Janus nanospheres
Abstract
Based on extensive Monte Carlo simulations and analytical considerations we study the electrostatically driven adsorption of flexible polyelectrolyte chains onto charged Janus nanospheres. These net-neutral colloids are composed of two equally but oppositely charged hemispheres. The critical binding conditions for polyelectrolyte chains are analysed as function of the radius of the Janus particle and its surface charge density, as well as the salt concentration in the ambient solution. Specifically for the adsorption of finite-length
polyelectrolyte chains onto Janus nanoparticles, we demonstrate that the critical adsorption conditions drastically differ when the size of the Janus particle or the screening length of the electrolyte are varied. We compare the scaling laws obtained for the adsorption-desorption threshold to the known results for uniformly charged spherical particles, observing significant disparities. We also contrast the changes to the polyelectrolyte chain conformations and the binding energy distributions close to the adsorption-desorption transition for Janus nanoparticles to those for simple spherical particles. Finally, we discuss experimentally relevant physico-chemical systems for which our simulations results may become important. In particular, we observe similar trends with polyelectrolyte complexation with oppositely but heterogeneously charged proteins.
Abbreviations: ES, electrostatic; PE, polyelectrolyte; JNS, Janus nanosphere; WKB, Wentzel-Kramers-Brillouin.
I Introduction
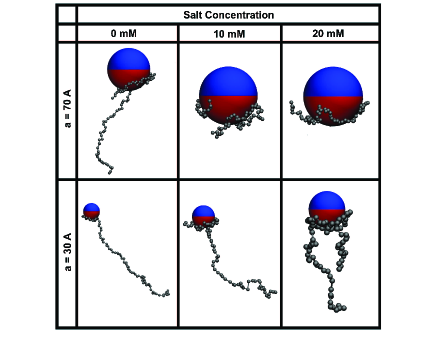
Janus grains de Gennes (1992) or particles of spherical, cylindrical, or disc-like architecture are nanoparticles whose surface is divided into two or more areas with distinct physico-chemical properties. For instance, the behaviour of Janus particles with one apolar hydrophobic half and a polar or charged half Walther and Mueller (2008) share common features with surfactant assembly in solutions Hong et al. (2008). Charged Janus nanospheres (JNSs), our main focus in this study, exhibit two oppositely charged hemispheres. We study in detail the critical adsorption conditions for a polyelectrolyte chain, see Fig. 1. From extensive Monte Carlo simulations as well as analytical calculations we demonstrate that the adsorption behaviour to JNS significantly differs from that to homogeneously charged spheres. The polyelectrolyte adsorption is investigated with respect to changes in the size of JNSs and salinity of the electrolyte.
Janus particles have become widely used model systems. Thus, orientation-sensitive interactions between JNSs de Graaf et al. (2012) are extensively used in directed supra-molecular hierarchical assembly Granick et al. (2009); Jiang and et al. (2010). Janus particles are promising candidates for designing novel materials, responsive sensor nano-devices, biomedical and pharmaceutical applications, anti-reflection coatings, stabilising liquid-liquid interfaces, as well as nanoscale chemical locomotion Walther and Mueller (2008); Glaser and et al. (2006); Chen (2012); Du and O Reilly (2011). “Hairy” Janus particles decorated via grafting Tagliazucchi and Szleifer (2012) of various polymers Chen (2012) reveal rich stimuli-responsive behaviour Berger and et al. (2008) and can serve as coatings of immiscible liquid-liquid interfaces Walther et al. (2008); Glaser et al. (2006).
The weak and strong adsorption of polyelectrolytes (PEs) onto oppositely charged interfaces has a number of important technological and biological applications Winkler and Cherstvy (2014). These include, inter alia, paper production, various surface coating techniques, colloid stabilisation, adsorption of nucleic acids on the interior of viral shells, DNA wrapping in nucleosomes, pharmacological applications, etc. Of particular interest is the regime of weak adsorption, referring to weakly charged PEs below the Manning’s counterion condensation limit Manning (1978, 2007), i.e., charge-charge distances along the PE contour are shorter than the Bjerrum length . A fundamental feature of weak PE adsorption is the transition between the entropically driven free state of the PE chain in solution and the bound state close to the interface. The latter is favoured by electrostatic (ES) PE-surface attractions, which are typically screened exponentially by the surrounding electrolyte in a Debye-Hückel fashion. This transition defines the condition for the critical adsorption of PE chains, at which the entropic penalty of PE confinement near the interface is exactly balanced by the energetic attraction to the surface. At larger electrolyte salinities the PE-surface attractions are better screened and thus larger surface charge densities are necessary to trigger the adsorption. The study of this transition for dipolar JNSs is the main target of the present study, as depicted in Fig. 1.
Theoretically, the adsorption of PE chains onto uniformly charged surfaces was studied to great detail, see, e.g., Refs. Netz and Andelman (2003); Dobrynin and Rubinstein (2005); Dobrynin (2008); Winkler and Cherstvy (2014); Shafir and Andelman (2004); Boroudjerdi and Netz (2005); Netz and Joanny (1999a); Rudnick et al. (2000); Sens and Joanny (2000); Schiessel (2003); Messina (2009); de Vries and Cohen-Stuart (2006); Podgornik and Licer (2006); Szilagyi and et al. (2014); Boroudjerdi et al. (2014); Shin et al. (2014). The regime of weak PE-surface adsorption for which the entropy of the PE chain is still important, was extensively studied by computer simulations Kong and Muthukumar (1998); Akinchina and Linse (2002); Carrillo and Dobrynin (2012); Nandy and Maiti (2011); Cao and Bachmann (2013); Nunes et al. (2013); Faraudo and Martin-Molina (2013); Luque-Caballero et al. (2014); Man and Yan (2010); Wang and et al. (2011); Huang and Ruckenstein (2012); Kampmann et al. (2013); de Carvalho and Caetano (2013). The characteristics of the PE-surface adsorption including the conditions for the critical adsorption of long PE chains with a constant linear charge density onto planar Wiegel (1977); Muthukumar (1987) and curved van Goeler and Muthukumar (1994); Baumgaertner and Muthukumar (1991); Netz and Joanny (1999b); Winkler and Cherstvy (2006); Cherstvy and Winkler (2006); Winkler and Cherstvy (2007); Cherstvy and Winkler (2011); Wang and Muthukumar (2011); Winkler and Cherstvy (2014); Cherstvy (2012); Cherstvy and Winkler (2012); de Carvalho (2010); Forsman (2012) interfaces were also derived. Apart from the more conventional strong PEs, the adsorption of weak charge-regulated PEs and poly-ampholyte chains onto spherical particles was investigated by computer simulations Carnal and Stoll (2011); Ulrich et al. (2011, 2005) as well as experiment Chen and et al. (2011); Kayitmazer and et. al. (2013).
The paper is organised as follows. In Sec. II we set the scene by briefly reviewing the main results for the critical PE adsorption onto planar and curved surfaces. Sec. III elucidates the PE adsorption onto JNSs and discusses the core results of the current paper obtained from extensive Metropolis Monte-Carlo computer simulations. We vary the solution salinity, the particle radius, and the length of polymer chains to unveil their impact on the location of the adsorption-desorption boundary. In Sec. V we discuss our results, outline their possible applications, and draw our conclusions. App. A details the exact solution of the ES potential around a JNS within the linear Poisson-Boltzmann model. In App. B the equations for the 2D WKB theory of PE adsorption are derived.
II Critical polyelectrolyte adsorption
We here briefly review the results for the critical PE adsorption onto planar and curved interfaces necessary for our discussion regarding PE-JNS adsorption below. The PE adsorption occurs when the gain of the PE-surface ES attraction becomes larger than the free energy loss due to the decrease in the conformational entropy of the adsorbed PE chain. Critical adsorption conditions relate the surface charge density , the PE linear charge density , the ambient temperature , the persistence length of the PE chain, the radius of curvature of the surface, and the electrolyte concentration. These quantities are connected by the single universal adsorption parameter, denoted below as . The precise form of this coupling is Cherstvy and Winkler (2011)
| (1) |
where the subscript denotes the value at the critical adsorption point.
The exact value of decides whether for given physical parameters a PE chain adsorbs onto the surface or stays unbound. In the particular case of a planar interface the exact analytical result for long flexible PE chains shows that the critical surface charge density scales with the third power of the reciprocal Debye screening length Wiegel (1977), so that the approximate result is
| (2) |
This result is getting modified substantially for more complex surface geometries and its physical properties. For instance, larger plane surface charge densities are necessary to induce PE adsorption when the surface is low-dielectric Cherstvy and Winkler (2012). Due to PE-PE image-force repulsion Sens and Joanny (2000) in the course of adsorption, substantially larger critical strengths are required to trigger polymer adsorption. In addition, in the low-salt limit the cubic scaling given by expression (2) is modified to the quadratic scaling Cherstvy and Winkler (2012).
For curved convex surfaces, higher values of are necessary to activate the adsorption, as a larger entropic penalty needs to be paid for the polymer confinement near the surface, meaning that the value of becomes larger than . Moreover, the scaling changes with the surface curvature and the salinity of the electrolyte. These two quantities can be combined into a dimensionless parameter controlling the scaling behaviour for long chains. Specifically, in the limit of low salt or large surface curvature, when , it was shown recently that for a spherical particle the linear dependence
| (3) |
emerges Cherstvy and Winkler (2011). For otherwise given parameters, this relation determines the minimal sphere radius required for PE adsorption as well as the critical adsorption temperature . For flexible PEs in front of a cylindrical interface the scaling relation becomes
| (4) |
in the limit Cherstvy and Winkler (2011). This change in the exponent for spherical versus cylindrical particles is corroborated by experimental data Feng and et. al. (2001) (see also Fig. 11 and the discussion in Ref. Cherstvy and Winkler (2006)).
To derive the scaling relations (3) and (4), the Wentzel-Kramers-Brillouin (WKB) approximation scheme known from quantum mechanics was employed Cherstvy and Winkler (2011). It accurately reproduces the known results, including the pre-factors, for in planar Wiegel (1977) and spherical Winkler and Cherstvy (2006) geometries. In the opposite limit of the WKB theory predicts that for convex surfaces approaches the value for the uniformly charged plane from above, and the scaling (2) is valid Cherstvy and Winkler (2011). The reasons for this are a) the sphere and cylinder ES potentials are lower than the one for the planar surface with identical and b) the polymer conformations are perturbed more strongly on adsorption onto convex surface-limited interfaces such as those of spherical and cylindrical particles. This reduction of the number of polymer translational degrees of freedom requires larger , particularly at low salinities and small values. Concurrently, in the low-salt limit a systematic change in the scaling of the critical adsorption parameter was predicted Cherstvy and Winkler (2011), in qualitative agreement with experimental observations Kayitmazer and et. al. (2013), see Sec. V. Extensive comparison of theoretical predictions for the critical PE adsorption onto spherical versus cylindrical surfaces to a number of experimental data sets was presented in Refs. Cherstvy and Winkler (2006); Winkler and Cherstvy (2014).
These theoretical predictions for critical PE adsorption were corroborated indirectly by experiments, in that complex formation and coacervation of PEs with oppositely charged particles revealed no adsorption and agglomeration for above the critical value, when strong screening effects significantly reduce the PE-particle ES attraction Chen and et al. (2011); Kayitmazer and et. al. (2013); McQuigg et al. (1992); Feng and et. al. (2001); Antonov et al. (2010); Cooper et al. (2005); Cooper and et al. (2006); Kizilay and et. al. (2011); Wang et al. (2001). The critical surface charge density for spherical and cylindrical particles was demonstrated to increase with as follows Wang et al. (2001)
| (5) |
The scaling exponents , being sensitive functions of PE stiffness and linear charge density, clearly differ from the cubic dependence (2) due to curvature effects of adsorbing interfaces as well as the finite available adsorption surface and salt-dependence of PE persistence length .
These critical adsorption results for uniformly charged interfaces have to be modified in many realistic situations when quenched or annealed charge patterns exist on the adsorbing surfaces. This may be due to the discrete nature of surface charges or some inherent non-uniform or rough structure of interfaces. For planar patterned surfaces, several theoretical McNamara et al. (2002); Hoda and Kumar (2008) and in silico Muthukumar (1995); Ellis et al. (2000); de Vries and et. al. (2008); Dias and et. al. (2005) studies are available which focused on the effects of charge inhomogeneities on PE adsorption. For instance, for a circular charged patch of radius the critical PE adsorption condition was derived in a variational model Muthukumar (1995). As expected, a patch of a finite size demands higher values to enable adsorption Muthukumar (1995); Var . Effects of the patch size and charge distribution for polyion-protein complexation were analysed by computer simulations for complexes close to the isoelectric point de Vries (2004), see also Ref. Carlsson et al. (2001). Computer simulations for planar patterned charged interfaces were also reported Hoda and Kumar (2008).
For curved patterned interfaces, however, the understanding of the critical PE adsorption remains elusive. It is the main purpose of the present study to advance the knowledge on this process. We focus on PE adsorption onto JNS depicted in Fig. 1 which is the ultimate example of a net-neutral patchy colloid Walther and Mueller (2008). It consists of two equally but oppositely charged hemispheres so that the area of charged patches and surface curvature are intimately coupled. We show that this surface charge distribution effects a non-trivial interplay of the patch-size-mediated adsorption-desorption and the particle size, adds interesting new insight to the theory of PE adsorption onto curved interfaces, and represents a first step towards a more general approach to less orderly charge distributions.
In what follows we use Metropolis Monte-Carlo computer simulations to quantify the conditions of the critical PE adsorption as a function of the surface charge density and curvature of JNSs, the salinity of the solution, and the length of PE chains. The simulations are based on an algorithm, which was previously successfully implemented by one of the author to study the PE adsorption onto spherical and cylindrical uniformly-charged interfaces de Carvalho (2010); de Carvalho and Caetano (2013).
III Simulations of PE-JNS adsorption
III.1 Specification of the model and the employed parameters
A single JNS of radius is fixed at the centre of a spherical simulations box containing a single PE chain. The latter is modelled as a bead-spring polymer consisting of single-charged spherical monomers connected by harmonic elastic potentials
| (6) |
and interact via the screened Coulomb ES potential with a hard-core restriction,
| (7) |
Here is the distance between monomers and with and , and we set below. This inter-monomer ES repulsion yields a finite persistence length of the polymer that will be a crucial ingredient for the critical adsorption conditions derived in Sec. IV.3. We thus explicitly account for the intra-chain charge-charge interactions for finite-length chains, a situation which would require a formidable theoretical modelling. The chain parameters are the same as used in Ref. de Carvalho and Caetano (2013) to study the PE-cylinder adsorption. The screened monomer-monomer interactions imply a finite PE ES persistence length, , in contrast to the ideal Gaussian chains often employed in theoretical approaches Cherstvy and Winkler (2011).
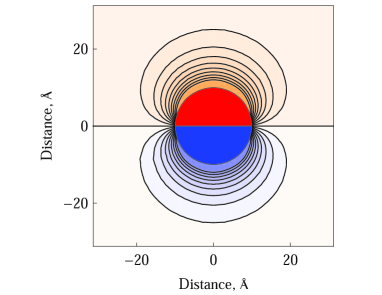
The ES interactions of the th PE monomer with the JNS is governed by the attractive dipolar-like potential given by Eq. (12) in the Appendix, see also Fig. 2 for the ES potential distribution. PE-JNS ES binding energy then is
| (8) |
Simulating the PE adsorption onto a uniformly charged sphere, Eq. (14) for is used. The aqueous solution has the standard dielectric constant and temperature K. The monomer radius is Å, and each monomer carries the elementary charge . The system is confined inside a large electrically-neutral simulations cell to eliminate end- and finite-size effects.
To sample the polymer configurations, translational movements of individual monomers and of the whole chain are combined with the Pivot rotation, see the detailed description in Ref. de Carvalho and Caetano (2013). A Metropolis Monte-Carlo approach in the canonical ensemble is implemented to explore the configurations space of the polymer-particle system. The standard Weighted Histogram Analysis Method (WHAM) is used to compute the system free energy. The polymer profiles are computed from the distribution functions of its monomers and their centre-of-mass generated, as a function of the distance from the macro-ion surface of JNSs, .
III.2 Adsorption criterion
The criterion for the PE-particle adsorption is based on the following considerations. As we observed for the interaction of a PE chain with a uniformly charged sphere, at higher ionic strengths the particle-PE attraction cannot overcome the loss of conformational and translational polymer entropy, and thus no adsorption takes place de Carvalho (2010). With a decreasing salinity, a discontinuous, first-order transition between the adsorbed and desorbed states of the PE chain occurs. The adsorbed state is characterised by binding energies of, typically, several units of the thermal energy , whereas the desorbed state has zero energy. This “gap” allows us to count the fraction of polymer configurations generated from simulations in each state, without defining an (arbitrary) energy threshold or a shell around the adsorbing particle to distinguish adsorbed versus desorbed PE monomers. Following this observation, we count the polymer as adsorbed if more than 50% of the configurations are in the adsorbed state during the simulation time. Typically of the order of to polymer configurations are used for averaging. As we show below, for PE-JNS adsorption there exists indeed a similar critical energetic transition between the adsorbed and desorbed states.
IV Main Results
IV.1 Binding energies and distributions of PE monomers
Typical conformations of the PE chain in the proximity of JNSs of different sizes and at varying salinity of the solution are presented in Fig. 1. The differences for varying conditions are striking, ranging from a completely adsorbed chain to a configuration, in which the chain is marginally attached to the JNS and points almost completely straight away from it. We observe that at higher salinities and larger Janus spheres a more pronounced PE adsorption takes place. This trend with the solution salinity is opposite to that for PE-sphere adsorption, where the adsorption gets amplified in low-salt conditions. For PE-JNS adsorption at low salt, the ES PE attraction by the oppositely charged hemisphere is accompanied and compensated by ES repulsion by the similarly charged Janus hemisphere, reducing the number of polymer monomers adsorbed onto the JNS surface as decreases, see Fig. 4A.
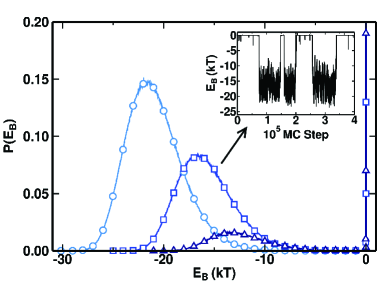
As illustrated in Fig. 3, there occur pronounced changes of the binding energy when transitions between the PE adsorbed and desorbed states in the vicinity of the JNS occur. More specifically, the inset of Fig. 3 shows the time trace of the PE-JNS binding energy in a given simulations run, while the main panel of Fig. 3 illustrates the long-time equilibrium probability distribution of the adsorption energy . We observe that PE chains at progressively higher salt concentrations have, as expected, smaller magnitudes of ES attraction to the JNS, see the differences between the circles, squares, and triangles in Fig. 3, for increasing salinity. At low salt each PE monomer in the bound state has a binding energy of about one unit of the thermal energy , which corresponds to the ratio of the values of Fig. 3 versus the number of monomers, . The distributions are normalised to unity when the contributions of both adsorbed and desorbed PE states, with zero binding energy, are accounted for. The latter are represented by the vertical lines at in Fig. 3. As expected, at lower salt and thus stronger ES attraction, the proportion of bound PE states increases, as given by the relative area under the distributions in Fig. 3.
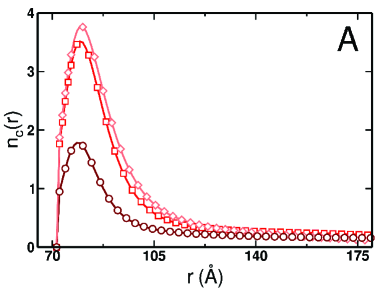
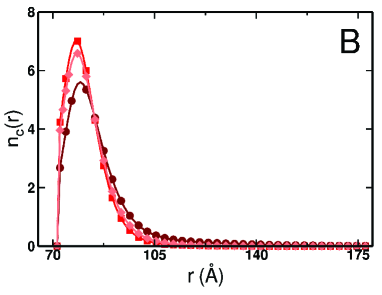
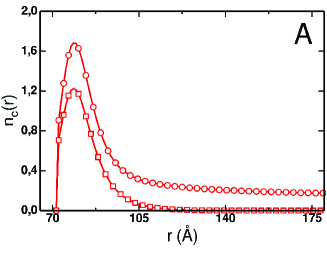
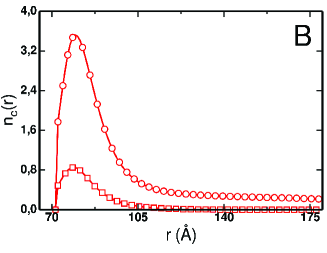
In Fig. 4 we show the non-normalised radial distribution function of the chain monomers facing the JNS (panel A) and a uniformly charged sphere with the same (panel B). We obtain a systematically broader distribution of monomers in front of the JNS compared to the sphere, consistent with the behaviour of the surface layer width, as shown in Fig. 5. With addition of salt, the profiles of PE chains adsorbed onto JNSs become progressively broader, as intuitively expected, and also more monomers are getting adsorbed, as illustrated in Fig. 4A.
Note that the PE monomer profiles in Fig. 4 are shown for the parameters well above the critical adsorption point. At the critical point itself, when , the width of the polymer distribution diverges. For large surface charge densities, in contrast, the relation with is valid, as shown for PE chains adsorbed onto planar and curved interfaces in Refs. Cherstvy and Winkler (2011); Winkler and Cherstvy (2014).
IV.2 Adsorbed layer width
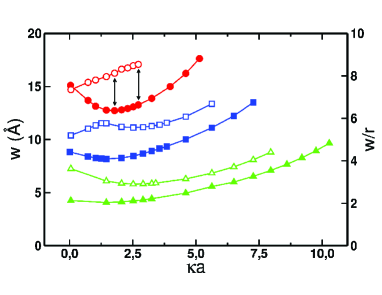
From Fig. 4 we obtain the width of the adsorbed PE layer at the half-height of the monomer density profile . The width typically decreases for decreasing salinity, as shown in Fig. 5. This decrease occurs because of the stronger ES PE-particle attraction, both for PEs in the proximity of the JNS and the uniformly charged sphere (apart from a region of small values of ). For the same physical reason, the PE layer width decreases with , compare the curves with the open symbols in Fig. 5.
The highest values in the curves of Fig. 5 correspond to the largest salinity of the solution at which PE-particle adsorption occurs (critical point). At even larger salt concentrations we have two distinct monomer populations: one of them is for PE chains staying near the particle corresponding to the adsorbed state, while another one is for PE monomers away from the Janus particle (the desorbed state). The range of salinities in terms of in which the PE-JNS adsorption occurs is systematically smaller than that for the uniformly charged sphere, compare the open and filled symbols in Fig. 5. As expected, the PEs in front of the JNS give rise to somewhat thicker adsorption layers as compared to the PE adsorption onto the homogeneous sphere at the same conditions, as shown in Fig. 5. Another expected observation is the fact that for smaller values of Janus particle charge density , the region of values of PE-JNS adsorption shrinks and shifts towards smaller values. Therefore, for weakly charged JNSs even moderate salt conditions can prevent PE adsorption.
We also find that for shorter PEs experiencing weaker attraction to JNSs, the width of the adsorbed PE layer for the surface charge densities given in Fig. 5 decreases, cf. Fig. 6. Physically, longer polymers do experience a stronger ES attraction and their monomers adsorb onto the JNSs in larger numbers. Because of a limited nanoparticle surface available to PE deposition, however, longer PE chains crowd near the attractive JNS hemisphere. The chains therefore swell because of inter-monomer ES repulsion. All this gives rise to larger thicknesses of the adsorbed PE layer as grows, see Fig. 6 for two values of the solution salinities.
We note that, unlike the planar and cylindrical cases for which the available surface for PE adsorption is infinite, for spheres and JNSs it is strictly bounded. This effects the extensive polymer tail formation, seen also in the sample configurations in Fig. 1. For this reason, the number of monomers in the adsorbed layer at the JNS surface changes with the ionic strength, resulting in the complex behaviour presented in Fig. 5.
Finally, in particular for strongly charged JNS, corresponding to the green triangles in Fig. 5, we observe a non-monotonic dependence of the adsorbed layer width on the salt concentration. This is indicative of a weaker ES attraction of PE chains to the JNS at low salt conditions, when the effects of the similarly charged JNS hemisphere is amplified, compensating the PE attraction to the similarly-charged JNS hemisphere. We refer also to Ref. Forsman (2012) which investigates non-monotonic effects of added salt and non-electrostatic PE-surface interactions analytically and by simulations.
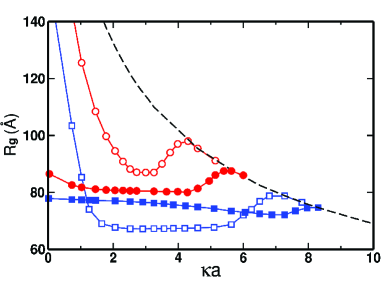
The variation of the radius of gyration of the PE chain during the adsorption onto JNSs and the uniformly charged spheres is shown in Fig. 7. The slightly non-monotonic variation observed in this plot is quite sensitive to the system parameters, such as the particle size, its surface charge density, and the polymer length. The universal feature we want to highlight here, however, is the general dependence of on the salt concentration. In particular, for salinities above the critical adsorption transition, the chain size follows the prediction for the non-confined semiflexible polymer in solution, both for the JNS and the uniformly charged sphere, as shown by the dashed curve in Fig. 7. For very low salt concentrations, in contrast, the gyration radius of PE chains in front of the JNS starts to grow dramatically as the salinities drops below the critical salinity required for PE-JNS adsorption. This is indicative of stronger ES repulsion of PE chains from the similarly-charged JNS hemisphere. This repulsion is long-ranged in the low-salt limit and has a tendency to displace the polymer from the favorable JNS hemisphere as well as to stretch the chain. This stretching effect is shown on the left panel of Fig. 1 for vanishing salinity.
IV.3 Critical PE adsorption conditions
With our above adsorption criterion, we determine the critical adsorption conditions for PE chains of different lengths and JNSs of varying sizes. Our main conclusion is that there exists no universal scaling of the parameter for PE adsorption onto JNSs, in strong contrast to the case for PE adsorption onto spherical and cylindrical interfaces Cherstvy and Winkler (2011). The curvature of the JNS surface and the screening parameter cannot now be varied inter-changeably. The solution salinity and the surface curvature affect the dependence of the critical adsorption conditions in a disparate way. This is likely due to the salt effects on the PE persistence length , see Fig. 8. Note that the range of we present in Fig. 8 spans more than two decades, that is significantly more than examined recently for the PE-cylinder adsorption de Carvalho and Caetano (2013).
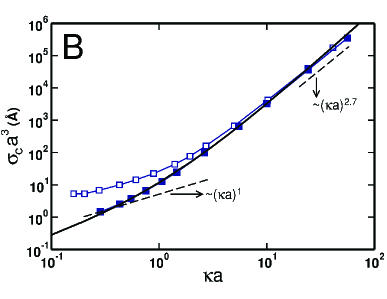
Let us now describe the main results of the current study presented in Figs. 8A and 8B. We start with the results for the uniformly charged sphere and consider a varying sphere radius , the filled squares in Fig. 8B. We find the scaling in the limit of large , in agreement with the limit of large spheres discussed in Ref. Cherstvy and Winkler (2011) or with the nearly planar result of Ref. Wiegel (1977) given by Eq. (2). In the limit of we observe that , in agreement with previous results for small spheres derived in Refs. Cherstvy and Winkler (2011); Winkler and Cherstvy (2006, 2014) and described by Eq. (3). Note that from the results obtained for the critical surface charge density and the definition (1) one can recalculate the critical minimal radius of the JNS particle necessary for adsorption.
IV.3.1 Varying Janus particle size
For JNSs of varying sizes at constant , we detect a similar turnover of the scaling behaviour . The critical JNS surface charge density required to trigger the PE adsorption is larger than that for the uniformly charged sphere in the whole range of , see the empty and filled symbols in Fig. 8B. The region in which the change in the scaling behaviour for JNSs from to with occurs, is somewhat shifted to larger values for JNSs, in comparison to the sphere. For PE-sphere adsorption, the change in scaling occurs at , i.e., when the Debye screening length is comparable to the sphere size , in agreement with the theory (see Fig. 1 in Ref. Cherstvy and Winkler (2011)) and the experimental data shown in Fig. 6 in Ref. Feng and et. al. (2001) as well as Fig. 11 in Ref. Cherstvy and Winkler (2006).
The theoretically predicted dependence for the PE-sphere adsorption Cherstvy and Winkler (2011) given by Eq. (22) and multiplied by a factor of 1.77 is shown as the solid black curve in Fig. 8B. This numerical factor of the order of unity apparently accounts for all the discrepancies of current simulations performed for finite electrostatically-persistent PE chains versus the infinitely long unperturbed Gaussian polymers considered in the theory. The agreement with the simulations data both in terms of the magnitude of the critical surface charge density and in terms of the region in which the transition from the cubic to linear scaling in occurs, is remarkably good: the theory agrees with the simulations over the range of more than two decades of the sphere size. It is important to note that contains the effects of a finite PE persistence and other chain length effects. For this fact the agreement of the theory Cherstvy and Winkler (2011) with our current simulational results for relatively short chains ( for the solid symbols in Fig. 8B) is even more remarkable. This observation is a further support for the quantitative validity of the simulations results for PE-JNS adsorption while no theory for this case has been developed to date.
To calculate the error bars for , we performed a dozen of simulations with different random number seed to generate different sets of chain configurations. For the most data points in Fig. 8 for chains the deviation in the critical adsorption conditions is just of the value. The error bars are thus much smaller than the symbol size. For longer chains the deviations are expectedly larger, namely of . The error bars are of the order of symbol size, except for the first couple of points at the smallest solution salinities, when the error bars can be twice the symbol size. This is physically understandable because in the low-salinity regime, close to the complete desorption threshold, the fluctuations of the polymer dimensions are particularly large. For the others quantities we presented, such as the radius of gyration of the chain or the width of the adsorbed PE layer , the error bars are smaller then symbol size.
IV.3.2 Varying salt concentration
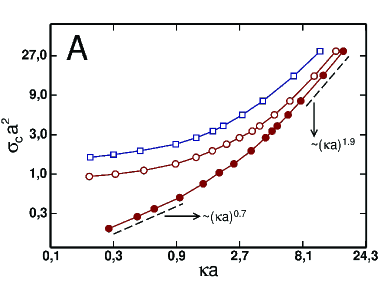
We now turn to the description of the results obtained when the salinity of the solution is changed in the simulations, as shown in Fig. 8A. For a constant radius , the PE chain in front of the uniformly charged sphere exhibits the scaling in the limit of and the scaling for , in a drastic contrast to Fig. 8B where the particle size was varied. The scaling exponent in the limit of , which is smaller by about unity than that in the setup with constant salt concentration, is consistent with the effect of the ES PE persistence length on the critical adsorption conditions. This effect is neglected in the simplistic adsorption theory of flexible Gaussian chains Winkler and Cherstvy (2014) for which the scaling is effected, as prescribed by Eq. (2). For flexible PEs the scaling
| (9) |
is known to hold. According to Eq. (1) and with the total PE persistence length the renormalised scaling for is obtained for the critical adsorption of PEs with such a -dependent persistence length onto a spherical particle, as we indeed observe in the simulations when is varied.
In the limit the scaling exponent in the setup with a varying salt concentration is also somewhat reduced for the sphere, namely down to 0.7, see the filled symbols in Fig. 8A. For small , overall much smaller values of are required to trigger the PE adsorption onto a sphere, as compared to JNSs. This is due to the stronger PE-sphere attraction which overcomes the entropic penalty of the polymer confinement near the adsorbing surface. For the PE-adsorption onto a JNS at varying the overall growth of with at is much weaker than for the sphere, as demonstrated by the open symbols in Fig. 8A. For the critical surface charge density for PE-JNSs adsorption almost saturates, that is, with . With the adsorption criterion used here we do not observe any increase of the value of at very small , but we cannot exclude this for modified/different adsorption conventions.
Also note that in the full nonlinear ES model of Eq. (17) lower ES potentials will occur near the charged interfaces for the same , as compared to the linear ES theory of Eq. (11). Then, to ensure the same PE-surface affinity (8), effectively higher surface charge densities will be necessary. This will serve as another source for a potential increase of for realistic Janus particles at very low salt conditions, where the nonlinear ES model has to be applied.
Moreover, with the chosen adsorption criterion, longer PE chains which are attracted stronger to the particle surface need weaker Janus hemisphere charge densities for the adsorption to occur, compare the open squares () and circles () in Fig. 8A. This trend is similar to that for PE-sphere adsorption for varying polymerisation degree of the PE chain, compare Fig. 5 of Ref. de Carvalho (2010).
Finally, note that for the critical adsorption conditions presented in Fig. 8 we implemented the full exact ES potential (12). To save simulation time, it is also possible to use just the first two terms in the ES potential expansion (12). The obtained results are quite close to the exact ones, over a broad range of parameters, see Fig. 9. In this figure we present the critical surface area per charge that is a directly measurable experimental parameter: .
V Discussion and Conclusions
Let us first summarise our main findings. From extensive computer simulations we uncovered the properties of adsorption of flexible PE chains onto net-neutral Janus nanospheres with oppositely charged hemispheres. The adsorbing PE chain occupies the JNS hemisphere of the opposite charge and avoids the like-charged hemisphere of the JNS. We examined the behaviour of the critical adsorption conditions in dependence of the particle surface charge density, the surface curvature, and the length of the PE chain. The latter dependence is particularly hard to predict theoretically. We demonstrated that the PE-JNS adsorption-desorption transition differs in many respects from PE adsorption onto the uniformly charged sphere.
In particular, we discovered that there exists no universal parameter that couples the surface curvature and the salinity of the solution. The results for the critical PE-JNS adsorption conditions differ substantially if one separately varies the salt concentration or the JNS radius, as shown in Fig. 8. We rationalised the differences in these scalings using the concept of a salt-dependent PE persistence. We also found that shorter PE chains necessitate larger charge densities on the JNS hemispheres to trigger adsorption. We explored how the width of the adsorbed PE layer is reduced for JNSs with progressively larger surface charge densities, due to stronger ES adsorption. For JNSs the critical surface charge density and the thickness of adsorbed layer throughout remain larger than for the PE adsorption onto uniformly charged spherical particles of the same size and nominal surface charge. This reflects the influence of the JNS hemisphere of the same charge as the PE chain, which opposes the adsorption via repulsive ES JNS-PE interactions.
A direct biological application of our results for PE-JNS interaction is the description of the critical adsorption conditions of flexible and semi-flexible PE chains onto oppositely charged interfaces of spherical and cylindrical geometry that have been thoroughly studied in the lab of Paul Dubin Cooper et al. (2005); Chen and et al. (2011); Feng and et. al. (2001); Wang et al. (2001); Kizilay and et. al. (2011); Kayitmazer and et. al. (2013); McQuigg et al. (1992). Flexible PE chains in the experiments (such as PAMPS, polyacrylic acid PAA, random copolymers of 2-(acrylamido)-2-methylpropane-sulfonate and acrylamide P(AMPS-AAm), sulfonated poly(vinyl alcohol) PVAS, sodium-poly(styrene sulfonate) NaPSS, or poly(dimethyldiallylammonium chloride) PDADMAC) usually have persistence lengths of the order of nm, whereas for semiflexible chains such as double stranded DNA the persistence length is of the order of nm. The oppositely charged surfaces often include dodecyldimethylamine oxide DMDAO cationic uniformly charged micelles with well titration-controlled surface charge density, controllable dimensions, and a geometry which depends on the salt conditions (spherical micelles occur at low salt and cylindrical ones at high salt conditions). Other complexes include spherical colloidal particles, dendrimers of varying generations, and globular proteins Kayitmazer and et. al. (2013) that are often non-homogeneously charged (e.g., BSA bovin serum albumin and lysozyme).
In brief, experimentally the complexation of PEs with oppositely charged particles is measured via the changes in the solution turbidity. The latter is intimately coupled to coacervation, aggregation, and precipitation of complexes. The onset on complex formation is well controlled and precisely measured. Turbidimetric measurements systematically reveal that with increasing solution salinity the critical surface charge density of the particle surface grows, as seen from Eq. (5). The complex formation of flexible PVAS polymers with nearly uniformly charged DMDAO micelles yields scaling exponents of 1.0 and 1.8 for spherical and cylindrical cases, respectively Feng and et. al. (2001). For P(AMPS-AAm) complexes with DMDAO micelles the powers are 1.4 and 2.5 Feng and et. al. (2001). DNA complexation with DMDAO micelles of spherical and cylindrical geometry reveals the exponents of 1.6 and 1.8, respectively Wang et al. (2001).
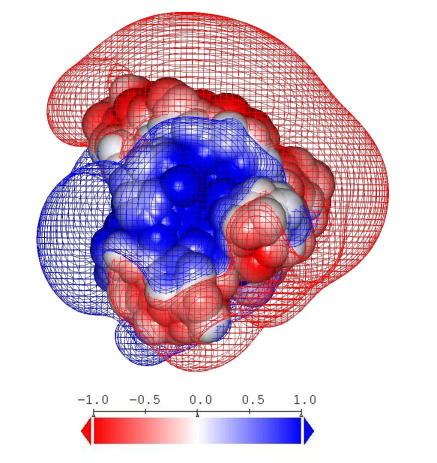
Charge anisotropies of heterogeneously charged proteins such as BSA can even further reduce the scaling dependence of the critical surface charge density for adsorption with . Note that for patchy proteins, to compute the effective surface charge density for adsorption , the net protein charge was divided over the protein surface. Indeed, the complexation of a number of poly-anions (AMPS/AAm, PAA, pectin) with spherical cationic micelles, dodecyltrimethylammonium bromide/Triton X-100 DTAB/TX-100, revealed the following critical exponents for the critical surface charge density : for uniformly charged micelles versus for pronouncedly heterogeneous charge distribution of BSA proteins. The BSA charge distribution, with a single relatively large cationic patch present at low salt, was additionally shown to evolve into multi-patchy structure at higher salinities, see Fig. 10 and the original Fig. 11 in Ref. Cooper and et al. (2006).
Thus, at low salinities the anionic part of the BSA surface impedes the poly-anion adsorption onto the protein surface, repelling it electrostatically from the attractive cationic patch and giving rise to dramatically smaller values of the critical exponent . These experimental observations therefore very nicely support our predictions for the PE conformations in the proximity of the JNSs in Fig. 1 and the much weaker growth of with for PE adsorption onto JNSs, see the results of Fig. 8. The JNSs are somewhat reminiscent in their charge surface pattern to BSA at low salt conditions, as illustrated in Fig. 10. We also note that a number of PE complexes with patchy proteins revealed a maximal affinity as function of the solution salinity realised for Debye screening lengths comparable to the protein dimensions Cooper and et al. (2006).
Another example of PE-protein complexation is the ES-driven wrapping of a negatively charged double-stranded semi-flexible DNA fragment around highly basic histone-core proteins in nucleosome core particles Schiessel (2003). The latter exhibit an equatorial ring of positive Lysine and Arginine charges Luger and et. al. (1997); Cherstvy (2009) forming the strongly non-uniformly charged substrate for the binding of DNA. In both cases, for PE-BSA and DNA-histone adsorption, the surface charge patchiness and structure can give rise to PE adsorption on the wrong side of the isoelectric point and to complex overcharging Boroudjerdi et al. (2014) (see, however, also Ref. Zinchenko et al. (2005)). One more example of patterned surfaces is the adsorption of DNA onto laterally-structured interfaces of supported cationic lipid membranes, as monitored by atomic force microscopy techniques in Ref. Clausen-Schaumann and Gaub (1999), see also Refs. Farago et al. (2006) and Cherstvy and Petrov (2014) for, respectively, computer-based and theoretical modelling of DNA complexation with cationic lipid membranes.
In the case of flexible PE-surface adsorption, the ES-driven ordering of flexible single-stranded RNA molecules on highly positively charged interiors of viral capsids was suggested Belyi and Muthukumar (2006); Forrey and Muthukumar (2009); Siber et al. (2012). The RNA adsorption in this system takes place onto strongly non-uniformly charged, patterned surfaces decorated with flexible, highly-basic polypeptide arms. The latter grab the RNAs and trigger mutual complexation, a prerequisite for sustainable thermodynamic self-assembly of single-stranded RNA viruses from the nucleic acid and the protein-subunit components available in the solution Perlmutter et al. (2013). The resulting structure pattern of single-stranded RNA molecules adsorbed to the inner capsid surface obtained both from computer simulations and from experiments indeed resembles the symmetry of viral shells Forrey and Muthukumar (2009).
Extensions of the current simulations scheme will include PE adsorption onto charge-corrugated and patterned Janus surfaces of spherical and cylindrical shape. Also, semiflexible PEs and weak versus strong adsorption conditions will be studied. The latter will e.g. lead to the formation of some ordered, snail-like or toroidal PE structures on oppositely charged caps of the Janus particles, in contrast to the quite disordered PE appearance of flexible chains weakly adsorbed on JNSs, compare Fig. 1. Ordered PE structures, such as tennis-ball like, rosettes, and solenoids, are known to appear in the ground state upon strong PE adsorption onto oppositely and uniformly charged spherical particles, see, e.g., Refs. Cherstvy and Winkler (2006); Schiessel (2003); Rudnick et al. (2000); Boroudjerdi and Netz (2005); Netz and Joanny (1999a). Lastly, the effects of PE charge heterogeneity and patchiness should be considered in the future, as it is known to affect the critical adsorption conditions as well.
It will be important to test the theoretical results presented here by experimental studies of the different adsorption characteristics of PE chains onto Janus-like nanoparticles, as compared to PE adsorption onto uniformly charged convex surfaces.
VI acknowledgments
We thank Paul Dubin for insightful comments regarding the PE binding to BSA proteins and to Serge Stoll for kindly providing the original images of the BSA ES surface potential. AGC acknowledges a fruitful collaboration with Roland Winkler over many years. The authors acknowledge financial support from the Academy of Finland (FiDiPro scheme to RM) and the German Research Foundation (DFG grant CH 707/5-1 to ACG). Computer resources were supplied by the Center for Scientific Computing (NCC/GridUNESP) of the São Paulo State University.
Appendix A ES potential of the Janus particle
We here derive the ES potential around a JNS. The charge density of a JNS of radius with the charge density on its caps in spherical coordinates can be written as
| (10) |
Here is the polar angle, is the step function, is the elementary charge, and is the area per charge on the surface. The linear Poisson-Boltzmann equation for the ES potential of a JNS in an electrolyte solution,
| (11) |
allows the separation of variables via the eigenfunction expansion in terms of Legendre polynomials and spherical Bessel functions Cherstvy and Winkler (2006), namely
| (12) |
Using Gauss’ theorem on the particle surface, , one can restore the distribution of the ES potential, yielding the coefficients of the eigenfunction expansion
| (13) |
with and denoting the derivative. Naturally, the potential of a uniformly charged sphere is given by the term of this expansion, obtained for as
| (14) |
After integration of , for a JNS we obtain
| (15) |
where is the Gamma function. This yields the ES potential near JNSs used in the simulations. A contour plot of the potential is shown in Fig. 2.
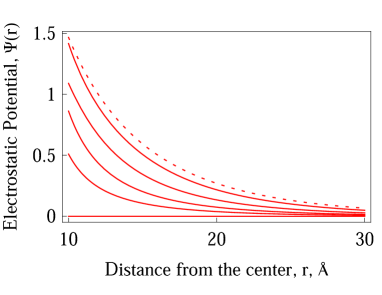
As expected, for JNSs the ES potential shown in Fig. 11 is always lower in magnitude than for a sphere with uniform charge distribution but the same . For large JNSs, taking along sufficiently many terms in Eq. (12), one arrives at the intuitive result that at zero polar angle the asymptotic relation
| (16) |
hold. The dependence on illustrated in Fig. 11 shows that close to the “poles” of the JNS the deviation from is relatively small, while close to the “equator”, i.e., when , the ES potential is strongly diminished by mutual compensation of the ES effect of the two oppositely-charged hemispheres.
Note here that when we vary the salinity of the solution, it is important to remember that at low salt concentrations the linear Poisson-Boltzmann theory used for the derivation of the potential in Eq. (12) breaks down due to the high ES potentials near the interface. Therefore, the entire linear ES approach becomes inapplicable in this range. Numerical computations of the ES potential emerging from JNSs in the full non-linear model,
| (17) |
therefore need to be performed. This is a target for future investigations of more realistic PE-JNS adsorption. We also plan to examine more systematically the effects of the length as well as the linear charge density and the charge patchiness of the PE chain.
Appendix B 2D WKB scheme for PE adsorption
We here present the basic equations for the theoretical analysis of the PE-JNS adsorption. Using the WKB method for uniformly charged interfaces established in Ref. Cherstvy and Winkler (2011), one can, in principle, investigate the adsorption of a long PE chain onto a JNS. The equation for the polymer eigenfunctions in the external Debye-Hückel potential field can be derived from the Edwards equation Winkler and Cherstvy (2006)
| (18) |
written for the polymer’s Green function, expanded in terms of eigenfunctions
| (19) |
For polymer chains much longer than the Kuhn length, , the ground state eigenfunction dominates this expression. With the separation of variables , because of the linearity of Eq. (18) for each one finds
| (20) | |||||
For a uniformly charged sphere, , and for the radial component we get
| (21) |
This equation was solved by the WKB method Cherstvy and Winkler (2011), with the critical adsorption condition as function of the universal parameter ,
| (22) |
where is the complementary error function and . In the limit this leads to Eq. (3) in the main text.
The ES potential of a JNS is a sum of coupled radial and polar angle terms, the first term reading . The variables for polymer eigenfunctions in the -coupled ES field near the JNS cannot be separated, however. Thus, instead of finding an approximate solution of Eq. (20), in the main text we study the PE-JNS adsorption directly and explicitly by computer simulations. We exploit the critical adsorption conditions and the effect of the PE length, which cannot be envisaged from the ground-state-based analysis typically performed for the eigenfunction (21), which is only applicable to long polymers.
We note that other standard approximations to PE adsorption problems are discussed in Sec. IV of Ref. Cherstvy and Winkler (2012). We do not consider the charge regulation and self-consistent charge normalisation effects that might affect the PE adsorption properties which was experimentally noticed Wen and Dubin (1997). No account is taken of changes in the counterion atmosphere upon PE-particle adsorption and a possible low-dielectric JNS interior, see, e.g., Ref. Sens and Joanny (2000) for more on these effects for the standard PE-plane adsorption. Non-ES interactions are not taken into account, see, e.g., Ref. Forsman (2012) for more details.
References
- de Gennes (1992) P. G. de Gennes, Rev. Mod. Phys. 64, 645 (1992).
- Walther and Mueller (2008) A. Walther and A. H. E. Mueller, Soft Matter 4, 663 (2008).
- Hong et al. (2008) L. Hong, A. Cacciuto, E. Luijten, and S. Granick, Langmuir 24, 621 (2008).
- de Graaf et al. (2012) J. de Graaf, N. Boon, M. Dijkstra, and R. van Roij, J. Chem. Phys. 137, 104910 (2012).
- Granick et al. (2009) S. Granick, S. Jiang, and Q. Chen, Physics Today 62, 68 (2009).
- Jiang and et al. (2010) S. Jiang and et al., Adv. Mater. 4, 1060 (2010).
- Glaser and et al. (2006) N. Glaser and et al., Langmuir 22, 5227 (2006).
- Chen (2012) Y. Chen, Macromolecules 45, 2619 (2012).
- Du and O Reilly (2011) J. Du and R. K. O Reilly, Chem. Soc. Rev. 40, 2402 (2011).
- Tagliazucchi and Szleifer (2012) M. Tagliazucchi and I. Szleifer, Soft Matter 8, 7292 (2012).
- Berger and et al. (2008) S. Berger and et al., Macromolecules 41, 9669 (2008).
- Walther et al. (2008) A. Walther, K. Matussek, and A. H. E. Muller, ACS Nano 2, 1167 (2008).
- Glaser et al. (2006) N. Glaser, D. J. Adams, A. Boeker, and G. Krausch, Langmuir 22, 5227 (2006).
- Winkler and Cherstvy (2014) R. G. Winkler and A. G. Cherstvy, Adv. Polym. Sci. 255, 1 (2014).
- Manning (1978) G. S. Manning, Q. Rev. Biophys. 11, 179 (1978).
- Manning (2007) G. S. Manning, Macromolecules 40, 8071 (2007).
- Netz and Andelman (2003) R. R. Netz and D. Andelman, Phys. Rep. 380, 1 (2003).
- Dobrynin and Rubinstein (2005) A. V. Dobrynin and M. Rubinstein, Prog. Polym. Sci. 30, 1049 (2005).
- Dobrynin (2008) A. V. Dobrynin, Curr. Opin. Coll. Interf. Sci. 13, 376 (2008).
- Shafir and Andelman (2004) A. Shafir and D. Andelman, Phys. Rev. E 70, 061804 (2004).
- Boroudjerdi and Netz (2005) H. Boroudjerdi and R. R. Netz, J. Phys.: Cond. Matt. 17, S1137 (2005).
- Netz and Joanny (1999a) R. R. Netz and J. F. Joanny, Macromolecules 32, 9013 (1999a).
- Rudnick et al. (2000) J. Rudnick, R. Bruinsma, and W. M. Gelbart, EPL 51, 237 (2000).
- Sens and Joanny (2000) P. Sens and J. F. Joanny, Phys. Rev. Lett. 84, 4862 (2000).
- Schiessel (2003) H. Schiessel, J. Phys.: Cond. Matt. 15, R699 (2003).
- Messina (2009) R. Messina, J. Phys.: Cond. Matt. 21, 113102 (2009).
- de Vries and Cohen-Stuart (2006) R. de Vries and M. Cohen-Stuart, Curr. Opin. Coll. Interf. Sci. 11, 295 (2006).
- Podgornik and Licer (2006) R. Podgornik and M. Licer, Curr. Opin. Coll. Interf. Sci. 11, 273 (2006).
- Szilagyi and et al. (2014) I. Szilagyi and et al., Soft Matter 10, 2479 (2014).
- Boroudjerdi et al. (2014) H. Boroudjerdi, A. Naji, and R. R. Netz, Europ. Phys. J. E 37, 21 (2014).
- Shin et al. (2014) J. Shin, A. G. Cherstvy, and R. Metzler, Phys. Rev. X 4, 021002 (2014).
- Kong and Muthukumar (1998) C. Y. Kong and M. Muthukumar, J. Chem. Phys. 109, 1522 (1998).
- Akinchina and Linse (2002) A. Akinchina and P. Linse, Macromolecules 35, 5183 (2002).
- Carrillo and Dobrynin (2012) J. M. Y. Carrillo and A. V. Dobrynin, Langmuir 28, 1531 (2012).
- Nandy and Maiti (2011) B. Nandy and P. K. Maiti, J. Phys. Chem. B 115, 217 (2011).
- Cao and Bachmann (2013) Q. Cao and M. Bachmann, Soft Matter 9, 5087 (2013).
- Nunes et al. (2013) S. C. C. Nunes, T. F. G. G. Cova, and A. A. C. C. Pais, J. Chem. Phys. 139, 054906 (2013).
- Faraudo and Martin-Molina (2013) J. Faraudo and A. Martin-Molina, Curr. Opin. Coll. Interf. Sci. 18, 517 (2013).
- Luque-Caballero et al. (2014) G. Luque-Caballero, A. Martin-Molina, and M. Quesada-Perez, J. Chem. Phys. 140, 174701 (2014).
- Man and Yan (2010) X. Man and D. Yan, Macromolecules 43, 2582 (2010).
- Wang and et al. (2011) Z. Wang and et al., Macromolecules 44, 8607 (2011).
- Huang and Ruckenstein (2012) H. Huang and E. Ruckenstein, Langmuir 28, 16300 (2012).
- Kampmann et al. (2013) T. A. Kampmann, H. H. Boltz, and J. Kierfeld, J. Chem. Phys. 139, 034903 (2013).
- de Carvalho and Caetano (2013) S. J. de Carvalho and D. L. Z. Caetano, J. Chem. Phys. 138, 244909 (2013).
- Wiegel (1977) F. W. Wiegel, J. Phys. A: Math. Gen. 10, 299 (1977).
- Muthukumar (1987) M. Muthukumar, J. Chem. Phys. 86, 86 (1987).
- van Goeler and Muthukumar (1994) F. van Goeler and M. Muthukumar, J. Chem. Phys. 100, 7796 (1994).
- Baumgaertner and Muthukumar (1991) A. Baumgaertner and M. Muthukumar, J. Chem. Phys. 94, 4062 (1991).
- Netz and Joanny (1999b) R. R. Netz and J. F. Joanny, Macromolecules 32, 9026 (1999b).
- Winkler and Cherstvy (2006) R. G. Winkler and A. G. Cherstvy, Phys. Rev. Lett. 96, 066103 (2006).
- Cherstvy and Winkler (2006) A. G. Cherstvy and R. G. Winkler, J. Chem. Phys. 125, 064904 (2006).
- Winkler and Cherstvy (2007) R. G. Winkler and A. G. Cherstvy, J. Phys. Chem. B 111, 8486 (2007).
- Cherstvy and Winkler (2011) A. G. Cherstvy and R. G. Winkler, Phys. Chem. Chem. Phys. 13, 11686 (2011).
- Wang and Muthukumar (2011) J. Wang and M. Muthukumar, J. Chem. Phys. 135, 194901 (2011).
- Cherstvy (2012) A. G. Cherstvy, Biopolymers 97, 311 (2012).
- Cherstvy and Winkler (2012) A. G. Cherstvy and R. G. Winkler, J. Phys. Chem. B 116, 9838 (2012).
- de Carvalho (2010) S. J. de Carvalho, EPL 92, 18001 (2010).
- Forsman (2012) J. Forsman, Langmuir 28, 5138 (2012).
- Carnal and Stoll (2011) F. Carnal and S. Stoll, J. Phys. Chem. B 115, 12007 (2011).
- Ulrich et al. (2011) S. Ulrich, M. Seijo, F. Carnal, and S. Stoll, Macromolecules 44, 1661 (2011).
- Ulrich et al. (2005) S. Ulrich, A. Laguecir, and S. Stoll, Macromolecules 115, 8939 (2005).
- Chen and et al. (2011) K. Chen and et al., Biomacromolecules 12, 2552 (2011).
- Kayitmazer and et. al. (2013) A. B. Kayitmazer and et. al., Soft Matter 9, 2553 (2013).
- Feng and et. al. (2001) X. H. Feng and et. al., Macromolecules 34, 6373 (2001).
- McQuigg et al. (1992) D. W. McQuigg, J. L. Kaplan, and P. L. Dubin, J. Phys. Chem. 96, 1973 (1992).
- Antonov et al. (2010) M. Antonov, M. Mazzawi, and P. L. Dubin, Biomacromolecules 11, 51 (2010).
- Cooper et al. (2005) C. L. Cooper, P. L. Dubin, A. B. Kayitmazer, and S. Turksen, Curr. Opin. Coll. Interf. Sci. 10, 52 (2005).
- Cooper and et al. (2006) C. L. Cooper and et al., Biomacromolecules 7, 1025 (2006).
- Kizilay and et. al. (2011) E. Kizilay and et. al., Adv. Coll. Interf. Sci. 167, 24 (2011).
- Wang et al. (2001) Y. Wang, P. L. Dubin, and H. Zhang, Langmuir 17, 1670 (2001).
- McNamara et al. (2002) J. McNamara, C. Y. Kong, and M. Muthukumar, J. Chem. Phys. 117, 5354 (2002).
- Hoda and Kumar (2008) N. Hoda and S. Kumar, J. Chem. Phys. 128, 124907 (2008).
- Muthukumar (1995) M. Muthukumar, J. Chem. Phys. 103, 4723 (1995).
- Ellis et al. (2000) M. Ellis, C. Y. Kong, and M. Muthukumar, J. Chem. Phys. 112, 8723 (2000).
- de Vries and et. al. (2008) R. de Vries and et. al., J. Chem. Phys. 118, 4649 (2008).
- Dias and et. al. (2005) R. S. Dias and et. al., J. Phys. Chem. B 109, 11781 (2005).
- (77) Note that the applicability of the variational Ansatz Muthukumar (1995) might be questionable in some cases. For instance, it predicts a quadratic -scaling for PE-cylinder adsorption, failing however to recover the linear law for PE-sphere adsorption, as derived by the WKB method Cherstvy and Winkler (2011). Note also that the form of optimized variational functions might differ for various geometries or for patterned surfaces.
- de Vries (2004) R. de Vries, J. Chem. Phys. 120, 3475 (2004).
- Carlsson et al. (2001) F. Carlsson, P. Linse, and M. Malmsten, J. Phys. Chem. B 105, 9040 (2001).
- Luger and et. al. (1997) K. Luger and et. al., Nature 389, 251 (1997).
- Cherstvy (2009) A. G. Cherstvy, J. Phys. Chem. B 113, 4242 (2009).
- Zinchenko et al. (2005) A. A. Zinchenko, K. Yoshikawa, and D. Baigl, Phys. Rev. Lett. 95, 228101 (2005).
- Clausen-Schaumann and Gaub (1999) H. Clausen-Schaumann and H. E. Gaub, Langmuir 15, 8246 (1999).
- Farago et al. (2006) O. Farago, N. Gronbech-Jensen, and P. Pincus, Phys. Rev. Lett. 96, 018102 (2006).
- Cherstvy and Petrov (2014) A. G. Cherstvy and E. P. Petrov, Phys. Chem. Chem. Phys. 16, 2020 (2014).
- Belyi and Muthukumar (2006) V. A. Belyi and M. Muthukumar, Proc. Natl. Acad. Sci. U.S.A. 103, 17174 (2006).
- Forrey and Muthukumar (2009) C. Forrey and M. Muthukumar, J. Chem. Phys. 131, 105101 (2009).
- Siber et al. (2012) A. Siber, A. L. Bozic, and R. Podgornik, Phys. Chem. Chem. Phys. 14, 3746 (2012).
- Perlmutter et al. (2013) J. D. Perlmutter, C. Qiao, and M. F. Hagan, eLife 2, e00632 (2013).
- Wen and Dubin (1997) Y. P. Wen and P. L. Dubin, Macromolecules 30, 7856 (1997).