Magnetic and structural transitions in La0.4Na0.6Fe2As2 single crystals
Abstract
La0.4Na0.6Fe2As2 single crystals have been grown out of an NaAs flux in an alumina crucible and characterized by measuring magnetic susceptibility, electrical resistivity, specific heat, as well as single crystal x-ray and neutron diffraction. La0.4Na0.6Fe2As2 single crystals show a structural phase transition from a high temperature tetragonal phase to a low-temperature orthorhombic phase at Ts = 125 K. This structural transition is accompanied by an anomaly in the temperature dependence of electrical resistivity, anisotropic magnetic susceptibility, and specific heat. Concomitant with the structural phase transition, the Fe moments order along the a direction with an ordered moment of 0.7(1) at T = 5 K. The low temperature stripe antiferromagnetic structure is the same as that in other AFe2As2 (A = Ca, Sr, Ba) compounds. La0.5-xNa0.5+xFe2As2 provides a new material platform for the study of iron-based superconductors where the electron-hole asymmetry could be studied by simply varying La/Na ratio.
pacs:
74.70.Xa, 61.50.Nw,81.10.Dn,74.62.DhI Introduction
Since the first report of superconductivity with a transition temperature (Tc) of 26 K in LaFeAsO1-xFx in 2008,Hosono2008 tremendous efforts have been made to explore new iron-based superconductors. Superconductivity was observed in a wide variety of iron-based materials, such as ’122’ ThCr2Si2-type AFe2As2 (A = alkaline earth),Johrendt2008 ’111’ Cu2Sb-type LiFeAs,Jin2008 ’11’ PbO-type FeSe,Wu2008 ’42622’ Sr2FeO3CuS-type Sr4Sc2O6Fe2P2,Ogino2009 and ’10-3-8’ phase Ca10(Pt3As8)(Fe2As2)5.Ni2011 Among them, the 122 system has attracted the most interest because (1) sizable single crystals could be grown which makes it possible to investigate intrinsic physical properties and the close interplay between structure, magnetism, and superconductivity by various techniques, (2) the materials show rich chemistry and can be both hole- and electron-doped. It thus has been a model platform for unconventional superconductivity.Mandrus2010
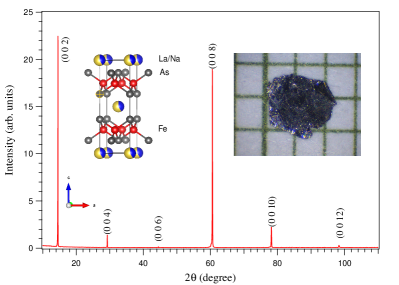
As shown in the inset of Fig. 1, ThCr2Si2-type 122 compounds have a layered tetragonal structure at room temperature. The FeAs layers formed by conjugated [FeAs4] tetrahedra are separated by layers of alkaline earth atoms. In the structure, atoms are located at A 2a (0, 0, 0), Fe 4d (1/2, 0, 1/4), As 4e (0, 0, z). 122 compounds show rich chemistry by allowing substitutions at all three crystallographic sites. For example, alkaline earth elements can be replaced by rare earth ions or alkali ions;Johrendt2008 ; XHChen2008 ; CaPrFe2As2 Fe by various transition metal ions;PaulReview and As by P.GHCao2009 Exotic ground states were obtained with chemical substitution and appropriate substitution at each site can induce superconductivity. As in cuprate superconductors, the electron-hole asymmetry was observed in the phase diagram of iron-based superconductors, which shows the doping dependence of magnetic, structural, and superconducting transitions. The asymmetry is well illustrated in doped BaFe2As2 by comparing hole-doped Ba1-xKxFe2As2 and electron-doped BaFe2-xCoxAs2, mainly due to the availability of high quality single crystals which enable systematic studies using various probes.Mandrus2010 ; Osborn2012 Following the convention in cuprate superconductors, the FeAs layer is sometimes named as conducting layer and the alkaline earth metal networks as spacing layer. In Ba1-xKxFe2As2, K-doping takes place at the spacing layer while FeAs layers remain intact. In contrast, Co substitution in BaFe2-xCoxAs2 disturbs the contiguity of the [FeAs4] tetrahedra and interferes with superconductivity in the conducting layers. This effect coming from substitution at different crystallographic sites has been suggested to contribute to the electron-hole asymmetry in a phase diagram of iron-based superconductors.Osborn2012 From materials design point of view, an ideal material for the study of electron-hole asymmetry should meet the following criteria: (1) substitution takes place at only one crystallographic site, (2) the material can be tuned from electron-doped to hole-doped by varying the ratio between the substitutional and substituted atoms, and (3) the substitutional and substituted atoms should have similar size to minimize the steric effect. Unfortunately, none of the presently studied materials meets the above requirements.
In this work, we report the magnetic and structural transitions in La0.4Na0.6Fe2As2 single crystals. La0.4Na0.6Fe2As2 shows a structural phase transition from a high temperature tetragonal phase to a low-temperature orthorhombic phase at Ts = 125 K. Concomitant with the structural phase transition, the Fe moments order along the a direction with an ordered moment of 0.7(1) at T = 5 K, with the same stripe antiferromagnetic structure as that in other AFe2As2 (A = Ca, Sr, Ba) compounds. The magnetic and structural transitions are accompanied by an anomaly in the temperature dependence of electrical resistivity, anisotropic magnetic susceptibility, and specific heat. The results show that La0.5-xNa0.5+xFe2As2, with an alkali metal and a rare earth ion at the spacing layer, provides a new material platform for the study of iron-based superconductors. More importantly, from simple electron counting, the material could be tuned from electron-doped (x0) to hole-doped (x0) by varying the ratio between the alkali metal and rare earth ions.
II Experimental Details
La0.4Na0.6Fe2As2 single crystals were grown by accident when testing suitable crucibles for the growth of LaFeAsO crystals in NaAs flux. NaAs is an appropriate flux for the growth of millimeter-sized RFeAsO single crystals. The synthesis of NaAs flux and detailed crystal growth process for RFeAsO have been reported previously.YanAPLGrowth YanFluxRequirement La0.4Na0.6Fe2As2 single crystals were grown in NaAs flux with a similar procedure. LaAs powder was first prepared by firing La filings and arsenic chunks in a sealed quartz tube at 900oC for 15 hours. LaAs, (1/3Fe + 1/3Fe2O3) or FeO, and NaAs were mixed with the molar ratio of 1:1:15 inside of a dry glove box filled with He. The mixture was then loaded into a 2 ml alumina crucible covered with an alumina cap. The alumina crucible was further sealed inside of a Ta tube under 1/3 atmosphere of argon gas. The Ta tube was then sealed in an evacuated quartz tube. The entire assembly was heated inside of a box furnace sitting in a fume hood. The furnace was programmed to heat up to 1150oC over 12 hours, hold at 1150oC for 16 hours, and then cooled to 850oC over 100 hours. Once the furnace reached 850oC, the furnace was turned off. Plate-like single crystals were separated from flux by rinsing them with deionized water in a closed fume hood.
Elemental analysis of the crystals was performed using both wavelength dispersive x-ray spectroscopy (WDS) in the electron probe microanalyzer of a JEOL JXA-8200 electron microprobe and energy-dispersive x-ray spectroscopy using a Hitachi-TM3000 microscope equipped with a Bruker Quantax 70 EDS system. Both techniques confirmed the atomic ratio La:Fe:As=0.4:2:2, but the determined Na content varies. The variation of Na content might result from the followings: (1) contamination from the flux. When washing crystals out of flux in water, NaAs reacts with water forming sodium arsenate hydrate staying on the surface. This might contaminate some measurements; (2) reaction with water. Since the sample is moisture sensitive, some Na in the surface layers might be removed by reacting with water when isolating the crystals from flux, or moisture when exposing in air; and (3) the alkali ions tend to be nonuniform in crystals. To better determine the composition, we utilized single crystal x-ray diffraction. Instead of washing the crystals out of NaAs flux, one small piece of crystal was manually picked up from the flux inside of a dry glove box. The crystal was then cut to a suitable size (0.1 mm on all sides) inside Paratone N oil under an optical microscope. Because the crystals are very soft and malleable, extreme care was taken not to deform them. Single crystal x-ray diffraction measurements were performed on a Bruker SMART APEX CCD-based single crystal X-ray diffractometer with Mo Kα ( = 0.71073 ) radiation. Data collection was performed at 100(2) K and 173(2) K, respectively. The sample was cooled using a cold nitrogen stream. The structure solution by direct methods and refinement by full matrix least-squares methods on F2 were carried out using the SHELXTL software package. SADABS was used to apply absorption correction.
Room temperature x-ray diffraction patterns were collected on a X’Pert PRO MPD X-ray Powder Diffractometer using the Ni-filtered Cu-Kα radiation. Magnetic properties were measured with a Quantum Design (QD) Magnetic Property Measurement System in the temperature interval 1.8 K T 350 K. The temperature dependent specific heat and electrical transport data were collected using a 14 Tesla QD Physical Property Measurement System in the temperature range of 1.9 K T 300 K. The electrical resistivity measurements were performed with a four-probe technique on specimens having typical size of 0.50.012 mm3. Four pieces of platinum wire are attached to the surface of the specimen via silver paste.
For the neutron scattering measurements, a 3 mg as-grown square shaped single crystal of approximate dimensions 2.5 mm2.5 mm mm was selected. High-resolution elastic neutron scattering experiments were carried out on the cold-neutron triple-axis spectrometer PANDA at the MLZ in Garching (Germany). Vertically focused Pyrolytic Graphite (PG) (0 0 2) monochromator and analyzer were used. The measurements were carried out with fixed incoming and final wave vectors of ki = kf = 1.57 -1 and 2.57 -1, which correspond to neutron wavelengths of 4.002 and 2.445 , respectively. A liquid nitrogen cooled Be filter after the sample was used to reduce the second order contamination for the kf = 1.57 -1. For the shorter wavelengths (kf = 2.57 -1), PG filter was used on the same place. Due to the geometrical limitation, the shorter wavelength was employed for the measurements of the integrated intensities of the structural and magnetic peaks. The larger wavelength was used for the rest of the measurements due to the higher flux. The single crystal was mounted on an Aluminum pin using very small amount of GE-Varnish and mounted inside a bottom-loading closed cycle refrigerator. Slits before and after the sample were used to reduce the background. The measurements were performed in the (1 1 0)T-(0 0 1)T scattering plane. Measurements at PANDA were performed at temperatures between 5 and 150 K. We will use tetragonal (T) and orthorhombic (O) subscripts for the reflections whenever necessary.
III Results and Discussion
The inset of Fig. 1 shows a picture of one piece of single crystal against a millimeter scale. The as-grown crystals are platelike with typical dimensions of 220.1 mm3. We tried x-ray powder diffraction measurement of pulverized single crystals, but the powder has strong preferred orientation and impurities are always observed because the ground powder is moisture sensitive. We thus examined the ab-plane of the crystals by mounting the platelike crystals on a powder diffractometor. As expected, only (0 0 l) (l = 2n) reflections were observed (see Fig. 1), indicating the crystallographic c-axis is perpendicular to the plane.
The c-lattice parameter of 12.20 obtained from 2 values of (0 0 l) reflections is much larger than 8.746 expected for LaFeAsO.YanAPLGrowth Elemental analysis confirmed Fe/As1 in the as-grown crystals, but the results show (1) Fe/La ratio is 5 which is significantly different from 1 expected for LaFeAsO, and (2) a significant amount of Na was observed while previous studies observed no Na in LaFeAsO crystals grown in a similar procedure. The above suggests that the obtained crystals are not LaFeAsO. Considering the c-lattice parameter is similar to that of AFe2As2 (A=Ba, Sr, Ca, and Eu) and NaFe2As2,122structure ; JohnstonReview ; Chu2010 the initial refinement of single crystal x-ray diffraction data was performed with the atomic coordinates of CaFe2As2 but with La and Na at Ca site. Site occupation factors were checked by freeing individual occupancy factors of atom sites. This procedure revealed that the stoichiometry of the crystal is La0.4Na0.6Fe2As2. The La:Fe:As ratio agrees with that determined from elemental analysis. Table I shows the refinement parameters and selected crystallographic data.
The only difference between the growth performed in this work and that for the growth of LaFeAsO is the use of an Al2O3 crucible inside of Ta tube. With the same starting materials and heat treatment process, the growth always results in La0.4Na0.6Fe2As2 once the flux is in direct contact with an Al2O3 crucible; but LaFeAsO crystals otherwise. Varying the charge/flux ratio from 1:10 to 1:20 doesn’t affect the composition of the as-grown crystals. The above observation indicates that the flux becomes oxygen free once Al2O3 crucible is used to contain the melt. After crystal growth, the Al2O3 crucible turns to be grey and reaction between the crucible and flux can be observed especially along the grain boundaries. The successful growth of LaFeAsO crystals from NaAs flux has been attributed to some reasonable solubility and diffusivity of oxygen in NaAs flux by forming NaAsO2.YanFluxRequirement NaAsO2 has a low melting temperature 600∘C and can react with the Al2O3 crucible at high homogenizing temperature used in our growth. The reaction might consume the oxygen in the melt and maintain an oxygen-free environment for the growth of La0.4Na0.6Fe2As2.
| Temperature (K) | 100(2) | 173(2) |
|---|---|---|
| Radiation, wavelength () | Mo K, 0.71073 | Mo K, 0.71073 |
| Space group, Z | Fmmm (No. 69), 4 | I4/mmm (No. 139), 2 |
| a () | 5.4697(11) | 3.8669(3) |
| b () | 5.4740(11) | 3.8669(3) |
| c () | 12.068(2) | 12.108(2) |
| V (3) | 361.34(13) | 181.05(4) |
| range ( ) | 3.38-28.27 | 3.37-28.25 |
| R1* (all data) | 0.0188 | 0.0169 |
| wR2* (all data) | 0.0487 | 0.0410 |
| Goodness-of-fit on F2 | 1.160 | 1.215 |
| Largest diff. peak/hole (e-/3) | 1.64/-3.16 | 1.17/-2.04 |
| Atomic parameters | ||
| La/Na | 2a(0,0,0) | 2a(0,0,0) |
| Uiso(2) = 0.00953 | 0.0115 | |
| Occupancy La/Na = 0.406/0.594 | 0.402/0.598 | |
| Fe | 8f(0.25,-0.75,0.25) | 4d(0,0.5,0.25) |
| Uiso(2) = 0.0078 | 0.0098 | |
| As | 8i(0,-0.5,0.13558) | 4e(0,0,0.3644) |
| Uiso(2) = 0.00793 | 0.010 | |
| Bond lengths | ||
| Fe-As () | 2.3768(4) | 2.3785(4) |
| Fe-Fe () | 2.7348(6), 2.7370(6) | 2.7343(2) |
| Bond angles | ||
| As-Fe-As (deg) | 108.97(5),109.69(5),109.76(3) | 108.76(4),109.83(4) |
* R1=F0-Fc/F0; wR2=w(F02-Fc2)2/w(F02)21/2, where w=1/2F02+(AP)2+BP, and P=(F02+2Fc2)/3; A and B are weight coefficients.
Despite tremendous effort in exploring new iron-based superconductors, there is no report about replacing the alkaline earth ions in AFe2As2 compounds with a mixture of one rare earth ion (R3+) and one alkali metal, i.e., no compound with the chemical formula R3+1-xBxFe2As2 (R = rare earth, B = alkali). This is understandable since R3+Fe2As2 compounds don’t exist due to the tolerance of the tetragonal ThCr2Si2 structure to electron count; and NaFe2As2 is a metastable phase, which has been suggested to be due to the size mismatch between the square prismatic site and Na+.Clarke2010 ; Chu2010 Thus, both the ionic radius and electron count contribute to the stability of the tetragonal ThCr2Si2 structure.Hoffmann1985 Considering the little difference in the ionic radii of Na+ (1.18 ), La3+ (1.16 ), and Ca2+ (1.12 ),Shannon the tolerance of the ThCr2Si2 structure to the electron count may play a major role in stabilizing La0.5-xNa0.5+xFe2As2 phase. The successful growth of La0.4Na0.6Fe2As2 single crystals in this work suggests that stable La0.5-xNa0.5+xFe2As2 can be synthesized despite the instability of the parent compounds. A wide range of x might be expected considering the studies of Ca1-xRxFe2As2,CaPrFe2As2 Ca1-xNaxFe2As2,CaNaFe2As2 and Ba1-xNaxFe2As2.BaNaFe2As2
We noticed that superconductivity was observed in Eu1-xBxFe2As2 (B=Na, and K), which also has a rare earth ion and alkali metal sharing the 2a site.EuKFe2As2 ; EuNaFe2As2 However, Eu is expected to be 2+ and EuFe2As2 has been claimed as a magnetic homologue of SrFe2As2 with the magnetic order of Eu2+ sublattice at 20 K.EuFe2As2 Varying the Eu/B ratio in Eu1-xBxFe2As2 only changes the hole concentration but cannot lead to electron doping.
It has been well established that other AFe2As2 (A = Ca, Sr, Ba, and Eu) members show a structural transition from a high temperature tetragonal phase (space group I4/mmm) to a low temperature orthorhombic phase (space group Fmmm).JohnstonReview Single crystal x-ray diffraction performed at 100 K (see Table I for refinement and structural parameters) confirmed the orthorhombic symmetry for La0.40Na0.60Fe2As2. This suggests that for La0.40Na0.60Fe2As2 a structural transition takes place in the temperature range 100 K T 173 K. To further reveal the details of this structural transition, we measured the magnetic, transport, and thermodynamic properties, and performed single crystal neutron diffraction.
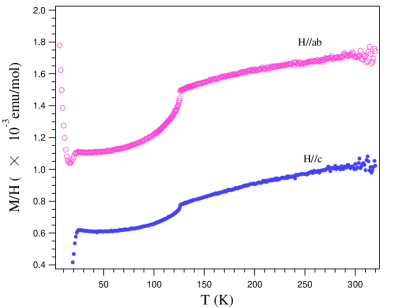
Figure 2 shows the temperature dependence of magnetic susceptibility = M/H measured in an applied magnetic field of 50 kOe. 6 pieces of plate-like crystals were coaligned with c-axis parallel to each other. The measurement was performed with the magnetic field applied perpendicular and parallel to the crystallographic c-axis, respectively. As shown in Fig. 2, a clear anisotropy with abc was observed in the whole temperature range studied, and a steplike change in both ab and c signals a transition at Ts = 125 K. Above Ts, both ab and c increase linearly with increasing temperature. The temperature dependence and anisotropy of magnetic susceptibility are similar to those of AFe2As2 (A = Ca, Sr, and Ba). The magnitude of room temperature ab and c are similar to those of CaFe2As2.XHChen2008 The anomalies below 28 K in ab and c curves are due to surface superconductivity as discussed later.
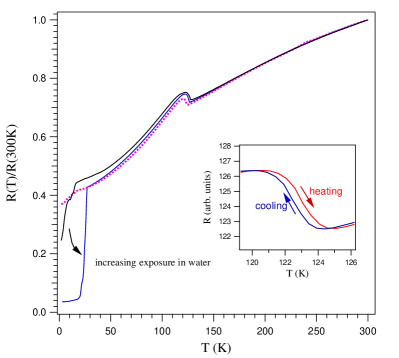
Figure 3 shows the temperature dependence of the in-plane electrical resistivity normalized by the room temperature value R(300K). For all pieces measured, an anomaly around 125 K was observed and this temperature agrees well with that observed in the above magnetic measurement. Across this anomaly, a hysteresis of 0.6 K, as highlighted in the inset of Fig. 3, was observed suggesting the first order nature of this transition. The increase of electrical resistivity while cooling across 125 K and the hysteresis are similar to those in CaFe2As2.XHChen2008 A drop of resistivity was normally observed below 30 K signaling filamentary superconductivity. This resistivity drop becomes larger in magnitude and sharper in transition width with increasing exposure of crystals in water. Once the crystal was immersed in water for over 6 hours, superconductivity with Tc 26 K shows up (Here Tc was defined as the temperature where zero resistivity was observed. Resistivity starts to drop at 28 K.). Heat treatment of the crystals at 300oC in sealed quartz tube can suppress the low temperature drop. As shown in Figure 3, after an overnight heat treatment, the sharp drop in resistivity is suppressed and shifts to a lower temperature. However, once the heat treated crystals were left in air for further exposure, the suppressed resistivity drop comes back. The recovery of the resistivity drop becomes faster once the crystals were immersed in water. This suggests that the observed superconductivity stays on the crystal surface and is induced by moisture as in SrFe2As2 and FeTe0.8S0.2.WaterSrFe2As2 ; FeTeS The magnetic measurements (not shown) of one crystal with zero resistivity in a field of 10 Oe also support the surface superconductivity scenario.
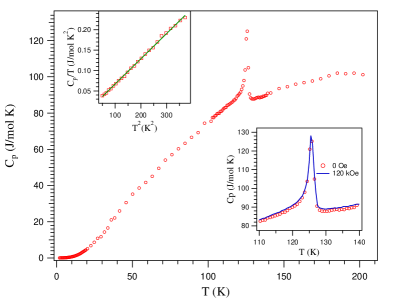
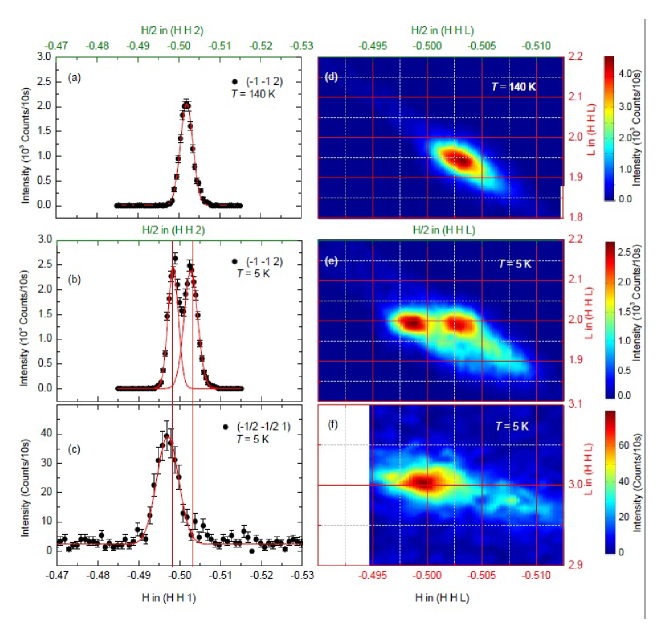
Figure 4 shows the temperature dependent specific heat data measured in the temperature interval 1.9 K T 200 K on one piece of as-grown crystal with a sharp resistivity drop at 26 K. A pronounced anomaly was observed at Ts 125 K. No anomaly was observed around 26 K, which suggests that the resistivity drop shown in Fig. 3 doesn’t represent bulk behavior. The lower inset of Fig. 4 shows the data measured in an applied magnetic field of 120 kOe; little field effect was observed on this lambda-type anomaly. The upper inset to Fig. 4 shows the low-temperature Cp/T data plotted as a function of T2. The fitting of specific heat data in the range 50 T2 350 K2 to the standard power law, Cp/T = T2 yields = 5.1 mJ/mol K2 and = 0.64(1) mJ/mol K4, where is the Sommerfeld electronic specific heat coefficient and the coefficient of the Debye T3 lattice heat capacity at low temperatures. The latter gives the Debye temperature D with the following relation D = (124NAkBn/5)1/3, where n is the number of atoms per formula unit, NA is Avogadro’s constant and kB is Boltzmann’s constant. With n = 10 and = 0.64(1) mJ/mol K4, the Debye temperature is D = 250 K. Both the Sommerfeld coefficient and Debye temperature are comparable to those of CaFe2As2.NiCaFe2As2
To further investigate the structural phase transition and magnetic order, single crystal neutron diffraction measurements were performed in the temperature range 5 K T 150 K. At T = 300 K, the crystal structure is well described by a tetragonal lattice with lattice parameters a = 3.875(5) and c = 12.224(5) . Figure 5 (a) shows ( 0) scan through the nuclear (-1 -1 2)T reflection at T = 140 K. A single peak shape, consistent with the tetragonal symmetry of the lattice, was observed. Figure 5 (d) shows corresponding two-dimensional (2-D) map at the same temperature, further confirming single peak shape of the (-1 -1 2)T reflection. As the sample is cooled below Ts, the (-1 -1 2)T peak splits into two, indicating orthorhombic crystal structure with as shown in Figure 5(b). In fact depending on the resolution of the instrument and the scattering plane a maximum of four peaks could be present. Figure 5 (e) shows corresponding 2-D map indicating almost equal population of the twin domains. Having established structural phase transition in this compound, extensive search for the magnetic peak was performed at T = 5 K. In particular, ( 0) scans along the [ 0], [ 1] and [ 2] directions and L-scan along the [0 0 L] direction were performed to detect magnetic peaks, if any. Magnetic signal was found at the (- - 1)T position. Figure 5 (c) shows ( 0) scan through the magnetic (- - 1)T reflection which is associated with the left nuclear twin in Fig. 5 (b). In fact, the H position of the magnetic reflection appears at the exactly half value of the left nuclear twin which implies that the magnetic reflection is associated with the larger orthorhombic axis i.e. the a axis and the magnetic propagation vector is (1 0 1)O. 2D map for the (- - 3)T reflection in Fig. 5 (f) also confirms that the magnetic propagation vector is (1 0 1)O.
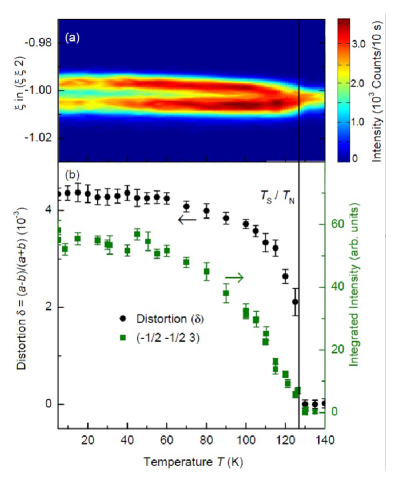
To determine the structural phase transition temperature, ( 0) scans were performed through the (-1 -1 2)T reflection as a function of temperature and are shown in Fig. 6 (a). Broadening of the Full-Width-Half-Maxima (FWHM) of the (-1 -1 2)T reflection below T = (128.0 0.5) K indicates a structural phase transition at this temperature. Figure 6(b) shows temperature dependence of the orthorhombic distortion, , measured during heating of the sample. Orthorhombic distortion increases continuously to the lowest achievable temperature of 5 K. The orthorhombic distortion is similar to that in BaFe2As2, Johrendt2008 but smaller than that in SrFe2As2 or CaFe2As2.NiCaFe2As2 ; YanSrFe2As2 Figure 6(b) shows temperature dependence of the magnetic reflection (- - 3)T indicating onset of the Fe magnetic order at T = (128.0 0.5) K, the same temperature as the structural phase transition. At this point it is interesting to compare the results of the structural and magnetic phase transitions in other known 122 compounds. Similar concomitant structural and magnetic phase transitions were observed previously in the parent AFe2As2 (A = Ca, Sr, Ba) compounds.JohnstonReview ; JeffReview It is likely that the tetragonal to orthorhombic phase transition is absent in the metastable superconductor NaFe2As2. However, no structural studies as a function of temperature are available for the NaFe2As2.Chu2010 ; BaNaFe2As2 ; NaFeAs Various studies also suggest the absence of the structural phase transition for the other known 122 systems such as KFe2As2, RbFe2As2 and CsFe2As2.KFe2As2 ; RbFe2As2 ; CsFe2As2 For the (Ca1-xNax)Fe2As2 samples, doping dependence studies show the structural phase transition for x0.36. From x0.36 to the highest studied doping level of x0.66, macroscopic measurements show no hint of structural phase transition.CaNaFe2As2 For the (Ba1-xNax)Fe2As2 samples, the structural and magnetic phase transition temperature decreases monotonically as a function of doping and for x0.3, no structural phase transition was observed.BaNaFe2As2 The magnetic and structural transitions are coincident and first order in (Ba1-xNax)Fe2As2 unlike the Co-doped BaFe2As2 where the two transitions are separated.Nandi ; Ni2010 ; Canfield2009 ; Dan ; Andy
We noticed that the transition temperature determined with neutron diffraction is about 3 K higher than that determined from magnetic susceptibility, electrical resistivity, and specific heat. Since only one transition was observed in all bulk measurements, we believe this 3 K difference comes from the instrument. Our neutron measurements clearly demonstrate the same (within 0.5 K) transition temperature for the structural and magnetic phase transitions.
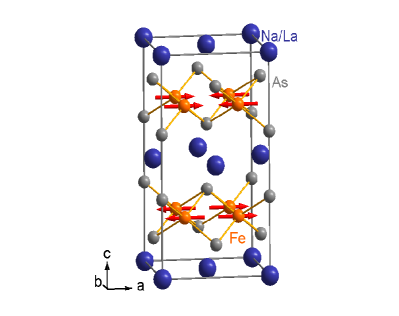
At low temperatures (T = 5 K) a set of structural and magnetic peaks were collected for the determination of Fe magnetic structure. The nuclear reflections were fitted with the structural parameters listed in Table I taking proper account of the nuclear twins. The magnetic reflections can be well fitted with the stripe antiferromagnetic structure with moments along the a direction and with an ordered moment of 0.7(1) at T = 5 K. Figure 7 shows the magnetic structure. According to this magnetic structure, the Fe moments are antiferromagnetically aligned along the a direction and ferromagnetically along the b direction, the same as the reported stripe antiferromagnetic structure of the AFe2As2 (A = Ca, Sr, Ba) compounds.JeffReview A stripe antiferromagnetic structure with moments along the b direction produced much larger and hence, was discarded.
IV Conclusions
We have grown La0.40Na0.60Fe2As2 single crystals and studied the magnetic and structural transitions. La0.40Na0.60Fe2As2 shows the following features similar to other well studied AFe2As2 (A = Ca, Sr, Ba) compounds: (1) It undergoes a structural phase transition at Ts =125 K from the high temperature tetragonal phase (space group I4/mmm)to the low temperature orthorhombic phase (space group Fmmm); (2) Concomitant with the structural phase transition, the Fe moments (0.7(1) at T = 5 K) order along the a direction with the low temperature stripe antiferromagnetic structure; (3)This structural transition is accompanied by anomalies in the temperature dependence of electrical resistivity, anisotropic magnetic susceptibility, and specific heat.
The above similarities suggest that La0.5-xNa0.5+xFe2As2, or even compounds with other rare earth (R3+) and alkali ions in the spacing layer, provides a new material platform for the study of iron-based superconductors. A unique feature for La0.5-xNa0.5+xFe2As2 is that it can be tuned from electron-doped (x0) to hole-doped (x0) by varying the La/Na ratio. This enables the study of the electron-hole asymmetry without disturbing the FeAs conducting layer. The composition studied in this work is hole-doped from a simple electron counting, which is supported by our preliminary photoemission study. Following the phase diagrams for the hole-doped Ba1-xKxFe2As2 and the electron-doped BaFe2-xCoxAs2, where doping suppresses the structural and magnetic transitions, La0.5Na0.5Fe2As2, which can be looked as one parent compound in La0.5-xNa0.5+xFe2As2, would show structural and magnetic transitions at temperatures higher than 125 K. Our work calls for both theoretical and experimental efforts in this system. The first step is to determine the range of x for which La0.5-xNa0.5+xFe2As2 is stable.
We noticed that in NaAs flux our growth always obtained La0.40Na0.60Fe2As2 crystals even though we varied the charge/flux ratio purposely. This signals that La0.40Na0.60Fe2As2 is the stable phase in NaAs-rich region. Crystal growth in FeAs flux might be a better approach to synthesize compounds with a different La/Na ratio.
V Acknowledgments
JQY thanks Chenglin Zhang, Brandt Jensen, Kevin Dennis, and Alfred Kracher for help in crystal growth and elemental analysis. SN acknowledges S. Mayr for the technical assistance with the Laue camera. Work at ORNL and at Ames Laboratory was supported by the US Department of Energy, Office of Sciences, Basic Energy Science, Materials Sciences and Engineering Division. Ames Laboratory is operated for the US DOE by Iowa State University under Contract No. DE-AC02-07CH11358.
References
- (1) Y. Kamihara, T. Watanabe, M. Hirano, and H. Hosono, J. Am. Chem. Soc. 130, 3296 (2008).
- (2) M. Rotter, M. Tegel, and D. Johrendt, Phys. Rev. Lett. 101,107006 (2008).
- (3) X.C. Wang, Q.Q. Liu, Y.X. Lv, W.B. Gao, L.X. Yang, R.C. Yu, F.Y. Li, and C.Q. Jin, Solid State Commun. 148, 538 (2008).
- (4) F.-C. Hsu, J.-Y. Luo, K.-W. Yeh, T.-K. Chen, T.-W. Huang, P.M. Wu, Y.-C. Lee, Y.-L. Huang, Y.-Y. Chu, D.-C. Yan, and M.-K. Wu, Proc. Nat. Acad. Sci. USA 105,14262 (2008).
- (5) H. Ogino, Y. Matsumura, Y. Katsura, K. Ushiyama, S. Horii, K. Kishio, and J.-I. Shimoyama, Supercond. Sci. Technol. 22,075008 (2009).
- (6) N. Ni, J. M. Allred, B. C. Chan, R.J. Cava, Proc. Nat. Acad. Sci. USA 108,1019 (2011).
- (7) D. Mandrus, A.S. Sefat, M.A. McGuire, and B.C. Sales, Chem. Mater. 22,715 (2010).
- (8) G. Wu, R. H. Liu, H. Chen, Y. J. Yan, T. Wu, Y. L. Xie, J. J. Ying, X. F. Wang, D. F. Fang and X. H. Chen, Europhys. Lett. 84,27010 (2008).
- (9) S. R. Saha, N. P. Butch, T. Drye, J. Magill, S. Ziemak, K. Kirshenbaum, P. Y. Zavalij, J. W. Lynn, J. Paglione, Phys. Rev. B 85,024525 (2012).
- (10) G Wu, H Chen, T Wu, Y L Xie, Y J Yan, R H Liu, X F Wang, J J Ying and X H Chen, J. Phys.: Condens. Matter 20,422201(2008).
- (11) P.C. Canfield, and S.L. Bud’ko, Annu. Rev. Condens. Matter Phys. 1,27(2010).
- (12) S. Jiang, H. Xing, G. Xuan, C. Wang, Z. Ren, C. Feng, J. Dai, Z. Xu, and G. Cao, J. Phys.: Condens. Matter 21,382203(2009).
- (13) S. Avci, O. Chmaissem, D. Y. Chung, S. Rosenkranz, E. A. Goremychkin, J. P. Castellan, I. S. Todorov, J. A. Schlueter, H. Claus, A. Daoud-Aladine, D. D. Khalyavin, M. G. Kanatzidis, and R. Osborn, Phys. Rev. B 85,184507 (2012).
- (14) J.-Q. Yan, S. Nandi, J. L. Zarestky, W. Tian, A. Kreyssig, B. Jensen, A. Kracher, K. W. Dennis, R. J. McQueeney, A. I. Goldman, R. W. McCallum, and T. A. Lograsso, Appl. Phys. Lett., 95, 222504 (2009).
- (15) J.-Q. Yan, B. Jensen, K. W. Dennis, R. W. McCallum, and T. A. Lograsso, Appl. Phys. Lett., 98, 072504 (2011).
- (16) M. Pfisterer, and G. Nagorsen, Z. Naturforsch. B: Chem. Sci. 35, 703(1980).
- (17) D.C. Johnston, Advances in Physics 59,803(2010).
- (18) M. Gooch, B. Lv, K. Sasmal, J.H. Tapp, Z.J. Tang, A.M. Guloy, B. Lorenz, C.W. Chu, Physica C 470,S276 (2010).
- (19) R. Cortes-Gil, D.R. parker, M.J. Pitcher, J. Hadermann, and S.J. Clarke, Chem. Mater. 22,4304 (2010).
- (20) R. Hoffmann, and C. Zheng, J. Phys. Chem. 89,4175(1985).
- (21) R.D. Shannon, Acta Cryst. A32,751(1976).
- (22) K. Zhao, Q.Q. Liu, X. C. Wang, Z. Deng, Y. X. Lv, J. L. Zhu, F. Y. Li, C.Q.Jin, Phys. Rev. B 84,184534 (2011).
- (23) S. Avci, J. M. Allred, O. Chmaissem, D. Y. Chung, S. Rosenkranz, J. A. Schlueter, H. Claus, A. Daoud-Aladine, D. D. Khalyavin, P. Manuel, A. Llobet, M. R. Suchomel, M. G. Kanatzidis, and R. Osborn, Phys. Rev. B 88,094510 (2013).
- (24) H. S. Jeevan, Z. Hossain, Deepa Kasinathan, H. Rosner, C. Geibel, and P. Gegenwart, Phys. Rev. B 78,092406 (2008).
- (25) Yanpeng Qi, Lei Wang, Zhaoshun Gao, Xianping Zhang, Dongliang Wang, Chao Yao, Chunlei Wang, Chengduo Wang and Yanwei Ma, New Journal of Physics 14,033011 (2012).
- (26) H. S. Jeevan, Z. Hossain, D. Kasinathan, H. Rosner, C. Geibel, and P. Gegenwart, Phys. Rev. B 78,052502 (2008).
- (27) Hidenori Hiramatsu, Takayoshi Katase, Toshio Kamiya, Masahiro Hirano, and Hideo Hosono, Phys. Rev. B 80,052501 (2009).
- (28) Y. Mizuguchi, K. Deguchi, S. Tsuda, T. Yamaguchi, and Y. Takano, Phys. Rev. B 81,214510 (2010).
- (29) N. Ni, S. Nandi, A. Kreyssig, A. I. Goldman, E. D. Mun, S. L. Bud ko, and P. C. Canfield, Phys. Rev. B 78,014523 (2008).
- (30) J.-Q. Yan, A. Kreyssig, S. Nandi, N. Ni, S. L. Bud ko, A. Kracher, R. J. McQueeney, R. W. McCallum, T. A. Lograsso, A. I. Goldman, and P. C. Canfield, Phys. Rev. B 78,024516 (2008).
- (31) J.W. Lynn, and P.C. Dai, Physica C 469,469 (2009).
- (32) G. M. Friederichs, I. Schellenberg, R. Pottgen, V. Duppel, L. Kienle, J. S. Gunne, and D. Johrendt, Inorg. Chem. 51,8161 (2012).
- (33) M. Rotter, M. Pangerl, M. Tegel, and D. Johrendt, Angew. Chem. Int. Ed. 47, 7949 (2008).
- (34) S. Peschke, T. St rzer, and D. Johrendt, Z. Anorg. Allg. Chem. 640,830 (2014).
- (35) A. F. Wang, B. Y. Pan, X. G. Luo, F. Chen, Y. J. Yan, J. J. Ying, G. J. Ye, P. Cheng, X. C. Hong, S. Y. Li, and X. H. Chen, Phys. Rev. B 87,214509 (2013).
- (36) S. Nandi, M. G. Kim, A. Kreyssig, R. M. Fernandes, D. K. Pratt, A. Thaler, N. Ni, S. L. Bud’ko, P. C. Canfield,J. Schmalian, R. J. McQueeney, and A. I. Goldman, Phys. Rev. Lett. 104,057006 (2010).
- (37) N. Ni, A. Thaler, J. Q. Yan, A. Kracher, E. Colombier, S. L. Bud’ko, and P. C. Canfield, Phys. Rev. B 82,024519 (2010).
- (38) P. C. Canfield, S. L. Bud’ko, Ni Ni, J. Q. Yan, and A. Kracher, Phys. Rev. B 80,060501(R) (2009).
- (39) D. K. Pratt, W. Tian, A. Kreyssig, J. L. Zarestky, S. Nandi, N. Ni, S. L. Bud’ko, P. C. Canfield, A. I. Goldman, and R. J. McQueeney, Phys. Rev. Lett. 103,087001 (2009).
- (40) A. D. Christianson, M. D. Lumsden, S. E. Nagler, G. J. MacDougall, M. A. McGuire, A. S. Sefat, R. Jin, B. C. Sales, and D. Mandrus, Phys. Rev. Lett. 103,087002 (2009).