Derivation of an optical potential for statically deformed rare-earth nuclei from a global spherical potential
Abstract
The coupled-channel theory is a natural way of treating nonelastic channels, in particular those arising from collective excitations characterized by nuclear deformations. A proper treatment of such excitations is often essential to the accurate description of experimental nuclear-reaction data and to the prediction of a wide variety of scattering observables. Stimulated by recent work substantiating the near validity of the adiabatic approximation in coupled-channel calculations for scattering on statically deformed nuclei, we explore the possibility of generalizing a global spherical optical model potential (OMP) to make it usable in coupled-channel calculations on this class of nuclei. To do this, we have deformed the Koning-Delaroche global spherical potential for neutrons, coupling a sufficient number of states of the ground state band to ensure convergence. We present an extensive study of the effects of collective couplings and nuclear deformations on integrated cross sections as well as on angular distributions for neutron-induced reactions on statically deformed nuclei in the rare-earth region. We choose isotopes of three rare-earth elements (Gd, Ho, W), which are known to be nearly perfect rotors, to exemplify the results of the proposed method. Predictions from our model for total, elastic and inelastic cross sections, as well as for elastic and inelastic angular distributions, are in reasonable agreement with measured experimental data. These results suggest that the deformed Koning-Delaroche potential provides a useful regional neutron optical potential for the statically deformed rare earth nuclei.
pacs:
24.10.-i, 24.10.Eq, 24.10.Ht, 24.50.+g, 25.40.-hI Introduction
The optical model has proven over the years to be a powerful method to describe observed nuclear reaction data Satchler and Love (1979). It significantly reduces the complexity of the scattering problem by employing a complex optical potential that implicitly reproduces the loss of flux due to excitation of internal degrees of freedom of the nuclei as well as to the opening of inelastic channels. The parameters of such potentials are often determined by a phenomenological fit to relevant experimental data either on individual nuclei, nuclei within a region, or globally a large portion of the periodic table. Over the last several decades, a number of global optical potentials for neutron and proton scattering have been determined by fitting data on a wide variety of spherical nuclei. A particularly successful spherical global potential, which we employ in the present work, was produced by Koning and Delaroche (KD) Koning and Delaroche (2003).
Regions of high static nuclear deformation, such as the ones found in the rare earth and actinide nuclei, have in general been excluded in the development of global potentials. Highly deformed nuclei require a coupled channels (CC) treatment that accounts for the direct excitation of the rotational states of the target in order to reproduce experimental data accurately. It has been conventionally assumed that potentials used in CC calculations on rotational nuclei must be significantly altered from those for spherical nuclei, since the inelastic channels treated directly in the CC calculations should no longer be included implicitly in the optical potential used in these calculations. On the other hand, recent work Dietrich et al. (2012) has shown that scattering from statically deformed nuclei in the rare-earth and actinide nuclei is very close to the adiabatic limit. That is, the nuclei may be regarded as nearly “frozen” during the scattering process. This suggests that loss of flux through excitation of the rotational degrees of freedom might not play a fundamental role in determining the optical potential. In this paper, we test the hypothesis that a global spherical optical potential, appropriately deformed, can describe neutron scattering observables in the rare earth region without needing a significant alteration of its parameters. An extension of these tests to actinide nuclei will be presented in a later paper Dietrich (2013).
The KD neutron global optical potential is particularly suitable for these tests because it has been successfully fitted to a wide variety of experimental data over a wide energy range (0–200 MeV) on nuclei with masses both below and above the deformed rare earth region. Since the KD potential is parameterized as a smooth function of target mass and the asymmetry parameter , we assume that its interpolation into the rare earths is a useful starting point for the current investigations. We use the KD potential as the bare potential for coupled-channel calculations without any changes in its parameterization, except by a small reduction of the radius of the real central part of the potential to ensure conservation of its volume integral when it is deformed.
We have carried out calculations of neutron-scattering observables on isotopes of Gd, Ho, and W. The results indicate that the deformed KD potential produces a fairly satisfactory representation of the experimental data without further adjustment. This is particularly true for the real potential, which determines the angles of the maxima and minima in angular distributions, as well as the positions of the maxima and minima in the Ramsauer oscillations of the total cross sections. In many cases, the back-angle cross sections of the angular distributions are well reproduced by the calculations, whereas in others they are somewhat underpredicted. We did not find an easy way to alter the potential (in particular, its imaginary part) in a manner that varies slowly with mass and also achieves a fully satisfactory description in all cases. Nevertheless, the prescription described here appears to yield a useful regional potential for the deformed rare-earth region that takes advantage of the extensive physical content already built into the global KD potential.
We note two alternative approaches that have been taken to unify scattering on spherical and deformed nuclei. Kunieda et al. Kunieda et al. (2007) have developed a global phenomenological potential in which they considered all nuclei as statically deformed, regardless of their actual deformation. The use of microscopic folding models is promising, since the nuclear densities used in such models may be either spherical or deformed. In fact, a folding model with an interaction based on the nuclear matter optical potential of Jeukenne, Lejeune, and Mahaux (JLM) Jeukenne et al. (1974, 1977a, 1977b), which is usually carried out in spherical nuclei, has been successfully applied to the deformed rare earth Gd isotopes Bauge et al. (2000). Similar extensions to deformed nuclei might usefully be carried out with other microscopic treatments, such as those of Refs. Nobre et al. (2010, 2011).
II Coupled-channel model for rare-earths
The process of deforming a spherical OMP to explicitly consider collective excitations within the coupled-channel framework is done in the standard way of replacing the radius parameter in each Woods-Saxon form factor by the angle dependent expression:
| (1) |
where is the undeformed radius of the nucleus, and and are the deformation parameter and spherical harmonic for the multipole , as described in Ref. Krappe (1976), for example. The deformed form factor obtained using Eq. 1 is then expanded in Legendre polynomials numerically.
We use in our calculations the Empire reaction code Herman et al. (2007, 2013), in which the direct reaction part is calculated by the code Ecis Raynal (1970, 1972). In previous works Nobre et al. (2014a, b); Herman et al. (2014), we made preliminary tests of our model by performing coupled-channel calculations, coupling to the ground state rotational band, for neutron-incident reactions on selected rare-earth nuclei, namely 152,154Sm, 153Eu, 155,156,157,158,160Gd, 159Tb, 162,163,164Dy, 165Ho, 166,167,168,170Er, 169Tm, 171,172,173,174,176Yb, 175,176Lu, 177,178,179,180Hf, 181Ta, and 182,183,184,186W. All of these nuclides have at least 90 neutrons, which is a reasonable indicator for static deformation, therefore making them suitable candidates for testing our model based on the approximate validity of the adiabatic limit. As an initial test, we then compared the coupled-channel results for total cross sections with plain spherical calculations using the undeformed KD optical potential. In this initial step, only quadrupole deformations were considered, with values for the deformation parameters taken from the compilation of experimental values from Raman et al. Raman et al. (2001). The overall result, as seen in Refs. Nobre et al. (2014a, b); Herman et al. (2014), is a very significant improvement in the agreement with experimental data, in particular for the lower incident-neutron energies (below about 1 MeV).
II.1 Radius correction for volume conservation
When an originally spherical configuration assumes a deformed shape, defined by quadrupole and hexadecupole deformation parameters and , respectively, the volume and densities are not conserved. In Ref. Bang and Vaagen (1980), a method to ensure volume conservation was described, implemented by applying a correction to the nuclear radius , of the form:
| (2) |
in which is the corrected radius, and where terms of the order of and higher have been discarded. In Ref. Nobre et al. (2014a) we tested the effects of such correction, and showed that while the difference in calculation results is quite small, it is not negligible and seems to bring the integral and differential cross-section calculations into slightly better agreement with the experimental data. As a result of these tests, we adopt the radial correction expressed in Eq. 2 in the following calculations and further tests of the model.
II.2 Compound-nucleus parameterization
Even though the model being tested in this work probes the direct-reaction mechanism, it is also important to obtain a reliable description of the processes involved after the formation of the compound nucleus, following neutron absorption. Such compound contributions to the elastic and inelastic channels are much smaller than their direct-reaction correspondents (shape elastic and direct inelastic excitation) at sufficiently high energies, but make significant contributions to some of the reactions we consider here at low incident energies (typically in the neighborhood of 1–2 MeV or less).
The models adopted to describe the emissions from the compound nucleus were basically the standard options within the Empire code, which means standard Hauser-Feshbach model with properly parameterized Enhanced Generalized Superfuid Model (EGSM) level densities D’Arrigo et al. (1994, 1992), modified Lorentzian distribution (version 1) for -ray strength functions Plujko (2000a, b); Plujko et al. (2001), width fluctuation correction implemented up to 3 MeV in terms of the HRTW approach Hofmann et al. (1975, 1980), and with transmission coefficients for the inelastic outgoing channels also calculated within the coupled-channel approach (the KD potential was also used in outgoing channels). Pre-equilibrium was calculated within the exciton model Griffin (1966), as based on the solution of the master equation Cline and Blann (1971) in the form proposed by Cline Cline (1972) and Ribanský Ribanský et al. (1973) (using the Pcross code Herman et al. (2007, 2013)) with mean free path multiplier set to 1.5.
III Tests of the proposed model for scattering from statically deformed rare earth nuclei
In this work we present the results of integral and differential cross sections for 158,160Gd, 165Ho, and 182,184,186W obtained by our model, following the preliminary results shown in Refs. Nobre et al. (2014b); Herman et al. (2014). The reason for choosing the three elements (Gd, Ho, W) for the testing of our model is that they approximately span the statically deformed part of the rare-earth region, and there are suitable experimental data available for comparison with calculations. The values for deformation parameters that were adopted for the different isotopes are shown in Table 1, as well as the radius correction used, calculated from Eq. (2). In addition to the values extracted from analyses of neutron scattering experiments, we also show the values from the compilation of Raman et al. Raman et al. (2001) based on electromagnetic B(E2) data for even-even nuclei. The values obtained from scattering experiments are systematically smaller than those from the Raman et al. compilation, and we have found that they are better in reproducing the magnitudes of inelastic excitations. However, in cases where an independent determination of from scattering is not available, the values Raman compilation may be useful if appropriately scaled. Systematics, such as the ones from Refs. Chamon et al. (2004); Nobre et al. (2007), may be useful to retrieve values in cases where experimental data are not available. In some cases, particularly at low energies ( MeV), the accuracy of the calculations is strongly dependent on the accuracy of the adopted deformation parameters.
| Nuclide | ||||
|---|---|---|---|---|
| 155Gd | 0.995 | 0.25 Bauge et al. (2000) | +0.07 Bauge et al. (2000) | |
| 156Gd | 0.995 | 0.25 Bauge et al. (2000) | +0.06 Bauge et al. (2000) | 0.3378(18) Raman et al. (2001) |
| 157Gd | 0.994 | 0.26 Bauge et al. (2000) | +0.05 Bauge et al. (2000) | |
| 158Gd | 0.994 | 0.27 Bauge et al. (2000) | +0.04 Bauge et al. (2000) | 0.3484(17) Raman et al. (2001) |
| 159Gd | 0.994 | 0.28 Bauge et al. (2000) | +0.03 Bauge et al. (2000) | |
| 160Gd | 0.993 | 0.29111Values obtained by linearly extrapolating the deformation parameters of the lighter Gd isotopes. | +0.02111Values obtained by linearly extrapolating the deformation parameters of the lighter Gd isotopes. | 0.353 Raman et al. (2001) |
| 165Ho | 0.993 | 0.300 Smith (2001) | -0.020 Smith (2001) | |
| 182W | 0.996 | 0.223 Guenther et al. (1982); Delaroche et al. (1981); Annand and Finlay (1985) | -0.055 Annand and Finlay (1985) | 0.2508(24) Raman et al. (2001) |
| 184W | 0.996 | 0.209 Guenther et al. (1982); Delaroche et al. (1981); Annand and Finlay (1985) | -0.056 Guenther et al. (1982); Delaroche et al. (1981); Annand and Finlay (1985) | 0.2362(41) Raman et al. (2001) |
| 186W | 0.996 | 0.203 Guenther et al. (1982); Delaroche et al. (1981) | -0.057 Guenther et al. (1982); Delaroche et al. (1981) | 0.2257(39) Raman et al. (2001) |
III.1 Integral cross sections
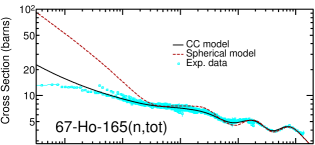
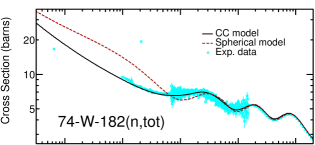
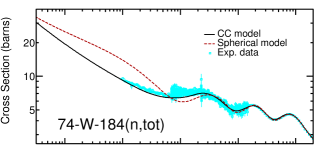
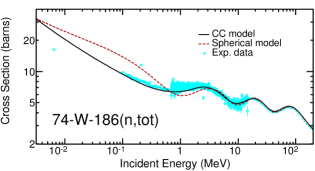
As a straightforward test of our model we calculated the total cross sections for the reaction of neutrons scattered by the nuclei presented in Table 1. To illustrate our results we present in Fig. 1 the total cross sections for 165Ho and 182,184,186W. We can immediately see that, while the spherical model poorly describes the measured shape of total cross sections, particularly overestimating the lower-energy region (for some rare-earth nuclei this difference can be of almost an order of magnitude Nobre et al. (2014a)), our coupled-channel model based on the approximate validity of the adiabatic limit yields very good agreement, from lower- to higher-energy regions. Integral cross sections are presented only up to 200 MeV. This is due to the fact that the global spherical Koning-Delaroche potential was fitted to data at incident energies below 200 MeV, thus only being reliable in this region.
III.2 Angular distributions
To better assess the quality and effectiveness of our coupled-channel model we compared its predictions to a variety of experimental angular distribution data. Such differential data are typically more sensitive to details of the optical potential and the deformations than the integral cross sections.
III.2.1 Gadolinium isotopes
We compare our calculations with two sets of angular distributions, those measured by Bauge et al. Bauge et al. (2000) and by Smith et al. Smith (2004). In the former case, it was possible to separate the differential cross sections of the elastic and first two inelastic channels for the two heavier stable isotopes, for two different incident energies; while in the latter one measurements were presented at several incident energies for natural Gadolinium, without being able to resolve the inelastic contributions in most cases.
In Fig. 2 we compare the predictions of our model for the elastic and inelastic angular distributions for 158Gd (Fig. 2(a)) and 160Gd (Fig. 2(b)) with the experimental data measured by Bauge et al. Bauge et al. (2000). The elastic differential cross sections are presented in the top panels, while angular distributions for the first 2+ and 4+ states are shown in the middle and bottom panels, respectively. These states have excitation energies () of =79.5 keV and =261.5 keV for 158Gd and keV and keV in the case of 158Gd. It can be clearly seen in Fig. 2 that our model succeeds in reproducing very well the observed elastic differential cross section (upper panel) for both Gadolinium isotopes studied. Regarding the predictions of our coupled-channel model for the angular distributions of the first two excited states, as shown in Fig. 2 (middle and bottom panels), even though the agreement with experimental data is not as good as in the case of elastic scattering, they still describe reasonably well the measured data, in particular their shape.


Smith et al. provides, in Ref. Smith (2004), angular distribution data for natural (or elemental) Gadolinium (NatGd) for neutron incident energies () ranging from 0.334 MeV up to 9.99 MeV. For the lower values of incident energy ( 1 MeV) the elastic channel is completely resolved while the data sets with higher incident energies (4.51 MeV 9.99 MeV) do not have any separation between elastic and inelastic contributions from members of the ground-state band. Datasets with incident energies around 1 MeV (1.080 MeV 1.432 MeV), did have inelastic contributions but it was not clear from Ref. Smith (2004) which channels were not resolved from the elastic one. For this reason, we decided not to present comparisons with these data sets. To obtain theoretical predictions for NatGd we proportionally combined the results of calculations for 155Gd (14.80%), 156Gd (20.47%), 157Gd (15.65%), 158Gd (24.84%), and 160Gd (21.86%), according to their contribution to the natural occurence of the element, as indicated in parentheses. 152Gd (0.20%) and 154Gd (2.18%) were ignored due to their small contribution (less than 3%) and normalization was done accordingly.
Fig. 3 shows the predictions of our model for the elastic angular distribution of NatGd which are in excellent agreement with the observed data. Very small discrepancies are more apparent only for the highest incident energy (=0.919), probably because those data are beginning to incorporate some inelastic contributions.
We present in Fig. 4 the results of our model for the summed differential cross sections of the elastic channel with the contributions from the first four excited states. That means the first 2+, 4+, 6+ and 8+ in the case of 156Gd, 158Gd and 160Gd. For such even-even nuclei the most significant inelastic contributions come from the 2+ and 4+ while the higher members of the ground state (g. s.) band make successively smaller contributions. For 155Gd (which has a 1/2- g. s. state) we added the contributions from the first 3/2-, 5/2-, 7/2- and 9/2- states, while in the case of 157Gd (3/2- g. s.) we summed up the differential cross sections from the 5/2-, 7/2-, 9/2- and 11/2- inelastic channels. For clarification purposes, it is important to state that, even though we considered only the contributions from the first four inelastic channels in Fig. 4, we obviously performed calculations coupling to a much larger number of inelastic states of the g. s. band in order to absolutely ensure convergence regarding the number of channels coupled. The comparisons presented in Fig. 4 show that we successfully predict the observed shape of such summed differential cross sections, even though our calculations tend to slightly underestimate the angular distributions, especially for lower incident energies. Since we can assume, from Figs. 2 and 3 that we obtain an excellent description of the elastic channel, this small discrepancy may be due to the need of fine tuning of the calculation of the inelastic channels associated with quadrupole and hexadecupole deformations. We did not find that altering the strength of the imaginary potential within reasonable limits (15%) significantly improved the overall agreement. Given that there has been no adjustment of the KD optical parameters (other that the radius change to impose volume conservation), nor of the deformations, the results are satisfactory.

III.2.2 Holmium
The ground state of 165Ho has spin and parity 7/2-, and consequently a ground-state band level sequence 7/2-, 9/2-, 11/2-, 13/2-, . Coupled-channel calculations were performed coupling all states of the g.s. band up to 23/2- to ensure convergence. Due to the experimental difficulties of resolving the elastic channel from the inelastic ones in neutron-induced reactions on 165Ho, experimental data sets for higher incident energies (above 1 MeV) usually contain inelastic contributions.
Fig. 5 shows the experimental data measured by Wagner et al. Wagner et al. (1965) for the incident energy of 0.350 MeV, which correspond to pure elastic differential cross sections. As can be seen in Figure 5, the predictions of our model for the elastic channel (black curve) describe the observed angular distributions very well.

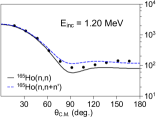
We also assessed the agreement of elastic and elastic plus inelastic angular distributions calculated from our model with early experimental measurements from Meadows et al. Meadows et al. (1971), done for incident energies between 0.3 to 1.5 MeV. Ref. Meadows et al. (1971) presents its results in the form of Legendre expansions of the angular distributions, while Ref. Smith (2001) reconstructs the corresponding differential cross sections. In Fig. 6 we present such comparisons for selected values of incident energy, namely, , 0.79, 0.93 and 1.20 MeV. Again, as can be seen in Fig. 6, we obtain a very good description of the experimental data with our coupled-channel model. In the case of MeV (lower right-hand panel of Fig. 6), for which the experimental data contain inelastic contributions Smith (2001), we also show the resulting calculation of summing up elastic and inelastic angular distributions.


The accuracy of our model predictions was also tested by comparing with the more recent experimental results of Ref. Smith (2001). In that work, new measurements of angular distributions with unresolved contributions from elastic and inelastic channels for 165Ho are presented for incident energies ranging from 4.51 to 9.99 MeV. In Fig. 7 we present such comparisons for the lowest (top panel) and highest (bottom panel) incident energies of the set. We present in Fig. 7, for comparison purposes, the calculated angular distributions for only the elastic channel as red-dashed curves, while the solid-black curves correspond to calculations with the inelastic contributions added up to the elastic one. In this case, it is seen that, even after adding the contributions from the inelastic states, our predictions consistently fall slightly below the data points. As an indication that our model is reproducing very well the measured shape of angular distributions, we also plot in Fig. 7 the same elastic-plus-inelastic calculations, but multiplied by a factor of 1.5 blue-dotted curves. This leads to a nearly perfect agreement with experimental data.
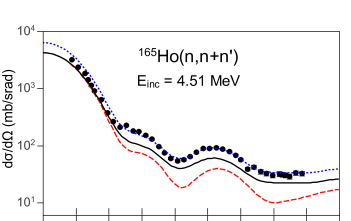
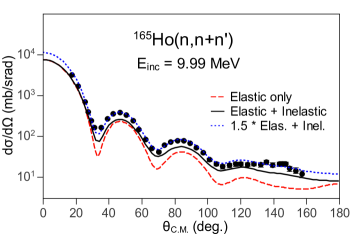
Fig. 8 presents the predictions of our model when attempting to describe the angular distribution data for 165Ho, at the neutron incident energy of 11 MeV, as measured by Ferrer et al. Ferrer et al. (1977). An examination of the experimental conditions of Ref. Ferrer et al. (1977) indicates that in that experiment it was not possible to separate the elastic channel from the inelastic ones. Therefore, the data points in Fig. 8 should contain inelastic contributions. For this reason, we plot in Fig. 8 the differential cross sections corresponding to the sum of the elastic and inelastic contributions, as predicted by our coupled-channel model. For the following discussion we also plot, as the red-dashed curve, the same calculation but with the imaginary components (both volume and surface) of the KD optical potential reduced by 10%.
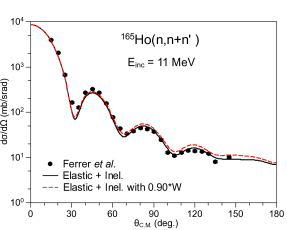
The fact that our model describes very well the observed data from the lower and higher ends of the incident-energy spectrum, as seen in Figs. 5 and 8, respectively, and also data in between (Fig. 6), except for one particular data set for which the agreement is not as good (Fig. 7) suggests that there might be an inconsistency between the experiments from Refs. Wagner et al. (1965); Ferrer et al. (1977); Meadows et al. (1971) and the one from Ref. Smith (2001). The most striking inconsistency is that between the 10 MeV results of Fig. 7 and the 11 MeV results of Fig. 8, since the optical potential is expected to vary slowly and smoothly over this small interval. We also note that a 10% reduction in the imaginary potential strength, whose effect is shown at 11 MeV in Fig. 8, would be insufficient to bring the 10-MeV calculations and experiment of Fig. 7 into agreement. At present the source of these discrepancies is not understood.
Considering the simplicity of the model assumptions and the lack of fitted parameters, we regard the agreement of the predictions of our model with experimental data as satisfactory.
III.2.3 Tungsten isotopes
We analyzed the accuracy of our model when describing the observed angular distributions of neutrons scattered by the three most abundant tungsten isotopes: 182W, 184W, and 186W. For this we compared our calculations with experimental data available in the literature. Guenther et al. Guenther et al. (1982) have measured angular distributions for the elastic and inelastic (associated with the first 2+ and 4+ excited states) channels for several incident neutron energies. A measurement of elastic and inelastic angular distributions at =3.4 MeV was made by Delaroche et al. Delaroche et al. (1981), while Ref. Annand and Finlay (1985) presents the results from Annand and Finlay for differential cross section data for 182W and 184W at =4.87 and 6.0 MeV. The latter experiment also resolved the angular distribution corresponding to the first 6+ states of the two lighter even-even isotopes.
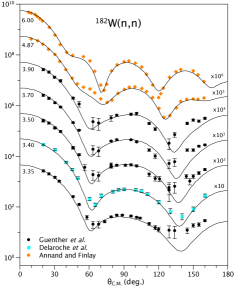
Fig. 9 shows the predictions of our model for the elastic angular distributions in the case of 182W when compared to observed experimental data. Apart from some discrepancies observed at the backward angles for some incident energies in the region MeV, it can be seen in Fig. 9 that excellent agreement is obtained.

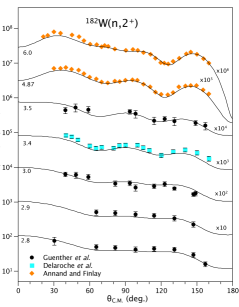
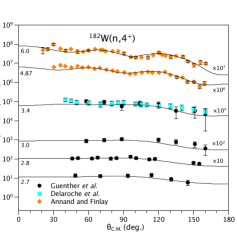
In Fig. 10, we present the results of calculations using our coupled-channel model for the inelastic differential cross sections of 182W for the 2+ (Fig. 10(a)), and 4+ (Fig. 10(b)) excited states, which have excitation energies of 100.1 keV, and 329.4 keV, respectively. The agreement with experimental data is very good, for both cases of 2+ and 4+ excitations.


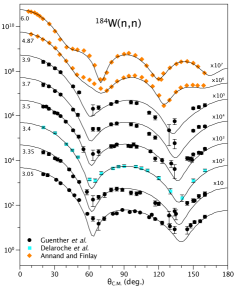
We present in Fig. 11 the results obtained for 184W elastic angular distributions. The agreement in this case is even better than the one obtained for 182W, shown in Fig. 9, considering that the discrepancies at backward angles in the region are much smaller for 184W than for 182W.

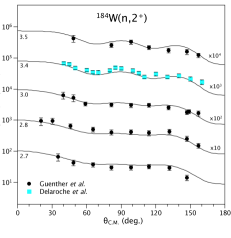
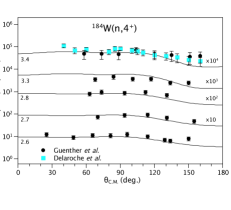
The results for inelastic angular distributions of 184W are presented in Fig. 12. Fig. 12(a) shows the differential cross sections corresponding to the first 2+ state ( keV), while Fig. 12(b) presents results for the first 4+ state ( keV) of 184W. Similarly to the case of 182W shown in Fig. 10, we achieve very good agreement between experimental differential cross-section data with the ones calculated via our model for 184W. Larger discrepancies are observed only for a particular incident energy, MeV, for both 2+ (Fig. 12(a)) and 4+ (Fig. 12(b)) cross sections, where we underestimate the experimental data.


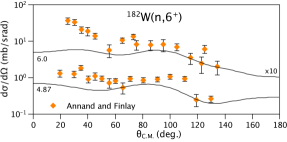
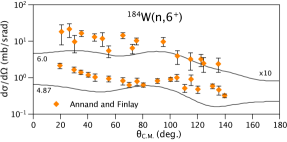
In Fig. 13, we present the results of calculations within our coupled-channel model for the inelastic differential cross sections for the 6+ state for both 182W (Fig. 13(a)) and 184W (Fig. 13(b)) neutron-induced reactions. The excitation energies of such states are = 680.5 keV and 748.3 keV, respectively. In the case of the 6+ angular distributions, the agreement with experimental data is not as good as in the cases of the 2+ and 4+ channels (Figs. 10 and 12). This is not surprising since our calculations do not include a direct excitation of the 6+ state via off-diagonal elements connecting the elastic channel and the 6+ state in the coupling potential.
IV Summary and conclusions
In this paper we presented extensive results for a coupled-channel model designed to accurately predict differential and integral cross sections of neutron-induced reactions on statically-deformed nuclei, such as those of the rare-earth region. The method consists in statically deforming a spherical optical potential that well describes non-deformed nuclei in the neighboring regions, and then carrying out coupled-channels calculations using a sufficient number of the rotational excited states of the ground state band to achieve convergence. In this particular work we adopted the spherical global Koning-Delaroche Koning and Delaroche (2003) optical model potential (OMP). We leave the OMP unmodified, except for a small correction in the radii to ensure nuclear volume conservation. The idea behind this model is that, due to the low-lying values of excitation energy and consequent near validity of the adiabatic approximation, we can explicitly treat the degrees of freedom associated with strong deformation while all other degrees of freedom are accounted for by the spherical OMP with its parameters unmodified.
We applied our model to nuclear reactions having 158,160,NatGd, 165Ho, and 182,184,186W as targets. Comparison of our calculations with experimental data indicated remarkable agreement, for both total cross sections and angular distributions. Even though the agreement could be further improved by fitting OMP parameters for the individual nuclei, the importance of the present model lies in the achievement of such results without any parameter adjustment, using as input only the potential and the experimental quadrupole and hexadecupole deformation parameters. Therefore, the conclusions presented here could reliably be extrapolated to other statically-deformed rare-earth nuclei for which little or no experimental data is available.
V Acknowledgments
The work at Brookhaven National Laboratory was sponsored by the Office of Nuclear Physics, Office of Science of the U.S. Department of Energy under Contract No. DE-AC02-98CH10886 with Brookhaven Science Associates, LLC.
References
- Satchler and Love (1979) G. Satchler and W. Love, Physics Reports 55, 183 (1979).
- Koning and Delaroche (2003) A. Koning and J. Delaroche, Nuclear Physics A 713, 231 (2003).
- Dietrich et al. (2012) F. S. Dietrich, I. J. Thompson, and T. Kawano, Phys. Rev. C 85, 044611 (2012).
- Dietrich (2013) F. S. Dietrich, private communication (2013).
- Kunieda et al. (2007) S. Kunieda, S. Chiba, K. Shibata, A. Ichihara, and E. S. Sukhovitskiĩ, Journal of Nuclear Science and Technology 44, 838 (2007).
- Jeukenne et al. (1974) J.-P. Jeukenne, A. Lejeune, and C. Mahaux, Phys. Rev. C 10, 1391 (1974).
- Jeukenne et al. (1977a) J.-P. Jeukenne, A. Lejeune, and C. Mahaux, Phys. Rev. C 15, 10 (1977a).
- Jeukenne et al. (1977b) J.-P. Jeukenne, A. Lejeune, and C. Mahaux, Phys. Rev. C 16, 80 (1977b).
- Bauge et al. (2000) E. Bauge, J. P. Delaroche, M. Girod, G. Haouat, J. Lachkar, Y. Patin, J. Sigaud, and J. Chardine, Phys. Rev. C 61, 034306 (2000).
- Nobre et al. (2010) G. P. A. Nobre, F. S. Dietrich, J. E. Escher, I. J. Thompson, M. Dupuis, J. Terasaki, and J. Engel, Phys. Rev. Lett. 105, 202502 (2010).
- Nobre et al. (2011) G. P. A. Nobre, F. S. Dietrich, J. E. Escher, I. J. Thompson, M. Dupuis, J. Terasaki, and J. Engel, Phys. Rev. C 84, 064609 (2011).
- Krappe (1976) H. Krappe, Annals of Physics 99, 142 (1976).
- Herman et al. (2007) M. Herman, R. Capote, B. Carlson, P. Obložinský, M. Sin, A. Trkov, H. Wienke, and V. Zerkin, Nucl. Data Sheets 108, 2655 (2007).
- Herman et al. (2013) M. Herman, R. Capote, M. Sin, A. Trkov, B. V. Carlson, C. M. M. P Obložinský, H. Wienke, S. Hoblit, Y.-S. Cho, G. P. A. Nobre, V. Plujko, and V. Zerkin, EMPIRE-3.2 Malta Modular system for nuclear reaction calculations, Tech. Rep. INDC(NDS)-0642, BNL-101378-2013 (2013).
- Raynal (1970) J. Raynal, Optical Model and Coupled-Cannel Calculations in Nuclear Physics, Tech. Rep. SMR-9/8 (IAEA, 1970).
- Raynal (1972) J. Raynal, in Computing as a language of physics. ICTP International Seminar Course (IAEA, ICTP, Trieste, Italy, 1972) p. 281.
- Nobre et al. (2014a) G. P. A. Nobre, A. Palumbo, D. Brown, M. Herman, S. Hoblit, and F. S. Dietrich, Nuclear Data Sheets 118, 266 (2014a).
- Nobre et al. (2014b) G. P. A. Nobre, F. S. Dietrich, M. Herman, A. Palumbo, S. Hoblit, and D. Brown, AIP Conference Proceedings 1625, 45 (2014b).
- Herman et al. (2014) M. Herman, G. Nobre, A. Palumbo, F. Dietrich, D. Brown, and S. Hoblit, EPJ Web of Conferences 69, 00007 (2014).
- Raman et al. (2001) S. Raman, C. W. Nestor, Jr., and P. Tikkanen, Atomic Data and Nuclear Data Tables 78, 1 (2001).
- Bang and Vaagen (1980) J. Bang and J. Vaagen, Zeitschrift für Physik A Atoms and Nuclei 297, 223 (1980).
- D’Arrigo et al. (1994) A. D’Arrigo, G. Giardina, M. Herman, A. V. Ignatyuk, and A. Taccone, J. Phys. G20, 365 (1994).
- D’Arrigo et al. (1992) A. D’Arrigo, G. Giardina, M. Herman, and A. Taccone, Phys. Rev. C 46, 1437 (1992).
- Plujko (2000a) V. A. Plujko, Acta Phys. Pol. B 31, 435 (2000a).
- Plujko (2000b) V. A. Plujko, in 9th International Conference for Nuclear Reaction Mechanisms, Vol. Suppl. 115, edited by E. Gadioli (Universita degli Studi di Milano, Varenna, Italy, 2000) p. 113.
- Plujko et al. (2001) V. A. Plujko, S. N. Ezhov, and M. O. Kavatsyuk (Atomic Energy Society of Japan, Tsukuba, Japan, 2001) p. 811.
- Hofmann et al. (1975) H. M. Hofmann, J. Richert, J. W. Tepel, and H. A. Weidenmüller, Ann. Phys. 90, 403 (1975).
- Hofmann et al. (1980) H. M. Hofmann, T. Mertelmeier, M. Herman, and J. W. Tepel, Z. Physik A 297, 153 (1980).
- Griffin (1966) J. J. Griffin, Phys. Rev. Lett. 17, 478 (1966).
- Cline and Blann (1971) C. K. Cline and M. Blann, Nucl. Phys. A 172, 225 (1971).
- Cline (1972) C. K. Cline, Nucl. Phys. A193, 417 (1972).
- Ribanský et al. (1973) I. Ribanský, P. Obložinský, and E. Bětak, Nucl. Phys. A205, 545 (1973).
- Chamon et al. (2004) L. C. Chamon, G. P. A. Nobre, D. Pereira, E. S. Rossi, C. P. Silva, L. R. Gasques, and B. V. Carlson, Phys. Rev. C 70, 014604 (2004).
- Nobre et al. (2007) G. P. A. Nobre, C. P. Silva, L. C. Chamon, and B. V. Carlson, Phys. Rev. C 76, 024605 (2007).
- Smith (2001) A. B. Smith, Annals of Nuclear Energy 28, 1745 (2001).
- Guenther et al. (1982) P. T. Guenther, A. B. Smith, and J. F. Whalen, Phys. Rev. C 26, 2433 (1982).
- Delaroche et al. (1981) J. P. Delaroche, G. Haouat, J. Lachkar, Y. Patin, J. Sigaud, and J. Chardine, Phys. Rev. C 23, 136 (1981).
- Annand and Finlay (1985) J. Annand and R. Finlay, Nuclear Physics A 442, 234 (1985).
- Otuka et al. (2014) N. Otuka, E. Dupont, V. Semkova, B. Pritychenko, A. Blokhin, M. Aikawa, S. Babykina, M. Bossant, G. Chen, S. Dunaeva, R. Forrest, T. Fukahori, N. Furutachi, S. Ganesan, Z. Ge, O. Gritzay, M. Herman, S. Hlavač, K. Katō, B. Lalremruata, Y. Lee, A. Makinaga, K. Matsumoto, M. Mikhaylyukova, G. Pikulina, V. Pronyaev, A. Saxena, O. Schwerer, S. Simakov, N. Soppera, R. Suzuki, S. Takács, X. Tao, S. Taova, F. Tárkányi, V. V. Varlamov, J. Wang, S. C. Yang, V. Zerkin, and Y. Zhuang, Nuclear Data Sheets 120, 272 (2014).
- Smith (2004) A. B. Smith, Annals of Nuclear Energy 31, 1813 (2004).
- Wagner et al. (1965) R. Wagner, P. D. Miller, T. Tamura, and H. Marshak, Phys. Rev. 139, B29 (1965).
- Meadows et al. (1971) J. Meadows, A. Smith, J. Whalen, and T. Beynon, Zeitschrift f r Physik 243, 171 (1971).
- Ferrer et al. (1977) J. Ferrer, J. Carlson, and J. Rapaport, Nuclear Physics A 275, 325 (1977).