An Optically Obscured AGN in a Low Mass, Irregular Dwarf Galaxy: A Multi-Wavelength Analysis of J1329+3234
Abstract
Supermassive black holes are found ubiquitously in large, bulge-dominated galaxies throughout the local Universe, yet little is known about their presence and properties in bulgeless and low mass galaxies. This is a significant deficiency, since the mass distribution and occupation fraction of non-stellar black holes provide important observational constraints on supermassive black hole seed formation theories and many dwarf galaxies have not undergone major mergers that would erase information on their original black hole population. Using data from the Wide-field Infrared Survey Explorer, we discovered hundreds of bulgeless and dwarf galaxies that display mid-infrared signatures of extremely hot dust highly suggestive of powerful accreting massive black holes, despite having no signatures of black hole activity at optical wavelengths. Here we report, in our first follow-up X-ray investigation of this population, that the irregular dwarf galaxy J132932.41+323417.0 () contains a hard, unresolved X-ray source detected by XMM-Newton with luminosity erg s-1, over two orders of magnitude greater than that expected from star formation, strongly suggestive of the presence of an accreting massive black hole. While enhanced X-ray emission and hot dust can be produced in extremely low metallicity environments, J132932.41+323417.0 is not extremely metal poor ( 40% solar). With a stellar mass of , this galaxy is similar in mass to the Small Magellanic Cloud, and is one of the lowest mass galaxies with evidence for a massive nuclear black hole currently known.
Subject headings:
Galaxies: active — Galaxies: dwarf — X-ray: Galaxies — Infrared: Galaxies — Black hole physics1. Introduction
It is well known that supermassive black holes (SMBHs) are ubiquitous in massive bulge dominated galaxies. In contrast, for decades, less than a handful of SMBHs were known in either low mass, or bulgeless galaxies (e.g., Filippenko & Ho, 2003; Barth et al., 2004). Identifying such a population and constraining their occupation fraction is crucial to our understanding of the origins of SMBHs and the secular pathways for their growth (e.g., Volonteri, 2010; van Wassenhove et al., 2010) . In recent years, there have been a number of discoveries of active SMBHs in the low bulge mass regime (e.g., Dewangan et al., 2005; Satyapal et al., 2007, 2008, 2009; Shields et al., 2008; Ghosh et al., 2008; Izotov & Thuan, 2008; Desroches & Ho, 2009; Gliozzi et al., 2009; McAlpine et al., 2011; Reines et al., 2011; Reines & Deller, 2012; Secrest et al., 2012, 2013; Dong et al., 2012; Araya Salvo et al., 2012; Reines et al., 2013; Coelho et al., 2013; Bizzocchi et al., 2014; Satyapal et al., 2014; Reines et al., 2014; Maksym et al., 2014). While the list of active galactic nuclei (AGNs) in low mass or bulgeless galaxies may be steadily growing, optically identified AGNs likely represent a small fraction of the total number of AGNs in this population. AGNs identified by their optical spectra are preferentially found in massive bulge-dominated hosts, with the fraction of galaxies with optical signs of accretion dropping dramatically at stellar masses (e.g. Kauffmann et al., 2003). For example, Reines et al. (2013) find that out of 25,974 low-mass (9.5) galaxies with high signal-to-noise optical spectra, only 151 show any optical signatures of AGN activity (0.6%) and only 35 (0.1%) are unambiguously identified as AGNs on the BPT diagram. While a combination of obscuration, energetically weak AGNs, and contamination by star formation all limit optical AGN selection in late-type galaxies, optical AGN selection in lower mass galaxies may also be affected by their lower metallicities, reducing their [N II]/H emission line ratios and shifting AGN-hosting galaxies into the HII region of the BPT diagram (see Izotov & Thuan, 2008, and references therein), and even unobscured AGNs may nonetheless fail to be discerned optically (e.g., Pons & Watson, 2014). The use of optical AGN diagnostics in low mass galaxies is further complicated in practice by the non-uniform nature of SDSS spectroscopic targeting, which preferentially targets more luminous galaxies (i.e., not dwarfs; see also the discussion in Greene & Ho, 2007).
Motivated by the possibility that optical studies miss a significant fraction of AGNs in bulgeless and low mass galaxies, we used the the all-sky Wide-field Infrared Survey Explorer (WISE) to search for optically hidden AGNs in a large sample of bulgeless galaxies (Satyapal et al., 2014). Remarkably, we discovered several hundred optically normal bulgeless galaxies, many with low stellar masses, that display extreme red mid-infrared colors ([3.4]-[4.6]; hereafter -) suggestive of dominant AGNs that may outnumber optically-identified AGNs by as much as a factor of . Astonishingly, the vast majority of these galaxies have no signs of accretion at optical wavelengths. Moreover, based on their red WISE color, not only do these galaxies possibly harbor AGNs, but the AGNs must dominate the mid-IR luminosities of their galaxies, since in typical low redshift sources, it is very difficult to replicate the observed WISE colors from star formation alone (e.g., Assef et al., 2013).
While the red mid-IR colors discovered by WISE are highly suggestive of accretion activity, there are cases when red - colors indicate hot dust due to extreme star formation, especially when associated with red - ([4.6]-[12]) colors. Indeed, there have been a handful of low metallicity blue compact dwarfs (BCDs) with extreme mid-infrared colors (e.g., Griffith et al., 2011; Izotov et al., 2014) raising the possibility that there is a similar origin for such mid-IR colors in bulgeless galaxies. It is impossible to confirm the putative AGN in this population of galaxies with the infrared observations alone. Follow up X-ray observations are required, since the detection of a hard, luminous nuclear X-ray source coincident with the nucleus provides unambiguous confirmation of the existence of accreting black holes.
In this paper, we present the first follow-up X-ray observations obtained with XMM-Newton of the bulgeless galaxy SDSS J132932.41+323417.0 (SDSS “objectID”=1237665126939754596; hereafter J1329+3234). J1329+3234 is a blue, irregular dwarf galaxy (=8.3) with a metallicity of =0.4, at a redshift of =0.0156 that hosts a bright, unresolved mid-IR source with WISE colors suggestive of the presence of an AGN (-=0.73 mag.; -=2.59 mag.). Based on the optical emission line ratios from the SDSS spectrum, there is no evidence for an AGN ( = 0.25, = ).
We adopt a standard CDM cosmology with km s-1 Mpc-1, , and .
2. Observations and Data Reduction
2.1. XMM Observations
We obtained X-ray observations of J1329+3234 on 2013 June 12, as part of a broader XMM-Newton program searching for AGN X-ray signatures in bulgeless galaxies (Secrest et al. 2015, in prep.). We acquired three full-frame event files with the EPIC pn, MOS1, and MOS2 CCDs, in an effective energy range of 0.3-10 keV, with effective exposure times of 30.0 ks for pn and 34.8 ks for the two MOS detectors. We reduced the data with the XMM-Newton Science Analysis Software (SAS), version 13.0.0, using the most up to date calibration files. We checked our reduced event files for hard X-ray background flares ( keV), but no significant flaring occurred during the exposure.
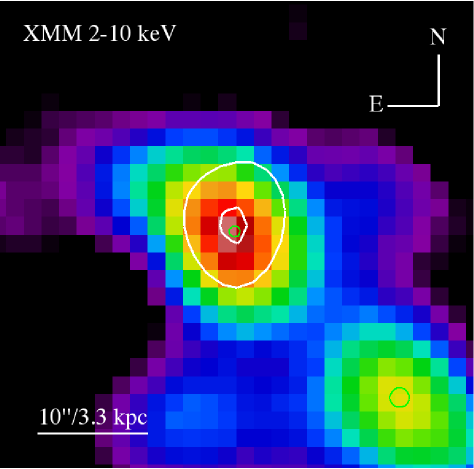
Of the 135 EPIC sources detected in the 30 field of view of our observation, we found one source coincident with J1329+3234 (hereafter S1) and one source to the SW of J1329+3234 (hereafter S2) on-axis with an angular resolution of 6′′. In Figure 1, we show the 2-10 keV pn image of J1329+3234. Neither source shows any evidence of being extended, as confirmed by the automated XMM-Newton pipeline.
2.2. Large Binocular Telescope Observations
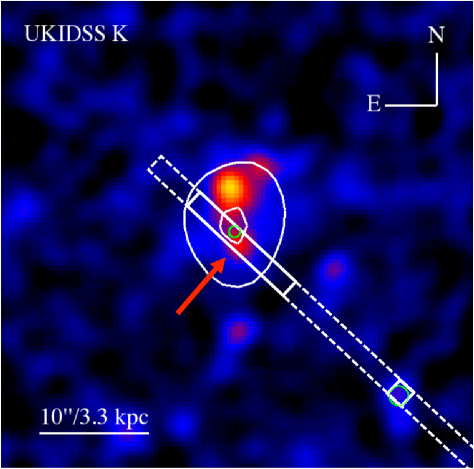
Since there are two X-ray sources detected in our XMM-Newton observations, we obtained an optical spectrum of our target that includes S1 and S2 on UT Feb 17, 2014 using the Multi-Object Double Spectrograph 1 (MODS-1; Pogge et al., 2006, 2010) mounted on one of the two 11.8 meter mirrors of the Large Binocular Telescope (LBT). MODS-1 is a low-medium resolution two channel (blue & red) spectrograph mounted on the f/15 Gregorian focus of the SX (left) mirror of the LBT. In two channel mode MODS-1 can simultaneously observe the wavelength range 0.3-1.0µm. The observations were obtained using only the red arm of MODS-1, which covers 0.49-1.00µm. The spatial scale of the red arm is pixel-1. A wide segmented longslit mask was used. The mask contains 5 longslit segments, each 60′′ in length. A single segment was sufficient to span S1 and S2. The observations were obtained under thin clouds and in near full moon conditions, for a total of 2400 seconds (2x1200 second exposures). The spectrophotometric standard Feige 67 was observed using the same instrumental setup as our science observations. Slitless pixel flats were obtained to correct for the detector response. Ar, Xe, Kr, Ne and Hg lamps were observed for wavelength calibration and to measure the spectral resolution. The slit was centered on S2 with RA=13h29m31s.269, Decl.=+32∘33′59′′.91, and a position angle of 227∘. Note that while the slit covers much of J1329+3234, we did not center it on J1329+3234, as we did not want to our optical spectrum to overlap with the spectrum from SDSS. Instead, we oriented the slit such that it would cover the K-band concentration possibly associated with S1 in Figure 2 (see §3.1.1).
The data were first reduced using Version 0.3 of the modsCCDRed collection of Python scripts. These perform basic 2D reduction including: bias subtraction, removing the overscan regions, constructing flat fields from the slitless pixel flats, fixing bad columns and flipping the red arm data so that wavelength increases from left to right along the x-axis. Further processing was performed using customized iraf scripts developed by B. R. Cosmic rays were removed using the task CRUTIL. Two dimensional spectra were extracted in strip mode for the central longslit segment using the task APALL. MODS-1 spectra are tilted along both the spectral (x-axis) and spatial (x-axis) dimensions. The spectra for both exposures were simultaneously corrected in both axes using the arc lines and the iraf tasks ID, REID, FITC, and TRANSFORM. MODS-1 data are very sensitive to the polynomial order used to wavelength calibrate the data. A 4th order Legendre polynomial produces the smallest residuals and avoids introducing low-order noise into the 2D spectra. From the arc lamps, the dispersion was measured to be 0.84 Å pixel-1. Measurements of the arc lines yielded a final spectral resolution of 6.77Å for the slitwidth. This corresponds to 740-1380 over the observed wavelength range. Once the 2D spectra were rectified and wavelength calibrated, the background was subtracted in each exposure by fitting a 3rd order Chebyshev polynomial to the columns (spatial axis) using the iraf task BACKGROUND. The two exposures were then combined and flux calibrated using the spectro-photometric standard Feige 67. This step also removes the instrumental signature.
Finally, the data were corrected for atmospheric extinction and galactic reddening assuming and a value of (Schlafly & Finkbeiner, 2011). A 1D spectra of S1 was extracted from the combined 2D rectified and background subtracted image in an aperture of width 100 pixels or to maximize signal-to-noise, using the task APALL. A 1D spectra of S2 was extracted in the same fashion, but using an aperture of width 10 pixels or . The 1D spectra were then flux calibrated (removing the instrumental response), corrected for atmospheric extinction, and corrected for galactic reddening using the same values as above.
2.3. Astrometry
The EPIC X-ray event files for J1329+3234 were not astrometrically corrected. This introduced a offset between the location of nearby X-ray sources (including S2) and their putative optical counterparts in the SDSS field. We manually inspected the XMM-Newton pipeline astrometric solution of the optical monitor -band image by blinking it with the SDSS image, and found it to be sufficient to apply to our X-ray event files. This astrometric solution applies an offset of RA= and Decl.=. The astrometry corrected EPIC data confirms that the position of S1 does coincide with the position of the red WISE source (Figure 1). The XMM-Newton pipeline formal astrometric uncertainties (the astrometric uncertainty after correction) is 0.47′′ and 0.51′′ for S1 and S2, respectively.
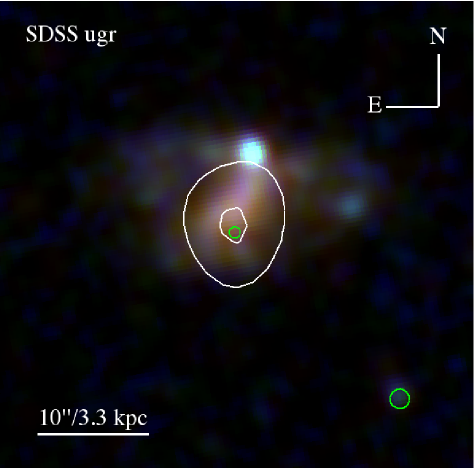
While J1329+3234 is not bright enough to have been detected by 2MASS, it was detected in the UKIDSS survey111www.ukidss.org/, enabling us to examine the near-infrared band (Figure 2). J1329+3234 in the band displays an irregular, clumpy structure, with no discernible photo center. Optically, J1329+3234 also presents an irregular structure, with no unambiguous photo center (Figure 3). The location of S2 is consistent with an optical concentration with no obvious association with J1329+3234, and S2 likely a background AGN (see §3.2.1). This optical concentration source does not appear in any QSO catalogs and does not appear to have been studied before in any way.
2.4. X-ray Analysis
We extracted X-ray spectra for both sources following standard procedures, and grouping the spectra by a minimum of 15 counts per channel for the statistic. Due to the projected proximity of the sources (), we extracted spectra using apertures that corresponded to the half-energy diameter of an on-axis point-source ( for pn) in order to minimize cross-contamination. We performed spectral analysis on the binned spectra using xspec version 12.7.0 (Arnaud, 1996) and using the online Chandra Colden222cxc.harvard.edu/toolkit/colden.jsp tool to find the Galactic neutral hydrogen column density for J1329+3234, which we account for in our spectral analysis as a fixed photo-electric absorption multiplicative component (wabs). We do not explicitly state the inclusion of this spectral model later in the paper, because it is included in all our X-ray spectral modeling, and has a value of cm-2. While we primarily focused our spectral analysis on the higher signal-to-noise pn data, we also performed simultaneous spectral fitting on the data from all three detectors by multiplying each spectrum by a separate constant that was free to vary, holding the values of the spectral parameters identical between spectra. This allowed inter-detector sensitivity variability to be accounted for without compromising the overall spectral fit. The value of this constant was generally close to unity. To derive fluxes and errors, we appended the cflux convolution model, holding the model normalization fixed. All errors in this work are .
3. Results
3.1. S1
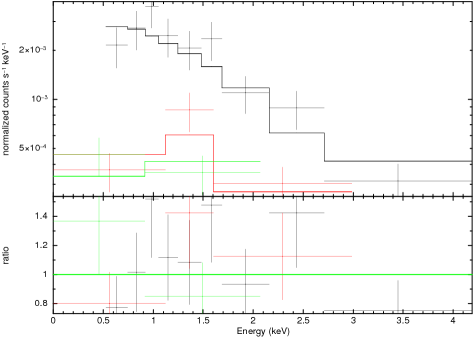
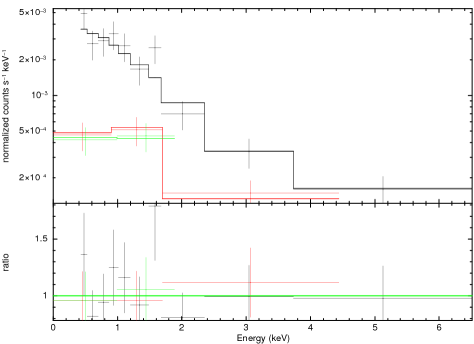
We fit the X-ray spectrum for S1 with a simple power-law spectrum, achieving a good fit (/degrees of freedom (d.o.f.) = 11/10=1.1) with . We achieve a comparable fit with the addition of an intrinsic absorber (zwabs, /d.o.f. = 8.6/9 = 0.96), which yields an intrinsic absorption of cm-2 and a power law index of , but we do not find the fit to be sensitive to this addition due to low counts (-test probability 30%; pn, MOS1, and MOS2 counts = , , and counts, respectively). In Figure 4, we show the best-fit spectrum for S1. We derive unabsorbed full and hard band X-ray fluxes of erg cm-2 s-1 and erg cm-2 s-1, translating to a full band luminosity of erg s-1 and a hard X-ray luminosity of erg s-1, similar to the hard X-ray luminosities found in LINERS and low-luminosity Seyferts (e.g., Terashima et al., 2002). We note that if we had used the model with the intrinsic absorber, then we would have X-ray fluxes of erg cm-2 s-1 and erg cm-2 s-1, almost identical to the simple power law model, and so the exact choice of model does not significantly affect our results.
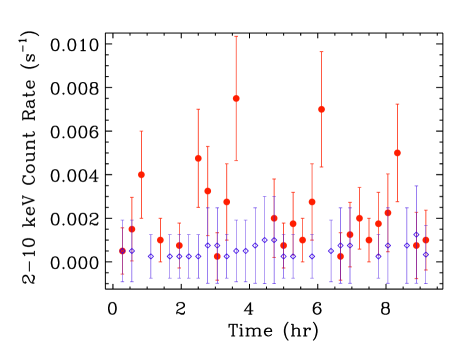
Given the vicinity of S2 to S1, we extracted the S1 light curves from a circular region with a radius of and the background light curve from a larger nearby region without X-ray sources. We extracted light curves in the soft (0.3-2 keV), hard (2-10 keV), and total (0.3-10 keV) energy bands, and tried different time bins (from 250s to 1000s) to investigate the presence of variability based on a test. Only the hard light curves shows evidence for variability irrespective of the time bin used. However, a closer look at the hard background-subtracted light curves reveals the presence of spurious negative values (they are about one order of magnitude smaller that the average count rate), which can be explained by statistical fluctuations of the background light curve combined with the low count rate of the source. Once these spurious data points are removed, only the 1000s light curve shows some suggestive evidence for variability. Specifically, using the “lcstats” routine from Xronos333https://heasarc.gsfc.nasa.gov/xanadu/xronos/xronos.html we got the following results: for the 2-10 keV light curve with 25 data points =34.7 with a corresponding probability of constancy =0.07; for the 0.3-10 keV light curve with 34 data points =33.9 and =0.42; whereas for the soft 0.3-2 keV light curve with 33 data points =35.8 and =0.29. We therefore conclude that only the hard light curve is not consistent with the hypothesis of constancy. In Figure 5, we show the 2-10 keV background-subtracted light curve (filled red circles) along with the background light curve (open diamonds, which does not show any significant variability: =16 for 25 degrees of freedom and =0.91) where the time bins are 1000s.
3.1.1 Near-IR Counterpart of S1
While there is no obvious optical counterpart for S1, the UKIDSS dataset reveals a possible counterpart in the near-IR. The source, marked with a red arrow in Figure 2, is unresolved (median seeing 444www.ukidss.org/sciencecase/proposal/proposal.wfcam.html), and corresponds to “sourceID”=433793068380 in the UKIDSSDR9PLUS database, at RA=13h29m32s.39, Decl.=+32∘3413′′.1. The near-IR , , and magnitudes for this source are , , and , respectively. The band magnitude was not measured successfully. This source possibly corresponds to SDSS “objectID”=1237665126939754597, which has a very faint band magnitude of , but this source’s photometry suffers from flux interpolation and deblending problems, so this magnitude value should be considered tentative.
3.1.2 Optical Spectrum of S1
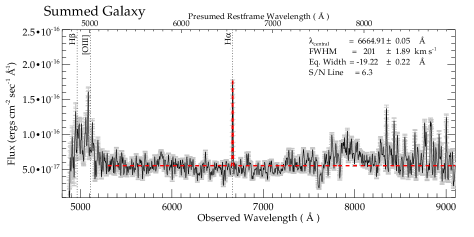
The position of the LBT slit overlapped with the position of the near-IR counterpart to S1 described above, as well as the position of S2. In Figure 6, we plot the 1D optical spectrum corresponding to the position of this near-IR counterpart. While we detect an H line at =6665.5Å (=0.0156), we do not detect any other lines at a significant level. The RMS for the H and [O III]5007Å lines is erg cm-2 s-1 and erg cm-2 s-1 for the [N II]6584Å line. The total H flux within the 12.3′′ aperture is = erg cm-2 s-1. The optical spectrum for this region therefore shows no signatures of an AGN, as optically-identified AGNs typically have [N II]/H line ratios between 0.6-1.2.
3.2. S2
We fit the X-ray spectrum for S2 using all three detectors, and found that the source can best be fit by a simple power law with (Figure 7), although the spectra are still slightly over-fit even with a simple power law (/d.o.f.=6.4/11=0.6). We derive unabsorbed full and hard band X-ray fluxes of [erg cm-2 s-1] and [erg cm-2 s-1], translating to full and hard X-ray luminosities of erg s-1 and erg s-1 given its redshift (See §3.2.1). We do not find evidence for variability in any energy band.
3.2.1 Optical Spectrum of S2
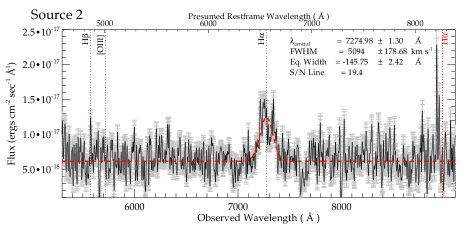
Figure 8 shows the final 1D spectrum corresponding to S2 covering the wavelength range from 5300-9100Å. At 8100Å the night-sky lines for these observations subtracted out rather poorly, yielding noisy data (see for example the noise spike at 8930Å in Figure 8). Only one emission line is detected in the spectrum at . Although a confirmed redshift cannot be ascertained from this data, we can constrain a likely redshift based on the assumption that the detected line is H. Given the broad wavelength range shown, if the line were H, then we would see H in the same window, assuming Case B recombination (Osterbrock, 1989), at least 2.86 times as strong as H. We can also eliminate the possibility that the line is Lyman- because there is strong continuum detected significantly blueward of the expected Lyman limit; there are no strong emission lines corresponding to CIV or CIII (all of which would fall within the wavelength range of our observations), and the flux associated with both the line and the XMM-Newton observations would be uncharacteristically bright for the required redshift of . The absence of H, or rather, the failure to detect H is not unexpected if the H from S2 arises from a Broad Line Region (BLR) in a radio galaxy or Seyfert 1.8/1.9, where the Balmer decrement can be up to a factor of 10 (e.g., Osterbrock et al., 1976; Osterbrock, 1981; Crenshaw et al., 1988). If the object is a QSO or Seyfert 1 the decrement could be up to a factor of 5 (e.g., Osterbrock, 1977; Dong et al., 2005). All of these scenarios would place the H line beyond the detection limits of the MODS-1 observations. Thus, assuming the detected emission line is H, S2 would therefore be a background AGN at 0.108 and not associated with J1329+3234. The total H flux within the 1.2′′ aperture is = erg cm-2 s-1.
4. Discussion
4.1. X-ray Emission from X-ray Binaries
Since the X-ray luminosity of J1329+3234 is low compared to powerful AGNs, we investigated the possibility that the observed X-ray emission is due to the integrated emission from a population of low mass and high mass X-ray binaries (LMXRBs and HMXRBs). Numerous studies of galaxies without AGNs have show that non-AGN X-ray emission is a function of the star formation rate (SFR) and the stellar mass of the host galaxy (e.g., Ranalli et al., 2003; Boroson et al., 2011; Lehmer et al., 2010). Because of the large difference between the SDSS fiber area and the X-ray extraction aperture (7 arcsec2 vs. 180 arcsec2), applying a simple geometric aperture correction to the extinction-corrected H luminosity introduces too much uncertainty into the estimate for the star formation rate. We therefore use the SFR from the Max Planck Institut fur Astrophysik/Johns Hopkins University (MPIA/JHU) collaboration555www.mpa-garching.mpg.de/SDSS/, which follows Brinchmann et al. (2004) with photometric corrections following Salim et al. (2007). In short, for galaxies without optical line emission evidence for AGN activity, fiber SFRs are “aperture corrected” by fitting stellar population models to photometry outside of the fiber and then calculating the galaxy-wide SFRs.
We note, however, that this represents the full, galaxy-wide SFR, and so somewhat overestimates any possible X-ray binary contamination within the XMM-Newton point-spread function. To remain as conservative as possible, we nonetheless use this SFR, which is 0.07 yr-1. Using the findings of Lehmer et al. (2010), this translates to a hard X-ray luminosity due to X-ray binaries of erg s-1, with a upper limit of erg s-1, still well over an order of magnitude less than what we observe (see Figure 9).
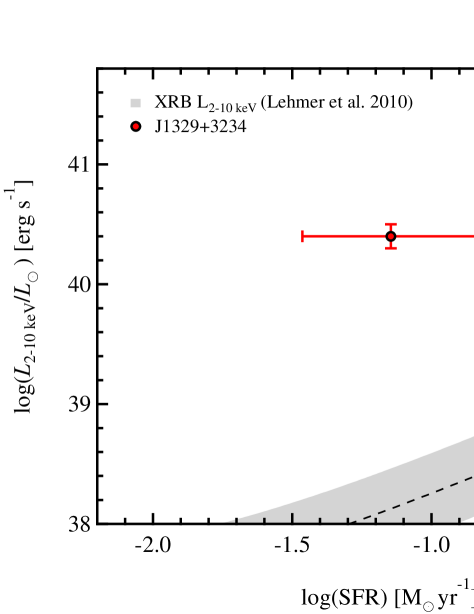
It is important to note, however, that the galaxies used in the sample of Lehmer et al. (2010) were massive, luminous infrared galaxies (LIRGs), and so it may not be the case that the calibration factors presented therein are accurate for a dwarf galaxy such as J1329+3234. Indeed, recent studies (e.g., Mapelli et al., 2010; Kaaret et al., 2011; Prestwich et al., 2013) have reported enhanced production of X-ray emission from XRBs in extremely low-metallicity galaxies relative to the star formation rate, presumably as a result of the presence of more massive stars and an enhancement of the accretion rates in low metallicity environments. While J1329+3234 is not an extremely metal poor dwarf galaxy for its mass ( 40% solar) we nonetheless estimated the X-ray emission produced by star formation assuming the relation found in extremely metal poor dwarfs. Using a sample of BCDs with , Brorby et al. (2014) find that the X-ray emission produced for a given SFR is approximately an order of magnitude larger than that found in near solar metallicity galaxies (see also Kaaret et al., 2011). Even if we combine this calibration factor with the upper limit to the hard X-ray luminosity due to the galaxy-wide SFR, the X-ray emission predicted from star formation ( erg s-1) is still about half the value that we observe.
As a further check on the possibility of HMXRB contamination, we explored the possibility that there may be heavily obscured star formation that would not reveal itself using traditional optical diagnostics. To obtain an extinction-insensitive upper limit on the SFR, we used the source lower sensitivity limit at 1.4 GHz derived from the NRAO VLA Sky Survey (NVSS666The National Radio Astronomy Observatory is a facility of the National Science Foundation operated under cooperative agreement by Associated Universities, Inc.) survey, in which J1329+3234 is not detected, which has a typical lower flux density limit for detected sources of 2.5 mJy. We derive a non-detection 1.4 GHz luminosity upper limit of W Hz-1. Combining this luminosity limit with Eq. 23 from Condon (1992) for the 1.4 GHz thermal free-free emission due to star formation, we derive an upper limit to the star formation rate of SFR( ) yr-1. Propagating this through the Lehmer et al. (2010) relation, we find an upper limit to the HMXRB X-ray luminosity of , still nearly an order of magnitude less than what we measure, and less than what we measure at the level on the Lehmer et al. (2010) relation. Furthermore, the angular resolution limit of the NVSS survey is , encompassing all of J1329+3234 and is considerably more than the angular resolution of XMM-Newton, and so this upper limit on the SFR should be considered very conservative.
Finally, we note that the likely variability of S1 (See §3.1), indicates that the X-ray emission is originating from a single source, further making it unlikely that a population of XRBs is responsible for the emission.
4.2. ULX Origin for the X-ray emission
Given the relatively low X-ray luminosity of S1, we investigated the possibility that the X-ray source in J1329+3234 is an ultraluminous X-ray source (ULX). ULXs are off-nuclear X-ray sources with luminosities in excess of 1039 erg cm-1, which is the Eddington luminosity of a stellar mass black hole. The luminosities of ULXs can be produced either by anisotropic emission (beaming) or super Eddington accretion from a stellar sized black hole or by accretion onto intermediate mass black holes (IMBHs), the latter scenario still being the subject of significant controversy (for a recent review see Feng & Soria, 2011). ULXs are generally rare; however they are preferentially found in regions of enhanced star formation (e.g., Gao et al., 2003; Mapelli et al., 2008) and low metallicity (e.g., Prestwich et al., 2013; Thuan et al., 2014), and the occurrence rate per unit galaxy mass is higher in dwarfs than more massive galaxies (Swartz et al., 2008). Recently Somers et al. (2013) found 16 ULXs in 8 bulgeless galaxies, some with luminosities in excess of erg cm-1. This raises the possibility that the X-ray source in J1329+3234 is a ULX, and therefore possibly consistent with a stellar sized black hole.
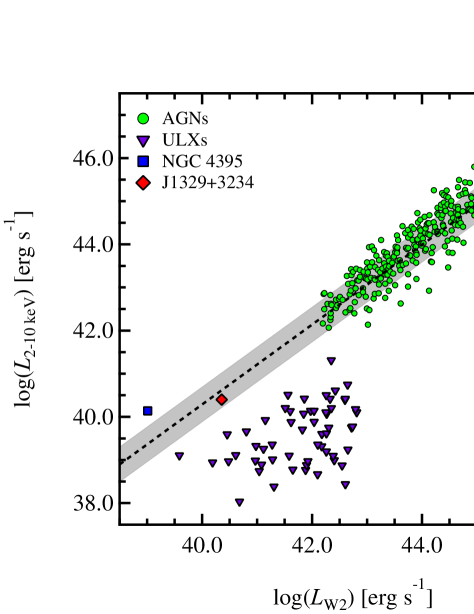
We investigated the possibility that the X-ray source in J1329+3234 is a ULX by comparing the X-ray and mid-infrared properties of J1329+3234 with those of definitive AGNs and ULXs that are cleanly separated from their galaxies’ nucleus. In AGNs, the hard X-ray emission and the mid-infrared continuum emission is strongly correlated (Lutz et al., 2004). This is expected because the hard X-ray emission provides a direct view of the central engine, and the nuclear infrared continuum is dominated by thermally reprocessed radiation from the AGN. We derived our sample of AGNs in the following manner: We cross-matched the final WISE all-sky data release catalog (AllWISE777wise2.ipac.caltech.edu/docs/release/allsky/) with the 3XMM-DR4 catalog to within less than , and obtained redshifts from SDSS DR10888www.sdss3.org/dr10/ in a similar manner. We required that the WISE , , and band fluxes have a signal-to-noise ratio greater than or equal to , and that there be no photometric quality or source extent flags. We similarly required that the XMM-Newton hard band “SC_EP4_FLUX” and “SC_EP5_FLUX” values have a combined signal-to-noise ratio greater than or equal to , and that there be no high background level (flaring) flags. We further required that the X-ray sources show no sign of spatial extent by requiring the “SC_EXTENT” flag be equal to 0, and that the source observation off-axis angles be less than to minimize off-axis aberrations. We finally required redshifts greater than to reduce distance errors. This selection yielded 184 AGNs with 2-10 keV luminosities between = 42.1-46.7 and luminosities between = 42.2-46.5 [erg s-1]. The mean mid-IR colors of these 184 AGNs are - = 1.01 mag. and - = 2.98 mag., with standard deviations of 0.29 mag. and 0.35 mag., respectively. We estimated the linear regression fit between and by drawing random samples with replacement (bootstrapping) of our 184 AGNs, finding a strong correlation (Pearson ) with:
with a standard deviation of = 0.40 dex in the direction and the units of luminosity used being erg s-1. For comparison, we fit the 6 continuum/2-10 keV X-ray luminosity data used for a sample of Sy 1 and Sy 2 galaxies in Lutz et al. (2004), and found good agreement, with a slope of , intercept of , and =0.43 dex.
In order to compare the mid-IR and X-ray properties of these AGNs with those of ULXs, we used the most recent and comprehensive catalog of ULXs by Walton et al. (2011), which consists of 470 ULX candidates, located in 238 nearby galaxies, generated by cross-correlating the 2XMM Serendipitous Survey (Watson et al., 2009) with the Third Reference Catalogue of Bright Galaxies. We crossmatched this catalog with AllWISE to within less than and find that 228 ULXs are associated with WISE sources. Of these, only 57 had WISE photometry with , , and detections with signal-to-noise greater than , and all are extended in the WISE bands, suggesting that these ULXs are not being detected in the mid-IR themselves, but rather are simply associated with large-scale, extended emission from star formation. In Figure 10, we plot the hard X-ray luminosity versus the band luminosity for AGNs, ULXs, and J1329+3234, along with the linear regression derived above. As can be seen, J1329+3234 has mid-IR and X-ray properties completely consistent with AGNs, while ULXs do not. We further note in Figure 10 that NGC 4395, the archetypical bulgeless dwarf Seyfert 1 galaxy, also follows this trend derived from much brighter AGNs, implying that AGNs do not deviate significantly from this relationship for a wide range of X-ray luminosities.
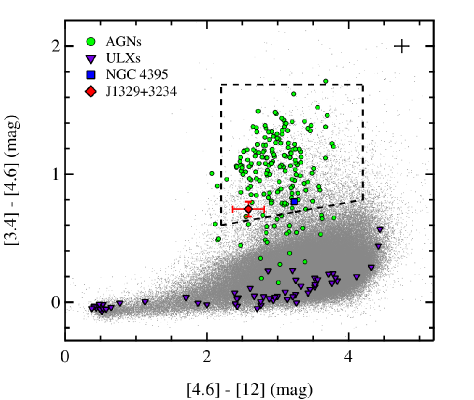
The ULXs are also associated with significantly different mid-IR colors than AGNs. The average - color associated with these 57 ULX sources detected by WISE is 0.07, with a maximum of 0.57. In Figure 11, we plot the - versus - colors of the ULXs, our AGN sample from above, J1329+3234, normal galaxies from SDSS, and the 3-band AGN demarcation region from Jarrett et al. (2011). As can be seen, the ULXs are clearly separated from J1329+3234, which falls well within the AGN region of the color-color diagram, as do the majority of our sample AGNs. Even amongst the most extreme ULXs ( erg s-1) in this catalog (Sutton et al., 2012), all of which are well separated from the galaxy nuclei and are unlikely to be background AGNs, only 3 are associated with WISE sources, all of which are resolved and none have red WISE colors.
4.3. Red WISE Colors in Low Mass Starburst Galaxies
Given the above considerations, the only plausible explanation for the mid-IR and X-ray properties of J1329+3234 is the presence of an AGN. We note, however, that J1329+3234 is certainly not the only dwarf galaxy with extreme or unusual mid-IR colors. For example, Izotov et al. (2011) find, from a sample of SDSS galaxies with WISE colors, 4 dwarf galaxies with extreme WISE colors - mag. Like J1329+3234, these galaxies are in the mass range of , and like J1329+3234, these galaxies are not particularly metal-poor dwarfs, with =0.2-0.5. However, these four galaxies occupy a completely different region of mid-IR color space than J1329+3234, not only with -=2.13-2.37, but most notably with -=3.58-4.76, indicating considerably more emission at longer wavelengths from dust heating due to starbursts. Indeed, the SFRs of these four galaxies are in the range of 5.8 to 26.5 yr-1, at least two orders of magnitude higher than J1329+3234. Finally, there exists a single Chandra observation of one of the four galaxies from Izotov et al. (2011), J1457+2232, observed 2007 March 23 with ACIS-I for 7.2 ks (ObsID 7709; PI: Garmire). The galaxy is not detected, with a upper limit to the 2-10 keV flux of erg cm-2 s-1, assuming a similar X-ray spectrum to J1329+3234. Given this galaxy’s relatively high mid-IR luminosity of erg s-1, this galaxy is at least two orders of magnitude underluminous in the hard X-rays compared to AGN-hosting galaxies (see §4.2), with a hard X-ray upper luminosity limit of erg s-1. Thus, we conclude that the colors of J1329+3234, along with the SFR and the X-ray luminosity, are not consistent with a population of low-mass starburst galaxies.
4.4. Black Hole Mass
Because the ratio of the hard X-ray luminosity to the mid-IR luminosity is consistent with what is seen in AGNs, it is unlikely that we are seeing beamed X-ray emission. With this in mind, we can immediately calculate the Eddington lower mass limit. Using a conservative bolometric correction factor of (Vasudevan & Fabian, 2007, 2009), we get a lower mass limit of . More realistically, the black hole is not radiating at its theoretical upper limit. If the black hole is accreting at a rate similar to that found for the sample of low-mass black holes from Greene & Ho (2007), then and the black hole mass is . There is considerable spread in their sample, however, and several low-mass black holes radiate as low as . In this case, the in J1329+3234 has a mass of about .
4.5. Host Galaxy Properties
J1329+3234 is a very low luminosity dwarf. The absolute band magnitude is -16.3, almost two magnitudes fainter than the LMC (Tollerud et al., 2011), and is fainter than about of the host galaxies in the sample of dwarfs with optical AGNs from Reines et al. (2013), which ranges from -15.2 to -21.2 (mean -18.2, , number of galaxies ). These are in turn considerably fainter than previous sample of low mass optically identified AGNs from Greene & Ho (2007), which range from -17.6 to -21.4 (mean -19.7, , ), and the sample of Dong et al. (2012), which range from -17.4 to -22.4 (mean -20.3, , ).
Based on the SDSS images, the host galaxy reveals an irregular clumpy morphology in the optical, typical of irregular dwarf galaxies. J1329+3234 is slightly extended for a galaxy in its mass range, with a Petrosian half-light radius = 1.82 kpc, which is more extended than about of the galaxies in the mass range , and somewhat more extended than the original definition of a blue compact dwarf galaxy (BCD; Thuan & Martin (1981)). We used the two dimensional parametric fitting program galfit (Peng et al., 2010) to model the band image of J1329+3234. The best fit model consists of a single Sersic with = 0.9, consistent with an exponential disk and two off-nuclear clumpy structures. There is no evidence for a bulge component based on the SDSS images and no clear spiral structure apparent in the SDSS bands. While AGNs are found in disk galaxies, the fraction of optically selected AGNs even within low mass galaxies is higher in galaxies with higher Sersic indices (e.g., Reines et al., 2013). The - color of J1329+3234 is -0.5 mag., comparable to the median color of the dwarfs studied by Reines et al. (2013).
The stellar mass of J1329+3234 from the NASA-Sloan Atlas (NSA999www.nsatlas.org; ID=93798) is = 8.3, similar in mass to the SMC (e.g., Skibba et al., 2012), and less massive than any of the 35 optically-identified AGNs dwarf galaxies from Reines et al. (2013) (lowest mass galaxy NSA ID=60536, ), although similar to the lowest mass, optically normal galaxy in their sample with broad H emission (NSA ID = 15952, ), identified as a possible low-metallicity AGN in Izotov et al. (2007). If more galaxies in this mass range are confirmed to host AGNs through X-ray observations, then a key result from this study is that the fraction of AGNs at low stellar masses, revealed by WISE, may be much higher than the fraction of AGNs revealed optically (Satyapal et al., 2014). This is in direct contrast with results from optical spectroscopic surveys, which show that the AGN fraction approaches nearly 100% for all emission line galaxies at the highest masses and drops dramatically with decreasing stellar mass (see Figure 5, solid histogram in top panel, in Kauffmann et al., 2003).
5. Summary and Conclusions
We have conducted our first follow-up X-ray observations of a newly discovered population of low mass and bulgleless galaxies that display extremely red mid-infrared colors highly suggestive of a dominant AGN despite having no optical signatures of accretion activity. Our main results can be summarized as follows:
-
1.
Using XMM-Newton observations, we have confirmed the presence of a hard X-ray point source consistent with AGN activity in J1329+3234, an optically normal dwarf galaxy with red infrared colors obtained from WISE.
-
2.
The X-ray luminosity of J1329+3234 is erg s-1 . Assuming that the black hole is radiating at the Eddington limit and using a conservative bolometric correction factor of , this corresponds to a lower limit on the black hole mass of .
-
3.
From multi-wavelength considerations, the X-ray/mid-IR activity of J1329+3234 is consistent with the presence of an AGN, and it is unlikely that the X-ray source in J1329+3234 is due to X-ray binary activity or is a ULX.
-
4.
With a stellar mass of , J1329+3234 is among the lowest mass dwarf galaxies with evidence for AGN activity currently known.
6. Acknowledgements
We thank the anonymous referee for a very thorough and considered review that significantly improved the quality of this paper. N. J. S. and S. S. gratefully acknowledge support by the Chandra Guest Investigator Program under NASA Grant G01-12126X. J. L. R. acknowledges support from NSF-AST 000167932. Basic research in astronomy at the Naval Research Laboratory is funded by the Office of Naval Research.
References
- Arnaud (1996) Arnaud, K. A. 1996, Astronomical Data Analysis Software and Systems V, 101, 17
- Araya Salvo et al. (2012) Araya Salvo, C., Mathur, S., Ghosh, H., Fiore, F., & Ferrarese, L. 2010, ApJ, 757,179
- Assef et al. (2013) Assef, R. J., Stern, D., Kochanek, C. S., et al. 2013, ApJ, 772, 26
- Barth et al. (2004) Barth, A. J., Ho, L. C., Rutledge, R. E., & Sargent, W. L. W. 2004, ApJ, 607, 90
- Bizzocchi et al. (2014) Bizzocchi, L., Filho, M. E., Leonardo, E., et al. 2014, ApJ, 782, 22
- Boroson et al. (2011) Boroson, B., Kim, D.-W., & Fabbiano, G. 2011, ApJ, 729, 12
- Brinchmann et al. (2004) Brinchmann, J., Charlot, S., White, S. D. M., et al. 2004, MNRAS, 351, 1151
- Brorby et al. (2014) Brorby, M., Kaaret, P., & Prestwich, A. 2014, MNRAS, 441, 2346
- Coelho et al. (2013) Coelho, B., Antón, S., Lobo, C., & Ribeiro, B. 2013, MNRAS, 436, 2426
- Condon (1992) Condon, J. J. 1992, ARA&A, 30, 575
- Crenshaw et al. (1988) Crenshaw, D. M., Peterson, B. M., & Wagner, R. M. 1988, AJ, 96, 1208
- Desroches & Ho (2009) Desroches, L. B., & Ho, L. C. 2009, ApJ, 690, 267
- Dewangan et al. (2005) Dewangan, G. C., Griffiths, R. E., Choudhury, M., Miyaji, T., & Schurch, N. J. 2005, ApJ, 635, 198
- Dong et al. (2012) Dong, X.-B., Ho, L. C., Yuan, W., et al. 2012, ApJ, 755, 167
- Dong et al. (2005) Dong, X.-B., Zhou, H.-Y., Wang, T.-G., et al. 2005, ApJ, 620, 629
- Feng & Soria (2011) Feng, H., & Soria, R. 2011, Nature, 55, 166
- Filippenko & Ho (2003) Filippenko, A., & Ho, L. 2000, ApJ, 588, L13
- Gao et al. (2003) Gao, Y., Wang, Q. D., Appleton, P. N., & Lucas, R. A. 2003, ApJ, 596, L171
- Ghosh et al. (2008) Ghosh, H., Mathur, S., Fiore, F., & Ferrarese, L. 2008, AIPC, 1053, 39G
- Gliozzi et al. (2009) Gliozzi, M., Satyapal, S., Erancleous, M., Titarchuk, L., & Cheung, C. C. 2009, ApJ, 700, 1759
- Greene & Ho (2007) Greene, J. E., & Ho, L. C. 2007, ApJ, 667, 131
- Greene & Ho (2007) Greene, J. E., & Ho, L. C. 2007, ApJ, 670, 92
- Griffith et al. (2011) Griffith, R. L., et al. 2011, ApJ, 736, L22
- Izotov et al. (2011) Izotov, Y. I., Guseva, N. G., Fricke, K. J., & Henkel, C. 2011, A&A, 536, L7
- Izotov et al. (2014) Izotov, Y. I., Guseva, N. G., Fricke, K. J., & Henkel, C. 2014, A&A, 561, A33
- Izotov & Thuan (2008) Izotov, Y. I., & Thuan, T. X. 2008, ApJ, 687, 133
- Izotov et al. (2007) Izotov, Y. I., Thuan, T. X., & Guseva, N. G. 2007, ApJ, 671, 1297
- Jarrett et al. (2011) Jarrett, T. H., Cohen, M., Masci, F., et al. 2011, ApJ, 735, 112
- Kaaret et al. (2011) Kaaret, P., Schmitt, J., & Gorski, M. 2011, ApJ, 741, 10
- Kauffmann et al. (2003) Kauffmann, G., et al. 2003, MNRAS, 346, 1055
- Lehmer et al. (2010) Lehmer, B. D., Alexander, D. M., Bauer, F. E., et al. 2010, ApJ, 724, 559
- Lutz et al. (2004) Lutz, D., Maiolino, R., Spoon, H. W. W., & Moorwood, A. F. M. 2004, A&A, 418, 465
- Maksym et al. (2014) Maksym, W. P., Ulmer, M. P., Roth, K. C., et al. 2014, MNRAS, 444, 866
- Mapelli et al. (2008) Mapelli, M., Moore, B., Giordano, L., et al. 2008, MNRAS, 383, 230
- Mapelli et al. (2010) Mapelli, M., Ripamonti, E., Zampieri, L., Colpi, M., & Bressan, A. 2010, MNRAS, 408, 234
- McAlpine et al. (2011) McAlpine, W., Satyapal, S., Gliozzi, M., et al. 2010, ApJ, 728, 1
- Osterbrock (1977) Osterbrock, D. E. 1977, ApJ, 215, 733
- Osterbrock (1981) Osterbrock, D. E. 1981, ApJ, 249, 462
- Osterbrock (1989) Osterbrock, D. E. 1989, Research supported by the University of California, John Simon Guggenheim Memorial Foundation, University of Minnesota, et al. Mill Valley, CA, University Science Books, 1989, 422 p.,
- Osterbrock et al. (1976) Osterbrock, D. E., Koski, A. T., & Phillips, M. M. 1976, ApJ, 206, 898
- Peng et al. (2010) Peng, C. Y., Ho, L. C., Impey, C. D., & Rix, H.-W. 2010, AJ, 139, 2097
- Pogge et al. (2006) Pogge, R. W., Atwood, B., Belville, S. R., et al. 2006, Proc. SPIE, 6269,
- Pogge et al. (2010) Pogge, R. W., Atwood, B., Brewer, D. F., et al. 2010, Proc. SPIE, 7735,
- Pons & Watson (2014) Pons, E., & Watson, M. G. 2014, A&A, 568, A108
- Prestwich et al. (2013) Prestwich, A. H., Tsantaki, M., Zezas, A., et al. 2013, ApJ, 769, 92
- Ranalli et al. (2003) Ranalli, P., Comastri, A., & Setti, G. 2003, A&A, 399, 39
- Reines & Deller (2012) Reines, A. E., & Deller, A. T. 2012, ApJ, 750, L24
- Reines et al. (2013) Reines, A. E., Greene, J. E., & Geha, M. 2013, ApJ, 775, 116
- Reines et al. (2014) Reines, A. E., Plotkin, R. M., Russell, T. D., et al. 2014, ApJ, 787, L30
- Reines et al. (2011) Reines, A. E., Sivakoff, G R., Johnson, K. E., Brogan, C. L. 2011, Nature, 470, 66
- Salim et al. (2007) Salim, S., Rich, R. M., Charlot, S., et al. 2007, ApJS, 173, 267
- Satyapal et al. (2009) Satyapal, S., Böker, T., Mcalpine, W., et al. 2009, ApJ, 704, 439
- Satyapal et al. (2014) Satyapal, S., Secrest, N. J., McAlpine, W., et al. 2014, ApJ, 784, 113
- Satyapal et al. (2008) Satyapal, S., Vega, D., Dudik, R. P., Abel, N. P., & Heckman, T. 2008, ApJ, 677, 926
- Satyapal et al. (2007) Satyapal, S.,Vega, D., Heckman, T., O’Halloran, B., & Dudik, R. 2007, ApJ, 663, L9
- Secrest et al. (2012) Secrest, N. J., Satyapal, S., Gliozzi, M., et al. 2012, ApJ, 753, 38
- Secrest et al. (2013) Secrest, N. J., Satyapal, S., Moran, S. M., et al. 2013, ApJ, 777, 139
- Schlafly & Finkbeiner (2011) Schlafly, E. F., & Finkbeiner, D. P. 2011 ApJ, 737, 103
- Shields et al. (2008) Shields, J. C., et al. 2008, ApJ, 682, 104
- Skibba et al. (2012) Skibba, R. A., Engelbracht, C. W., Aniano, G., et al. 2012, ApJ, 761, 42
- Somers et al. (2013) Somers, G., Mathur, S., Martini, P., et al. 2013, ApJ, 777, 7
- Sutton et al. (2012) Sutton, A. D., Roberts, T. P., Walton, D. J., Gladstone, J. C., & Scott, A. E. 2012, MNRAS, 423, 1154
- Swartz et al. (2008) Swartz, D. A., Soria, R., & Tennant, A. F. 2008, ApJ, 684, 282
- Terashima et al. (2002) Terashima, Y., Iyomoto, N., Ho, L. C., & Ptak, A. F. 2002, ApJS, 139, 1
- Thuan et al. (2014) Thuan, T. X., Bauer, F. E., & Izotov, Y. I. 2014, MNRAS, 441, 1841
- Thuan & Martin (1981) Thuan, T. X., & Martin, G. E. 1981, ApJ, 247, 823
- Tollerud et al. (2011) Tollerud, E. J., Boylan-Kolchin, M., Barton, E. J., Bullock, J. S., & Trinh, C. Q. 2011, ApJ, 738, 102
- van Wassenhove et al. (2010) van Wassenhove, S., Volonteri, M., Walker, M. G., & Gair, J. R. 2010, MNRAS, 408, 1139
- Vasudevan & Fabian (2007) Vasudevan, R. V., & Fabian, A. C. 2007, MNRAS, 381, 1235
- Vasudevan & Fabian (2009) Vasudevan, R. V., & Fabian, A. C. 2009, MNRAS, 392, 1124
- Volonteri (2010) Volonteri, M. 2010, A&A Rev., 18, 27
- Walton et al. (2011) Walton, D. J., Roberts, T. P., Mateos, S., & Heard, V. 2011, MNRAS, 416, 1844
- Watson et al. (2009) Watson, M. G., Schröder, A. C., Fyfe, D., et al. 2009, A&A, 493, 339