A detailed study of the optical attenuation of gamma-ray bursts in the Swift era
Abstract
We present optical and near-infrared (NIR) photometry of 28 gamma-ray bursts (GRBs) detected by the Swift satellite and rapidly observed by the Reionization and Transients Infrared/Optical (RATIR) camera. We compare the optical flux at fiducial times of 5.5 and 11 hours after the high-energy trigger to that in the X-ray regime to quantify optical darkness. 469 per cent (13/28) of all bursts in our sample and 5510 per cent (13/26) of long GRBs are optically dark, which is statistically consistently with previous studies. Fitting RATIR optical and NIR spectral energy distributions (SEDs) of 19 GRBs, most (6/7) optically dark GRBs either occur at high-redshift () or have a high dust content in their host galaxies (). Performing K-S tests, we compare the RATIR sample to those previously presented in the literature, finding our distributions of redshift, optical darkness, host dust extinction and X-ray derived column density to be consistent. The one reported discrepancy is with host galaxy dust content in the BAT6 sample, which appears inconsistent with our sample and other previous literature. Comparing X-ray derived host galaxy hydrogen column densities to host galaxy dust extinction, we find that GRBs tend to occur in host galaxies with a higher metal-to-dust ratio than our own Galaxy, more akin to the Large and Small Magellanic Clouds. Finally, to mitigate time evolution of optical darkness, we measure at a fixed rest frame time, hours and fixed rest frame energies in the X-ray and optical regimes. Choosing to evaluate optical flux at m, we remove high-redshift as a source of optical darkness, demonstrating that optical darkness must result from either high-redshift, dust content in the host galaxy along the GRB sight line, or a combination of the two.
keywords:
gamma-rays: bursts.1 Introduction
Gamma-ray bursts (GRBs) are powerful explosions likely to be the outcome of the collapse of massive stars (Woosley & Bloom, 2006) or of the merger of compact objects in binaries or dense stellar systems (Grindlay et al., 2006; Nakar, 2007; Lee & Ramirez-Ruiz, 2007; Lee et al., 2010). The central engine, accreting in the hypercritical neutrino-cooled regime, produces a collimated ultra-relativistic outflow (Rhoads, 1999; Panaitescu & Kumar, 2002), which converts energy to radiation through internal shocks (Rees & Meszaros, 1994), and external shocks with the surrounding medium (see e.g.; Piran 2004 and references therein), producing bright fluxes across the electromagnetic spectrum. As such they allow us to probe the Universe at a wide range of redshifts (Tanvir et al., 2009; Salvaterra et al., 2009; Cucchiara et al., 2011) and explore the properties of host galaxies and intervening matter along the GRB line of sight.
The intrinsic emission from GRBs is attributed to synchrotron radiation during both the prompt (Zhang, 2014) and afterglow (Granot & Sari, 2002) phases. Broadband observations across the electromagnetic spectrum are required to confirm this mechanism (e.g.; Perley et al. 2014). Along the line of sight to the observer photons must pass through the host galaxy interstellar medium (Savaglio et al., 2009), the intergalactic medium (IGM; Gunn & Peterson 1965) and the Milky Way (MW; Schlegel et al. 1998). Each of these environments affect the observed spectral energy distribution (SED) of the burst, potentially leading to the GRB being fainter in some wavelength regimes than expected under the standard GRB paradigm.
Broadband, multiwavelength observations of GRBs require rapid and precise localisations, which are now routinely provided by the Swift satellite (Gehrels et al., 2004). Extensive ground-based follow-up of GRBs is enabled by arcsecond precision measurements made by the on-board X-ray Telescope (XRT; Burrows et al. 2005) and Ultraviolet/Optical Telescope (UVOT; Roming et al. 2005). Included in the numerous facilities now routinely observing GRBs is the Reionization and Transients Infrared/Optical (RATIR) camera (Butler et al., 2012). RATIR has an automatic response to Swift triggers, allowing it to observe a given field of view within minutes of an alert notice of a new gamma-ray burst (Watson et al., 2012; Klein et al., 2012). With almost simultaneous coverage in six filters in the optical to near infrared (NIR) regimes (from 5600 to 16000 Å; riZYJH), RATIR enables the modelling of SEDs using templates for the IGM and different extinction models for the host galaxy (Littlejohns et al., 2014). Such modelling allows us to quantify host galaxy dust extinction and estimate a photometric redshift (Curran et al., 2008; Krühler et al., 2011).
The Swift/XRT detects emission associated with approximately 90 per cent of the GRBs detected by the Swift Burst Alert Telescope (BAT; Barthelmy et al. 2005) (Evans et al., 2009; Grupe et al., 2013). However, observations with the Swift/UVOT and ground-based telescopes detect only about 40–60 per cent in the optical regime (Kann et al., 2010; Rossi et al., 2012; Li et al., 2012). Some of the optical non-detections are consistent with an extrapolation from the X-ray emission using a standard unreddened synchrotron power-law spectrum. However, approximately 25–50 per cent require a steeper spectrum (Melandri et al., 2008; Cenko et al., 2009; Fynbo et al., 2009; Greiner et al., 2011; Melandri et al., 2012), and these are called “optically dark” GRBs (Jakobsson et al., 2004; Rol et al., 2005; van der Horst et al., 2009).
There are two explanations attributed to such optical darkness; attenuation by material in the host galaxy (Savaglio et al., 2009) or suppression by Ly- absorption in the IGM (Lamb & Reichart, 2000). For the latter effect to reduce flux in the optical regime, a GRB must lie at high redshift (). Quantifying both of these effects is important, as they allow us to study galaxy evolution as well as that of the star formation rate (SFR) and metallicity of galaxies as a function of redshift (Savaglio et al., 2012; Cucchiara et al., 2014).
In this work we first describe the data obtained from both the Swift/XRT and RATIR. We then briefly present the success RATIR has had in rapid follow-up of Swift GRB triggers. In § 3 we define optical darkness, and identify those bursts which are considered under-luminous in the optical regime when compared to the X-ray observations. We present our optical and NIR SED fitting results in § 3.2. With SED templates in hand, we comment upon how many GRBs may occur at high redshift and upon the dust content of these GRB host galaxies. Finally, we attempt to mitigate any temporal evolution in optical darkness by taking a rest frame defined measure, which is presented and discussed in § 3.3.
2 Data
2.1 X-ray data
Swift/XRT count rate light curves were obtained from the Swift/XRT light curve repository (Evans et al., 2007, 2009) hosted at the UK Swift Science Data Centre (UKSSDC)111www.swift.ac.uk/xrt_curves. Spectral information for the Windowed Timing (WT) and Photon Counting (PC) modes was obtained from the pipeline detailed in Butler & Kocevski (2007a). We first convert the Swift/XRT count rate light curves to flux light curves across the entire 0.3–10.0 keV energy band. Then, using the spectral models of Butler & Kocevski (2007a), we convert this full band flux to a flux density at 1 keV.
As Swift/XRT and RATIR observations were not always simultaneous, we fitted the XRT light curves using the morphological model of Willingale et al. (2007). To do so, we first identified epochs of flaring within the XRT light curve using the methodology described in the updated documentation222http://www.swift.ac.uk//xrt_live_cat/docs.php#lc of the UKSSDC burst analyser (Evans et al., 2009, 2010), which is outlined below.
Each light curve was initially fitted with the Willingale et al. (2007) model. If XRT observations began within 2 ks of the initial Swift/BAT trigger, then two Willingale et al. (2007) components were used. Otherwise, the light curve was fitted using only a single component.
In cases where the rapid decay phase (RDP) (O’Brien et al., 2006; Nousek et al., 2006) was observed, this was used to constrain the power-law index and plateau time of the prompt emission tail component. This prompt component was fitted to data prior to the end of the RDP. A second afterglow component was initially fitted to the data after the end of the RDP. A combined fit was then performed using both components and the values derived from the preliminary modelling of each component individually. In cases where observations began at least 2 ks after the Swift/BAT trigger time the single component was fitted to the entire range of data.
Once a model for the data set had been produced, our algorithm searched the data for points where the model significantly under-predicted the observed flux. The condition for significance within 3 ks of the trigger time was 8 whilst bins after this time required 10 significance to be marked as a candidate flare.
If any candidate flares were found, the most significant was removed from the data set and the data were re-fitted. This process was repeated iteratively until no new significant flares were found. In cases where 5 or more consecutive bins were designated a flare, the significance threshold was reduced to 6 and 8 for flares peaking before and after 3 ks, respectively.
For the majority of GRBs, the rise of the X-ray afterglow was unobserved. This is primarily due to the light curve being dominated by the RDP at this epoch. We therefore fixed the afterglow rise time to s, with the exception of three bursts (GRB 130514B, GRB 130603B and GRB 130606A), in which was allowed to float to ensure a good fit was obtained.
2.2 RATIR data
RATIR is a six band simultaneous optical and NIR imager mounted on the autonomous 1.5 m Harold L. Johnson Telescope at the Observatorio Astronómico Nacional on Sierra San Pedro Mártir in Baja California, Mexico. Since commencing full operations in 2012 December, RATIR has been responding to GRB triggers from the Swift satellite, obtaining simultaneous photometry in the r, i, Z, Y, J and H bands (Butler et al., 2012; Watson et al., 2012; Klein et al., 2012; Fox et al., 2012).
RATIR has four detectors, two optical and two infrared cameras, allowing four images of a source to be taken simultaneously, either in riZJ or riYH. Both of the infrared detectors have split filters so that, by dithering sources across the field of view, they can be observed in all six RATIR filters. Individual frames from the optical cameras have exposure times of 80 s, whilst those from the NIR cameras are 67 s due to additional overheads.
The images are reduced in near real-time using an automatic pipeline. Bias subtraction and twilight flat division are performed using algorithms written in python, image alignment is conducted by astrometry.net (Lang et al., 2010) and image co-addition is achieved using swarp (Bertin, 2010).
We use sextractor (Bertin & Arnouts, 1996) to calculate photometry for individual science frames and mosaics with apertures ranging from 2 to 30 pixels in diameter, with an optical and NIR pixel scales of 0.32′′.pixel-1 and 0.3′′.pixel-1, respectively. Taking a weighted average of the flux in these apertures for all stars in a field, we construct an annular point-spread-function (PSF). Point source photometry is then optimised by fitting this PSF to the annular flux values of each source.
To calibrate our field photometry, we compare our values to existing catalogues, including the Sloan Digital Sky Survey Data Release 9 (SDSS DR9; Ahn et al. 2012). The RATIR and SDSS r, i and Z bands agree to within 3 per cent (Butler et al., 2015). The J and H bands are calibrated relative to the Two Micron All Sky Survey (2MASS; Skrutskie et al. 2006). We use an empirical relation for Y in terms of J and H magnitudes derived from the United Kingdom Infrared Telescope (UKIRT) Wide Field Camera observations (WFCAM; Hodgkin et al. 2009; Casali et al. 2007). For fields of view without SDSS observations we use the United States Naval Observatory (USNO)-B1333http://tdc-www.harvard.edu/catalogs/ub1.html catalogue (Monet et al., 2003) to calibrate the r and i band photometry. In these instances we use an empirical relation from WFCAM to calculate Z band magnitudes.
We initially considered all GRBs observed by RATIR from 2013 January 1 to 2014 July 11 inclusive. In this time RATIR observed the fields of 80 GRBs. 64 of these were from Swift on-board triggers, with the other 16 being from Swift Target of Opportunity (ToO) requests. A breakdown of the response time for RATIR to Swift/BAT on-board triggers is shown in Table 1.
| Time delay | GRBs | Percentage |
|---|---|---|
| (hours) | (detected/observed) | of total |
| 0.5 | 5 / 10 (50%) | 15.6% |
| 0.5 – 4 | 9 / 12 (75%) | 18.8% |
| 4 – 8 | 4 / 7 (57%) | 10.9% |
| 8 – 16 | 6 / 19 (32%) | 29.7% |
| 16 – 24 | 0 / 10 (0%) | 15.6% |
| 24 | 2 / 6 (33%) | 9.4% |
In this study, we only consider those GRBs observed by RATIR within 10 hours of the initial high-energy trigger. We analysed the completeness of the RATIR sample as a function of delay between the initial GRB trigger time and the beginning of RATIR observations. For bursts responded to within 10 hours of the Swift trigger, the RATIR sample has a detection rate of approximately 50 per cent. After 10 hours this fraction rapidly reduces (5/31), showing that at times greater than 10 hours the RATIR sample is significantly less complete. This is illustrated, to some extent, in Table 1. GRBs with early epoch observations also provide a better data set for later modelling of the optical light curve. This limits our sample to only 33 bursts, all of which are Swift/BAT on-board triggers. Three of these GRBs do not have XRT observations (GRB 130626A, GRB 140118A and GRB 130215A), one burst occurred during cloudy weather at the observatory (GRB 130122A), and a further GRB was observed by RATIR in only the Z and Y bands (GRB 130504A). These five GRBs were therefore removed from the sample.
To obtain light curves for each of the GRBs in our sample, we first concatenated all epochs of observation for each burst. We then removed the effects of Galactic foreground extinction using the dust maps of Schlafly & Finkbeiner (2011). For those bursts with sufficient data (14/28), we modelled the optical light curve with both a power-law and broken power-law (Liang et al., 2008; Oates et al., 2009; Cenko et al., 2009) using mpfit (Markwardt, 2009). An F-test was used to determine if the temporal break was warranted, finding such a break to be statistically significant at the 3 level for only 2 GRBs (GRB 130427A & GRB 131030A).
3 Analysis
| GRB | Delay | Duration | RATIR | XRT | Notes | |||||
|---|---|---|---|---|---|---|---|---|---|---|
| (mins) | (mins) | (11 hours) | (5.5 hours) | (1021 cm-2) | ||||||
| 130122A | 483.7 | 35 | … | Y | … | 0.84 | … | … | … | Clouds |
| 130215A | 96.8 | 27 | M | N | 0.5971 | … | … | … | … | … |
| 130327A | 71.0 | 49 | D | Y | … | 1.00 | 0.640.13 | 0.660.13 | … | … |
| 130418A | 494.9 | 184 | M | Y | 1.2182 | 0.59 | 1.010.09 | 1.070.08 | 0.0 | … |
| 130420A | 136.7 | 21 | M | Y | 1.2973 | 1.28 | 0.650.06 | 0.680.06 | 3.9 | … |
| 130427A | 16.9 | 64 | M | Y | 0.3404 | 0.82 | 0.600.03 | 0.610.02 | 1.0 | … |
| 130502A | 569.4 | 43 | UL | Y | … | 1.12 | 0.50 | 0.51 | … | … |
| 130504A | 90.3 | 207 | D | Y | … | 1.91 | … | … | … | … |
| 130514A | 5.4 | 149 | UL | Y | 3.65 | 1.34 | 0.22 | 0.20 | 37.4 | Photometric redshift |
| 130606A | 443.0 | 265 | M | Y | 5.9136 | 0.87 | 0.290.41 | 0.330.40 | 8.4 | … |
| 130609A | 702.0 | 85 | UL | Y | … | 1.95 | 0.14 | 0.15 | … | … |
| 130610A | 52.5 | 175 | M | Y | 2.0927 | 1.08 | 0.850.07 | 0.810.07 | 3.3 | … |
| 130612A | 24.1 | 319 | M | Y | … | 1.07 | 0.895.93 | 0.902.29 | … | … |
| 130626A | 3.0 | 13 | … | N | … | … | … | … | … | s |
| 130701A | 300.3 | 21 | D | Y | 1.1558 | 1.08 | 0.750.02 | 0.720.01 | 4.3 | … |
| 130907A | 334.4 | 21 | M | Y | 1.2389 | 0.96 | 0.330.05 | 0.250.05 | 7.5 | … |
| 130925A | 138.0 | 233 | M | Y | 0.34710 | 2.44 | 0.020.06 | 0.160.06 | 19.6 | … |
| 131004A | 307.1 | 144 | UL | Y | 0.71711 | 0.94 | 1.08 | 0.90 | 5.1 | s |
| 131030A | 294.4 | 260 | M | Y | 1.29312 | 1.19 | 0.730.02 | 0.710.02 | 4.6 | … |
| 140114A | 9.4 | 43 | D | Y | … | 0.99 | 0.260.06 | 0.270.05 | … | … |
| 140118A | 39.6 | 4 | … | N | … | … | … | … | … | … |
| 140129A | 12.4 | 56 | M | Y | … | 1.00 | 0.660.06 | 0.660.05 | … | … |
| 140215A | 38.7 | 64 | M | Y | … | 0.97 | 0.910.04 | 0.910.04 | … | … |
| 140311A | 524.8 | 125 | D | Y | 4.95413 | 0.72 | 0.570.25 | 0.530.24 | 0.0 | … |
| 140318A | 294.6 | 211 | D | Y | 1.0214 | 1.43 | 0.790.55 | 0.820.47 | 8.0 | … |
| 140331A | 21.2 | 91 | UL | Y | … | 1.09 | 0.18 | 0.18 | … | … |
| 140419A | 8.8 | 97 | M | Y | 3.95615 | 1.05 | 0.610.01 | 0.580.01 | 11.2 | … |
| 140518A | 36.3 | 43 | M | Y | 4.70716 | 0.94 | 0.340.11 | 0.220.10 | 0.0 | … |
| 140614B | 6.5 | 43 | UL | Y | … | 0.46 | 2.41 | 2.05 | … | … |
| 140622A | 1.3 | 64 | UL | Y | 0.95917 | 1.60 | 1.55 | 1.51 | 0.0 | s |
| 140703A | 584.2 | 43 | M | Y | 3.1418 | 0.98 | 0.701.16 | 0.611.12 | 11.6 | … |
| 140709A | 165.8 | 299 | D | Y | … | 1.09 | 0.110.03 | 0.100.03 | … | … |
| 140710A | 3.5 | 43 | D | Y | 0.55819 | 0.92 | 0.340.07 | 0.350.06 | 0.0 | … |
References: 1Cucchiara & Fumagalli (2013), 2de Ugarte Postigo et al. (2013), 3de Ugarte Postigo et al. (2013), 4Perley et al. (2014), 5Schmidl et al. (2013), 6Chornock et al. (2013), 7Smette et al. (2013), 8Xu et al. (2013), 9 de Ugarte Postigo et al. (2013), 10Vreeswijk et al. (2013), 11Chornock et al. (2013), 12Xu et al. (2013), 13Chornock et al. (2014), 14Tanvir et al. (2014), 15Tanvir et al. (2014), 16Chornock et al. (2014), 17Hartoog et al. (2014), 18Castro-Tirado et al. (2014) and 19Tanvir et al. (2014).
3.1 Identifying dark GRBs
Two criteria for dark GRBs are traditionally used. The first is based solely on the X-ray to optical spectral index, . Jakobsson et al. (2004) proposed that a dark burst could be classified as one where . Following this, van der Horst et al. (2009) used a large sample of 41 GRBs from Gehrels et al. (2008) to suggest that any optical darkness criterion placed on should also account for the X-ray spectral index, . In this alternative scenario, a dark GRB is one that meets the condition that .
The latter criterion, as proposed by van der Horst et al. (2009) is motivated by a specific theory of GRB emission. As both internal and external shocks are expected to emit via synchrotron radiation (Granot & Sari, 2002; Zhang & Mészáros, 2004), there are two expected scenarios for the nature of a GRB SED between the optical and X-ray regimes during late afterglow observations. The first is that the optical emission is on the same power-law segment of the synchrotron SED as the X-rays. In this case, , giving an expected upper bound to . Alternatively, the cooling break, , an expected feature of synchrotron emission, may be present between the two regimes. Such a spectral break is characterised by a steepening of power-law slope in the SED above the break frequency by . is an average spectral index over the intervening range, however the largest value can adopt is just below the measured X-ray regime. As such, therefore has a lower limit of , which leads to the condition for optical darkness discussed in van der Horst et al. (2009).
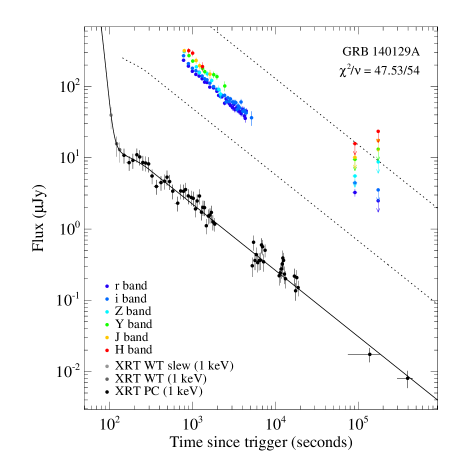
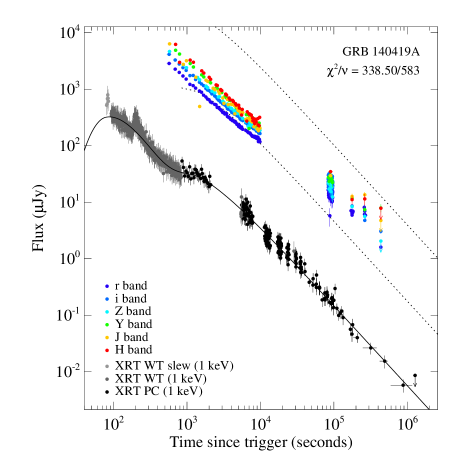
In Figure 1 we show flux density light curves obtained from both Swift/XRT and RATIR for two bursts within our sample. The grey scale points are the X-ray data, while the colour points denote RATIR data, both being described in the key of the figures. The dotted lines show the bounds in which the r band flux is expected. To calculate these limits we extrapolated the X-ray flux assuming either or . The former condition corresponds to the optical regime lying on the same power-law segment as the X-ray, whilst the latter assumes a cooling break at 0.3 keV. This second condition predicts the minimum flux from the intrinsic synchrotron spectrum assuming there is no attenuation in the optical band.
To estimate the optical darkness, we take a measure of optical and X-ray flux at 11 hours (De Pasquale et al., 2003; Jakobsson et al., 2004; van der Horst et al., 2009; Greiner et al., 2011). At such a time the emission is expected to be in an external shock dominated phase of the afterglow (Piran et al., 2001; Berger et al., 2003; Butler & Kocevski, 2007b), with the prompt emission and later X-ray flaring having ended and the afterglow remaining significantly brighter than any host galaxy.
Half of our rapidly observed sample (14/28) had sufficient data to allow for the modelling of the optical light curves with either a power-law or broken power-law. In these instances, we interpolate the optical flux, , at 11 hours from the fitted model. For those other GRBs with few single detections or upper limits, we take the average temporal power-law decay index from those modelled in our sample and extrapolate from the available data to our fiducial time of 11 hours after the initial high-energy trigger to calculate . Butler & Kocevski (2007b) investigated the hardness evolution of GRB X-ray afterglows to understand when the internal and external shocks mechanisms dominate the observed emission. In that work, it was found that X-ray afterglows were well modelled by synchrotron external shock emission at times greater than s ( 5.5 hours) after the initial trigger time. With this in mind we also estimated the optical and X-ray fluxes for each GRB in our sample at 5.5 hours. This allows us to consider the time evolution of (e.g.; Melandri et al. 2012).
There are seven GRBs for which there are only upper limits in the RATIR r band observations. As such it is only possible to determine upper limits in for these GRBs, once extrapolating the optical upper limit to the fiducial time. While we use the mean fitted RATIR value of temporal decay index to evolve the upper limit to constrain the optical flux at this time, there is an inherent uncertainty in this process. Three of these limits require an optically dark GRB event. The remaining three (GRB 131004A, GRB 140614B and GRB 140622A) do not allow us to classify the bursts as dark, however, the calculated upper limits in do not preclude optical brightness.
In Table 2 we show the full sample of GRBs with RATIR observations beginning within 10 hours of the initial high-energy trigger. In this table we indicate whether the optical RATIR light curve data were sufficient to enable modelling with a power-law or broken power-law. We also present whether Swift/XRT data were available, reported redshifts and, where measurable, the calculated value of at both 11 and 5.5 hours. The reported X-ray derived column densities in the rest frame, , are determined by an automated pipeline444http://butler.lab.asu.edu/swift which is described in detail in Butler & Kocevski (2007a). Each Swift/XRT photon counting (PC) mode spectrum is fitted with a power-law spectrum and two absorption components, corresponding to a Galactic (Kalberla et al., 2005) and extragalactic column. We assume solar metallicities according to the abundances from Anders & Grevesse (1989), we utilise the photoelectric cross-section of Balucinska-Church & McCammon (1992) and the He cross-section based on Yan et al. (1998).
We note a large value of error in for GRB 130612A. This is due to a large uncertainty in as calculated from the fitted light curve at 5.5 and 11 hours after the Swift/BAT trigger. Fundamentally this is a result of large error bars in the X-ray flux density light curve once converted to a flux at 1 keV, which results in greater uncertainty in the fit parameters used to derive . GRB 130504A was detected by RATIR, but was not observed in the r band, and so was not calculated.
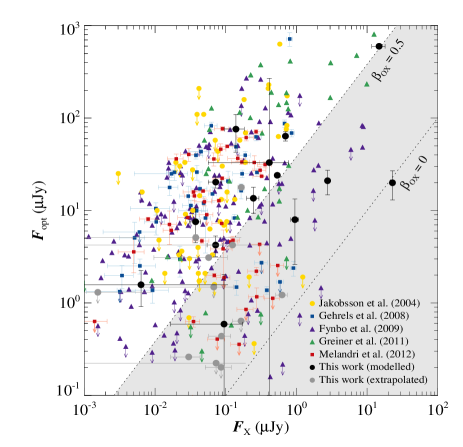
In Figure 2, we show the optical flux, , as a function of X-ray flux, , at the fiducial time of 11 hours after the initial Swift/BAT trigger. Those bursts with fully modelled optical light curves are plotted with black points and error bars. Those with few data extrapolated to the fiducial time are plotted in grey. Also plotted on Figure 2 are lines denoting and . Any GRB in the grey region of the parameter space below and to the right of is considered to be a dark GRB by the condition of Jakobsson et al. (2004).
As well as the RATIR sample, we plot the data from several samples available from the literature (Jakobsson et al., 2004; Gehrels et al., 2008; Fynbo et al., 2009; Greiner et al., 2011; Melandri et al., 2012). Of the five samples shown with ours, that of Greiner et al. (2011) has the most similar selection criteria to ours. In this work GRBs detected by the Gamma-Ray burst Optical/Near-infrared Detector (GROND; Greiner et al. 2008), a seven channel optical and NIR imager, within four hours of the high-energy trigger are included. Also, we note that the sample of Gehrels et al. (2008) is that with which van der Horst et al. (2009) define their optical darkness criterion. Fynbo et al. (2009) define their measurements of optical darkness at earlier epochs than the 11 hour fiducial time selected in this work. We also show results from the BAT6 sample (Salvaterra et al., 2012), taken from Melandri et al. (2012). GRBs in this sample are selected contingent on being bright enough in the hard X-ray regime (15–350 keV), as measured by the Swift/BAT, to be detected if they were six times fainter.
From Figure 2 it can be seen that the majority of optically dark bursts are generally also at the faint end of the total distribution of optical fluxes at 11 hours. There is also a hint of a bifurcation in the population separated by , which would be the expected split in the distribution between those GRBs with or without a cooling break between the optical and X-ray regimes at 11 hours.
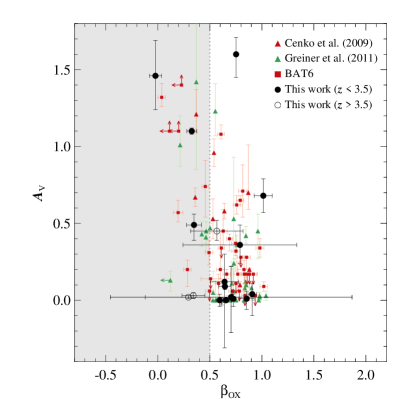
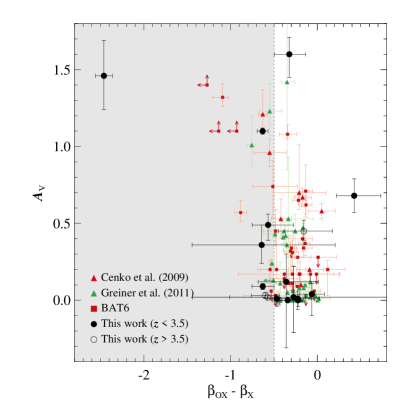
In Figure 3 we plot as a function of , again for our sample and for those values available from the literature (Jakobsson et al., 2004; Gehrels et al., 2008; Melandri et al., 2008; Cenko et al., 2009; Fynbo et al., 2009; Melandri et al., 2012). The majority of bursts in our sample with well fitted optical and X-ray light curves populate the same region of parameter space as those analysed in previous samples. The two dashed lines on the panel denote the range in which GRBs well described in both the optical and X-ray regimes purely by synchrotron emission should inhabit. We find only one GRB with a detected optical flux suggesting that , GRB 130418A. This burst has one of the softest measured X-ray spectral indices, and is discussed in further detail in § 3.3. GRB 140614B and GRB 140622A both have optical upper limits that correspond to upper limits in , which do not preclude this possibility. The position of GRB 140622A lies approximately 40′′ from the 12th magnitude star TYC 5783-1382-1, meaning that the photometry for GRB 140622A could suffer from contamination from this bright object.
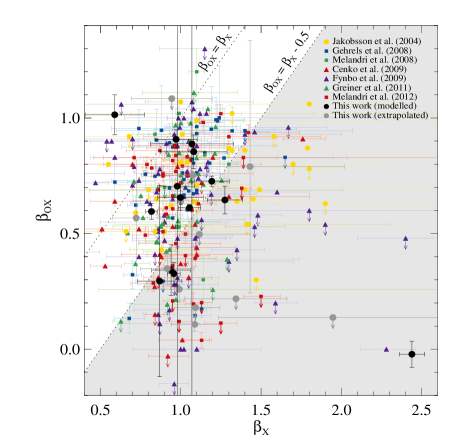
Figure 3 shows that the majority of GRBs in the RATIR sample inhabit regions of the parameter space also well populated by other samples. We find 399 per cent (11/28) of GRBs in our sample are identified as optically dark using the Jakobsson et al. (2004) criterion, whilst 469 per cent (13/28) are dark as defined by van der Horst et al. (2009). All GRBs identified as dark by the Jakobsson et al. (2004) criterion are also identified by that of van der Horst et al. (2009). GRB 130420A and GRB 140318A qualify as optically dark when accounting for the value of . Both and are reported in Table 2.
We adopt the van der Horst et al. (2009) definition of optical darkness. As such, we find that 469 per cent (13/28) of the rapidly observed RATIR GRB sample are optically dark (GRB 130420A, GRB 130502A, GRB 130514A, GRB 130606A, GRB 130609A, GRB 130907A, GRB 130925A, GRB 140114A, GRB 140318A, GRB 140331A, GRB 140518A, GRB 140709A & GRB 140710A). This selection remains identical when considering as calculated at either 11 or 5.5 hours. Comparing the values calculated at both epochs reveals only four GRBs that have that are inconsistent at the 1 level (GRB 130701A, GRB 130907A, GRB 130925A & GRB 140419A). In each case, there is a small increase in , indicating that the optical flux becomes slightly less attenuated with time. This is somewhat expected, as the average optical decay power-law index is shallower than that of the X-ray afterglows.
This fraction of optically dark GRBs is comparable to previous studies such as Greiner et al. (2011) and Fynbo et al. (2009) who find the dark fraction of bursts in their samples to be 25– 40 per cent and 25–42 per cent, respectively. Cenko et al. (2009) and Melandri et al. (2008) both estimate a dark burst fraction of 50 per cent, although it must be noted that these studies use the Jakobsson et al. (2004) definition of optical darkness. Most recently, work on the gamma-ray selected BAT6 sample suggests the dark fraction in their sample is also 25–35 per cent (Melandri et al., 2012).
If we restrict our sample to only long GRBs (s; Kouveliotou et al. 1993), this fraction increases to 5010 per cent (13/26). Those bursts identified as short GRBs have their reported values as measured by the Swift/BAT in the 15–350 keV range in Table 2. The two short GRBs with estimates of (GRB 131004A & GRB 140622A) have optical upper limits that do not provide rigorous constraints on .
Typically, GRBs with spectroscopic redshifts also have RATIR r band detections. The two exceptions to this are GRB 131004A and GRB 140622A, both of which are short GRBs. To measure a spectroscopic redshift requires a GRB to remain bright for the typical response time of large spectrograph facilities, thus increasing the likelihood of a RATIR optical detection. By limiting our sample only based on the condition of rapid RATIR observation we have presented a homogeneous sample, which limits any brightness bias introduced by requiring a spectroscopic redshift. Considering only those GRBs with a sufficient optical data to allow light curve modelling and a spectroscopic redshift, we find 5515 per cent (6/11) are optically dark, which is consistent with the full sample. Interestingly, we find that GRB 140311A is not classified as optically dark, despite having a spectroscopic redshift of (Chornock et al., 2014). This is discussed further in § 3.2.
To statistically assess the similarity between the RATIR and previous distributions of and the dark burst fractions, we performed Kolmogorov-Smirnov (K-S) tests. This tests two samples of data under the null hypothesis that the two derive from the same parent population with significant low probabilities indicating this null hypothesis to be inaccurate. A K-S test compares the cumulative distribution functions (CDFs) of the two samples, measuring the maximum distance between the two CDFs, , which is the K-S statistic. Larger values of are indicative of the CDFs have a larger maximum separation. Performing this K-S test yields a probability , indicating that the two populations are not significantly different. Results from these K-S tests are shown in Table 5, which also details similar statistical comparisons between parameters calculated from RATIR SED fitting. From these results, we can see that the distributions of redshift, and for our sample are not statistically significantly different from any other individual sample. We also compiled a total sample of all previous literature, taking care to only include each GRB once if present in multiple samples, finding once more that our distributions of redshift, and are consistent with the largest possible sample of previous literature values.
3.2 RATIR SED fitting
In order to understand why GRBs within the RATIR-Swift/XRT sample might appear under-luminous in the optical regime, we fitted the RATIR optical and NIR SEDs. We did so for all of the bursts listed in Table 2 that had photometry in a minimum of four filters, with a minimum of three detections. This allowed us to model 19 GRBs.
The expected shape of an optical and NIR GRB SED is a power-law with potential perturbations from either absorption from the intergalactic medium (IGM) or dust within the host galaxy of the burst. To maximise signal-to-noise ratio, we therefore used SEDs obtained when coadding all observations made during the first night of observations. The RATIR photometry obtained during the first night of observations for those bursts in Table 2 is shown in Table 3.
| GRB | r | i | Z | Y | J | H |
|---|---|---|---|---|---|---|
| 130215A | 17.470.06 | 17.220.05 | 16.940.06 | 16.800.14 | 16.720.06 | … |
| 130327A | 21.010.10 | 20.660.09 | 20.200.12 | 20.020.15 | 19.890.18 | 20.560.41 |
| 130418A | 19.020.01 | 18.770.01 | 18.490.02 | 18.280.02 | 18.170.02 | 17.730.02 |
| 130420A | 19.760.02 | 19.560.02 | 19.390.05 | 19.100.09 | 19.040.06 | 18.810.12 |
| 130427A | … | 13.880.04 | 13.780.04 | 13.670.04 | 13.690.04 | 13.730.04 |
| 130502A | 22.43 | 23.04 | 22.11 | 21.35 | 21.04 | 20.64 |
| 130504A | … | … | 22.59 | … | 20.49 | … |
| 130514A | 23.17 | 22.87 | 22.46 | 21.89 | 21.67 | 21.22 |
| 130606A | 24.490.34 | 21.830.28 | 19.320.04 | 19.060.03 | 18.970.03 | 18.580.03 |
| 130609A | 23.65 | 23.37 | 22.54 | 21.88 | 21.54 | 21.07 |
| 130610A | 20.480.09 | 21.010.18 | 20.240.13 | 20.610.17 | … | 15.99 |
| 130612A | 22.410.08 | 22.050.08 | … | … | … | … |
| 130701A | 19.610.50 | 20.451.08 | 19.910.09 | 19.360.11 | … | … |
| 130907A | 20.010.03 | 19.310.02 | 18.820.05 | 18.450.06 | 18.160.06 | 17.620.06 |
| 130925A | 20.920.17 | 21.310.18 | 20.670.11 | 20.800.17 | 20.020.09 | 19.740.11 |
| 131004A | 23.90 | 23.37 | 22.61 | 21.97 | 21.73 | 21.22 |
| 131030A | 19.150.05 | 18.920.04 | 18.770.04 | 18.550.04 | 18.620.04 | 18.370.04 |
| 140114A | 21.810.10 | 21.240.07 | … | … | … | … |
| 140129A | 19.110.02 | 18.980.02 | 18.870.05 | 18.690.04 | 18.800.06 | 18.570.07 |
| 140215A | 17.920.28 | 17.560.21 | 17.240.16 | 16.990.13 | 16.800.12 | 16.550.09 |
| 140311A | 22.340.13 | 21.570.08 | 20.590.08 | 20.070.08 | … | … |
| 140318A | 21.940.18 | 21.480.14 | 20.830.16 | 20.800.21 | 20.910.21 | 20.250.13 |
| 140331A | 23.65 | 23.49 | 22.34 | 21.80 | 21.59 | 21.00 |
| 140419A | 17.650.17 | 17.300.12 | 16.910.09 | 16.760.08 | 17.190.11 | 16.570.07 |
| 140518A | 20.520.32 | 19.000.08 | 18.600.06 | 18.200.05 | 18.120.04 | 17.800.03 |
| 140614B | 22.71 | 22.56 | 21.66 | 21.09 | 21.05 | 20.52 |
| 140622A | 23.58 | 23.43 | 19.31 | 19.75 | … | … |
| 140703A | 20.320.04 | 19.720.03 | 18.530.05 | 18.310.05 | 19.600.17 | 19.980.09 |
| 140709A | 24.10 | 23.70 | 22.92 | 22.41 | 22.31 | 21.94 |
| 140710A | 21.350.08 | 21.090.07 | 20.760.14 | 20.410.16 | 20.290.14 | 19.740.13 |
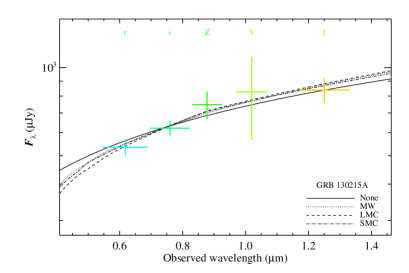
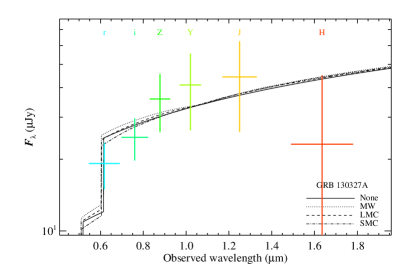
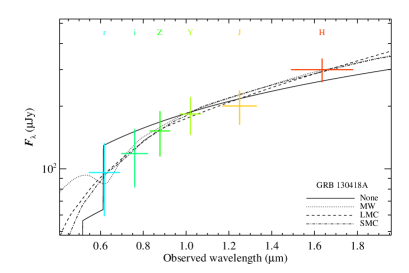
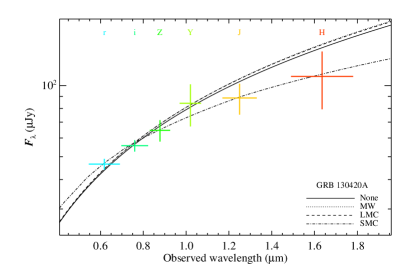
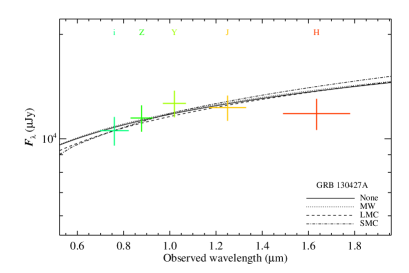
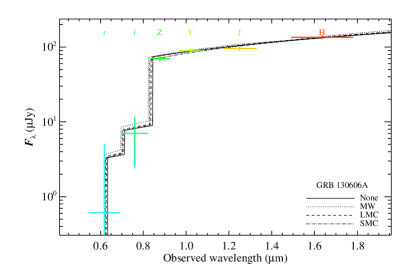
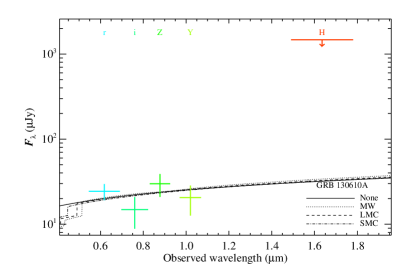
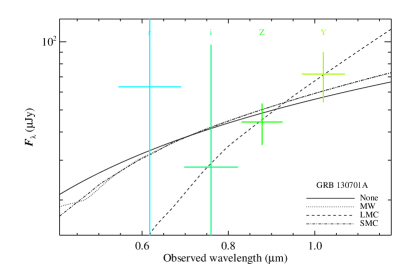
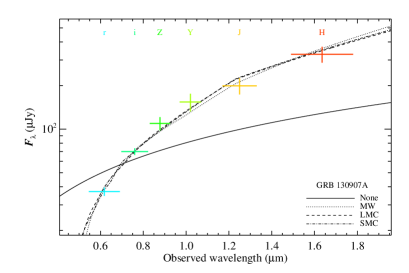
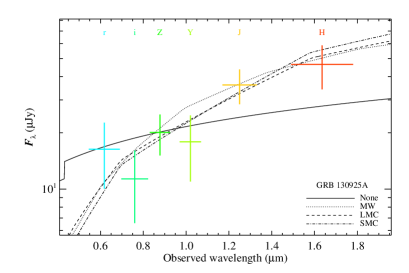
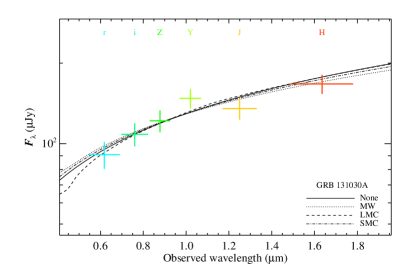
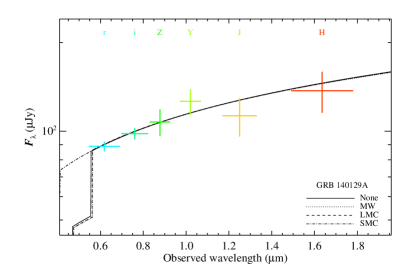
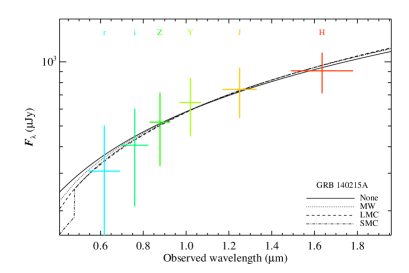
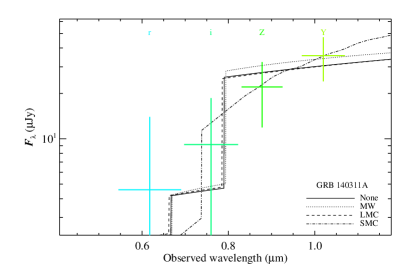
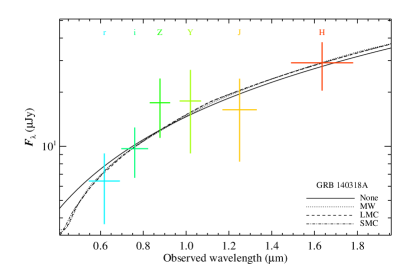
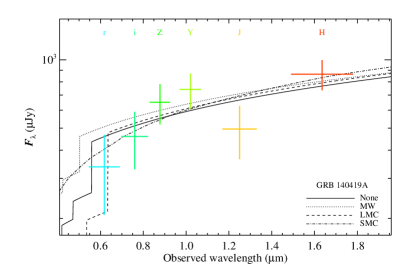
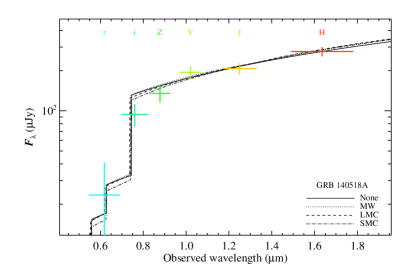
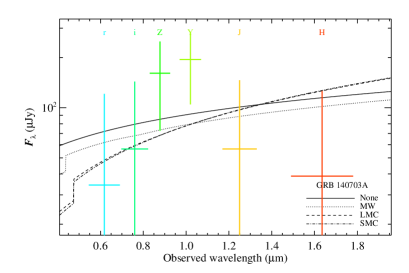
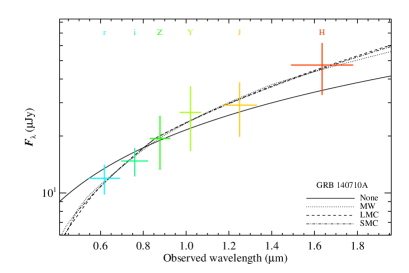
We used the SED template-fitting routine outlined in Littlejohns et al. (2014) to estimate the amount of host galaxy dust extinction. This algorithm accounts for the intrinsic GRB spectrum, Galactic dust extinction, the absorption from the IGM due to the redshift of the host galaxy and the dust absorption from the host galaxy along the GRB sight line by fitting the optical spectral index, , redshift, , and dust extinction . As the exact nature of the dust extinction law is not known, we apply templates of Milky Way (MW), Large Magellanic Cloud (LMC) and Small Magellanic Cloud (SMC) dust extinction laws (Pei, 1992), allowing the algorithm to choose between the model that best describes any dust present in the SED. While we note that these three templates are likely not accurate representations of all galaxies at all redshifts, they do allow for the best comparisons with other studies.
For GRBs with a measured redshift we fixed in our fitting algorithm to the value reported in Table 2. The SEDs with the resulting fitted models are shown in Figures 4, 5 and 6. The values of obtained from each of the three template dust laws are reported in Table 4, along with the fit statistic and degrees of freedom associated with these models. In each instance, the preferred dust model is quoted. We report two measures of for each fitted model, the first is the traditional value, which is a measure of goodness of fit. The second, , is the prior weighted fit statistic as described in Littlejohns et al. (2014). This value also includes an additional Bayesian prior that compares the local optical and NIR spectral index, , to that measured in the X-ray regime, . Assuming a synchrotron emission mechanism, we expect the optical SED to have either the same intrinsic spectral index as measured with in the X-ray spectrum, or to have a cooling break between the two regimes. If a cooling break is present between the optical and X-ray regimes, the spectral index changes by a well defined amount, dependent on the nature of the circumburst medium (Granot & Sari, 2002).
In the three instances where a previous spectroscopic measure of redshift was not available from another facility (GRB 130327A, GRB 140129A and GRB 140215A), the redshift was left as a free parameter using the Littlejohns et al. (2014) algorithm. For all three cases we were only able to provide upper limits on the photometric redshift, that .
| GRB | Preferred | |||||||||
|---|---|---|---|---|---|---|---|---|---|---|
| Model | ||||||||||
| 130215A | LMC | 0.19 | 0.65/2 | 0.57/2 | 0.27 | 0.61/2 | 0.74/2 | 0.21 | 0.59/2 | 0.73/2 |
| 130327A | MW | 0.12 | 2.52/2 | 1.26/2 | 0.20 | 2.54/2 | 2.20/2 | 0.01 | 2.78/2 | 1.45/2 |
| 130418A | LMC | 0.37 | 0.48/3 | 0.84/3 | 0.68 | 0.32/3 | 1.00/3 | 0.28 | 0.58/3 | 0.72/3 |
| 130420A | SMC | 0.00 | 4.74/3 | 4.89/3 | 0.00 | 4.51/3 | 4.89/3 | 0.09 | 0.50/3 | 0.49/3 |
| 130427A | MW | 0.00 | 3.15/2 | 3.23/2 | 0.03 | 3.40/2 | 3.40/2 | 0.07 | 4.15/2 | 4.16/2 |
| 130606A | LMC | 0.05 | 2.51/3 | 2.60/3 | 0.02 | 2.19/3 | 2.22/3 | 0.03 | 2.25/3 | 2.28/3 |
| 130610A | SMC | 0.04 | 3.27/2 | 2.09/2 | 0.01 | 3.07/2 | 1.84/2 | 0.01 | 3.05/3 | 1.80/2 |
| 130701A | LMC | 0.15 | 1.08/1 | 1.10/1 | 1.60 | 0.54/1 | 0.50/1 | 0.15 | 1.08/1 | 1.08/1 |
| 130907A | SMC | 1.07 | 5.49/3 | 3.58/3 | 1.10 | 3.10/3 | 3.15/3 | 1.10 | 3.00/3 | 3.00/3 |
| 130925A | MW | 1.46 | 2.10/3 | 2.10/3 | 1.32 | 2.67/3 | 2.70/3 | 1.47 | 2.77/3 | 2.77/3 |
| 131030A | MW | 0.01 | 3.41/3 | 3.40/3 | 0.17 | 3.86/3 | 3.79/3 | 0.00 | 3.50/3 | 3.62/3 |
| 140129A | LMC | 0.00 | 1.76/2 | 0.38/2 | 0.00 | 1.76/2 | 0.38/2 | 0.00 | 1.77/2 | 0.39/2 |
| 140215A | SMC | 0.05 | 0.19/2 | 0.19/2 | 0.11 | 0.18/2 | 0.20/2 | 0.04 | 0.17/2 | 0.18/2 |
| 140311A | SMC | 0.07 | 0.50/1 | 0.20/1 | 0.01 | 0.56/1 | 0.06/1 | 0.45 | 0.17/1 | 0.33/1 |
| 140318A | LMC | 0.31 | 1.22/3 | 0.03/3 | 0.36 | 1.20/3 | 0.09/3 | 0.32 | 1.20/3 | 0.06/3 |
| 140419A | LMC | 0.00 | 5.65/3 | 5.37/3 | 0.00 | 4.12/3 | 3.03/3 | 0.11 | 4.42/3 | 3.33/3 |
| 140518A | MW | 0.03 | 1.51/3 | 1.52/3 | 0.04 | 1.55/3 | 1.55/3 | 0.04 | 1.54/3 | 1.72/3 |
| 140703A | MW | 0.02 | 3.39/3 | 2.02/3 | 0.01 | 3.95/3 | 4.01/3 | 0.02 | 3.97/3 | 4.04/3 |
| 140710A | MW | 0.49 | 0.47/3 | 0.24/3 | 0.60 | 0.44/3 | 0.31/3 | 0.56 | 0.42/3 | 0.30/3 |
| Average | SMC | 0.23 | 44.09/47 | 32.73/47 | 0.36 | 40.57/47 | 32.40/47 | 0.26 | 37.91/47 | 28.77/47 |
Of the 13 bursts identified as dark using the van der Horst et al. (2009) criterion, we were able to model the SED of seven. This yielded two GRBs of high redshift (; GRB 130606A & GRB 140518A), two with a high quantity of dust extinction (; GRB 130907A & GRB 130925A) and 2 with a moderate quantity of dust extinction (; GRB 140318A & GRB 140710A). Curiously, whilst dark, GRB 130420A has both a low redshift () and a low amount of modelled dust extinction ().
We considered two alternative scenarios to explain the modelled optical attenuation of GRB 130420A. First, we looked at the van der Horst et al. (2009) condition of optical darkness, for which GRB 130420A has . A value of would indicate a GRB with a cooling break immediately below the measured X-ray spectrum, and therefore consistent with an intrinsic synchrotron spectrum with no optical attenuation. Such a scenario is at the upper limit of the error bounds of for GRB 130420A. An alternative explanation can be considered by looking at the SED of GRB 130420A shown in Figure 4. This reveals a large error in the H band flux measurement. It is this filter that is least well represented by the MW and LMC dust profile templates, as the large error weights the fitted templates away from the H band. It is possible that this value is accurate, while not precise. As such if the errors were smaller the template would be constrained into a shallower local spectral index, and therefore would require a larger value of to produce the lower fluxes in the r, i and Z bands.
Six optically dark GRBs do not have sufficient photometry for SED modelling (GRB 130502A, GRB 130514A, GRB 130609A, GRB 140114A, GRB 140331A & GRB 140710A). GRB 130514A has a photometric redshift from the GROND instrument of , suggesting this may contribute to the under-luminous nature of the r band, however RATIR did not detect the GRB in any of the six filters in which it was observed. GRB 140331A has a measured redshift of , ruling it out as a high-redshift event. The remaining four GRBs do not have a measured redshift.
GRB 140311A has a measured spectroscopic redshift of (Chornock et al., 2014), at which it is expected that optical attenuation should be observed in the r band. Despite this, GRB 140311A is not classified as optical dark using either the van der Horst et al. (2009) or Jakobsson et al. (2004) criteria. The measured X-ray spectral index for this GRB was , while the best fit template obtained from the Littlejohns et al. (2014) SED fitting routine found the local optical and NIR spectral index . As such it is possible that the optical and X-ray regimes both lie on the same power-law segment of the intrinsic GRB synchrotron spectrum. If this is the case, then the attenuation from high redshift does not reduce the optical flux to a level below the minimum allowable flux resulting from the presence of a cooling break between the two regimes. Unfortunately, GRB 140311A was only observed in the four bluest RATIR filters, thus giving only a loose constraint on .
The normalised cumulative distribution of fitted values of for the 19 GRBs in Table 4 are shown in Figure 7, along with those of an extensive selection of previous samples from the literature. We also display the total distribution of all previous literature, with and without the RATIR sample. Care has been taken to ensure GRBs that occur in multiple samples are only included once in the total literature sample. From Figure 7 it can be seen that our sample, denoted by the red line, appears consistent with most of the previous samples. The one distribution that appears discrepant is that presented in Covino et al. (2013), which is the BAT6 sample.
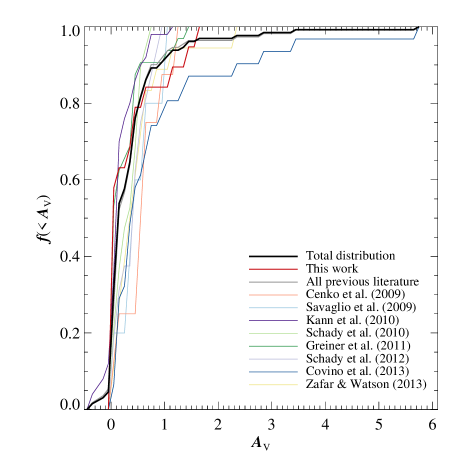
Greiner et al. (2011) found 25 per cent of bursts with (8/33). In our sample, this fraction is lower, at 117 per cent (2/19), which is similar to Kann et al. (2010) who found approximately 12 per cent. It is important to note, however, that the fundamental properties of our GRB sample are more similar to those of Greiner et al. (2011), as the sample of Kann et al. (2010) is biased towards optically brighter bursts. In another study, Covino et al. (2013) find in a sample of 53 GRBs that 50 per cent have an extinction of , whereas our sample has a marginally higher fraction of 6311 per cent (12/19).
Those GRBs with values of inconsistent with zero are best fitted by a variety of dust laws. 27 per cent (3/11) favour a MW dust extinction law, with 45 per cent (5/11) favouring an LMC dust law and 27 per cent (3/11) being best fit by an SMC dust law. Conversely, Schady et al. (2010) find that an SMC extinction curve to be preferred in 56 per cent of their sample. In the bottom row of Table 4 we calculate the average required amount of dust if the same model was to be assumed for the entire population. We also sum the for all these models to compare which model provides the best global fit across the entire population should the fitting be limited to one dust extinction law. Due to the few instances where an SMC dust extinction model has a markedly better , while in cases where it is not the preferred model host galaxy tends to be low and so is much lower, an SMC dust extinction law proves to be the best when fitting to the entire sample. This is more consistent with the findings of Schady et al. (2010).
From the distribution of best fitted values plotted in 7, we find 168 per cent (3/19) of GRBs with a fitted SED have host dust extinction , which agrees with Greiner et al. (2011). 25 per cent (2/8) of the GRBs with favour a MW dust profile, which has a prominent feature at 2175 Å. Greiner et al. (2011) find a suggestion that GRBs with a larger dust content may favour a MW type dust profile. We instead find that 50 per cent (4/8) favour an LMC type dust extinction law. It must be noted that our sample lacks a large number of high extinction GRBs, and this discrepancy may be due to small number statistics.
To compare the distributions of obtained host , we once more employed K-S tests between our sample and an extensive list of previous samples. These are shown in Table 5. Comparing our distribution of host galaxy to these studies shows only one result that is statistically significantly different. Comparing our work to that of Covino et al. (2013) we find the two samples to be different at a level of approximately 3. For completeness we also compared the results of Covino et al. (2013) to those in Kann et al. (2010) and Greiner et al. (2011), as well as a composite sample of all other existing literature , finding the BAT6 distribution of host galaxy values to significantly differ from all three.
Looking at Figure 7 the main cause of difference between these samples arises from a handful of extremely high values in the BAT6 sample. The highest of these, for GRB 070306, is . As shown in Table A10 of Covino et al. (2013), however, the fit used to derive this value of dust extinction has zero degrees of freedom, which could perhaps lead to the very high value obtained. It must be noted, however, that there are also several instances where could not be constrained in the BAT6 sample, due to a lack of photometric detections in a sufficient number of optical and NIR bands, however lower limits could be derived that are indicative of high . In these cases, as the redshift is also known for the GRB, high-redshift is precluded, thus requiring higher dust content in the host galaxy. As the BAT6 sample membership is defined by gamma-ray fluence, rather than optical or NIR brightness, it is perhaps expected that it might contain a larger number of highly dust extincted GRBs.
| Sample 1 | Sample 2 | Parameter | ||||
| This work | Literature | 16 | 156 | 0.20 | 6.22 | |
| This work | Fynbo et al. (2009) | 16 | 85 | 0.28 | 2.02 | |
| This work | BAT6 | 16 | 52 | 0.32 | 1.37 | |
| This work | Kann et al. (2010) | 16 | 46 | 0.26 | 3.54 | |
| This work | Greiner et al. (2011) | 16 | 33 | 0.23 | 5.65 | |
| This work | Schady et al. (2010) | 16 | 26 | 0.29 | 3.05 | |
| This work | Zafar & Watson (2013) | 16 | 25 | 0.52 | 5.65 | |
| This work | Cenko et al. (2009) | 16 | 16 | 0.25 | 3.05 | |
| This work | Schady et al. (2012) | 16 | 16 | 0.38 | 1.62 | |
| This work | Savaglio et al. (2009) | 16 | 10 | 0.88 | 4.45 | |
| BAT6 | Literature | 52 | 116 | 0.20 | 9.24 | |
| This work | Literature | 28 | 228 | 0.11 | 9.32 | |
| This work | Fynbo et al. (2009) | 28 | 137 | 0.12 | 8.60 | |
| This work | BAT6 | 28 | 44 | 0.12 | 9.54 | |
| This work | van der Horst et al. (2009) | 28 | 40 | 0.16 | 7.51 | |
| This work | Jakobsson et al. (2004) | 28 | 37 | 0.32 | 6.44 | |
| This work | Greiner et al. (2011) | 28 | 34 | 0.15 | 8.55 | |
| This work | Cenko et al. (2009) | 28 | 28 | 0.14 | 9.17 | |
| This work | Melandri et al. (2008) | 28 | 22 | 0.16 | 8.87 | |
| This work | Galama & Wijers (2001) | 28 | 5 | 0.36 | 5.48 | |
| BAT6 | Literature | 44 | 184 | 0.14 | 4.99 | |
| This work | Literature | 21 | 167 | 0.27 | 1.05 | |
| This work | Fynbo et al. (2009) | 21 | 86 | 0.30 | 7.95 | |
| This work | van der Horst et al. (2009) | 21 | 36 | 0.43 | 1.12 | |
| This work | BAT6 | 21 | 35 | 0.26 | 3.03 | |
| This work | Greiner et al. (2011) | 21 | 34 | 0.30 | 1.48 | |
| This work | Jakobsson et al. (2004) | 21 | 25 | 0.36 | 8.46 | |
| This work | Cenko et al. (2009) | 21 | 21 | 0.24 | 5.31 | |
| This work | Melandri et al. (2008) | 21 | 9 | 0.37 | 2.96 | |
| BAT6 | Literature | 35 | 134 | 0.12 | 8.07 | |
| This work | Literature | 19 | 111 | 0.35 | 3.07 | |
| This work | Kann et al. (2010) | 19 | 50 | 0.29 | 1.74 | |
| This work | Greiner et al. (2011) | 19 | 32 | 0.15 | 9.27 | |
| This work | BAT6 | 19 | 31 | 0.54 | 1.29 | |
| This work | Schady et al. (2010) | 19 | 19 | 0.47 | 1.81 | |
| This work | Zafar & Watson (2013) | 19 | 18 | 0.53 | 6.96 | |
| This work | Schady et al. (2012) | 19 | 16 | 0.46 | 3.16 | |
| This work | Cenko et al. (2009) | 19 | 8 | 0.58 | 2.66 | |
| This work | Savaglio et al. (2009) | 19 | 5 | 0.48 | 2.22 | |
| BAT6 | Literature | 31 | 87 | 0.42 | 3.79 | |
| BAT6 | Kann et al. (2010) | 31 | 50 | 0.52 | 2.78 | |
| BAT6 | Greiner et al. (2011) | 31 | 32 | 0.53 | 1.57 | |
| This work | Literature | 13 | 95 | 0.26 | 3.68 | |
| This work | BAT6 | 13 | 52 | 0.25 | 4.73 | |
| This work | Greiner et al. (2011) | 13 | 32 | 0.30 | 3.15 | |
| This work | Schady et al. (2010) | 13 | 26 | 0.15 | 9.77 | |
| This work | Schady et al. (2012) | 13 | 16 | 0.26 | 6.72 | |
| BAT6 | Literature | 52 | 43 | 0.14 | 7.31 |
In Figure 8 we show the fitted values of as a function of the two metrics for optical darkness. In each case, optically dark bursts are in the grey parameter space to the left of the dotted vertical line.
Both measures of optical darkness reveal a trend where, typically, bursts that are optically dark have either high-redshift or modest to high levels of dust extinction in their host galaxy. There are two GRB that have large modelled value, but that aren’t consisent with being optically dark (GRB 130418A & GRB 130701A). Figure 4 reveals that the SED for GRB 130701A was only observed in four filters (r, i, Z and Y). Furthermore, the relative error in the optical data is large, with two possible types of solution. The first, with the smallest fit statistic, for an LMC type extinction law. Alternatively, the MW and SMC dust model templates prefer a lower quantity of dust in the host galaxy with in both cases. GRB 130701A was also found to be 5′′ of an magnitude source, meaning contaminating light from this nearby source may artificially enhance the reported brightness of GRB 130701A.
GRB 130418A has the softest measured X-ray spectrum in our sample, which also has a high reported measurement error. As discussed in § 3.3, it is possible that the true value of X-ray spectral index lies at the harder end of the 1 error bound and that the optical and X-ray regimes lie on the same power-law segment of the intrinsic GRB synchrotron spectrum. In such instances, a moderate amount of dust could reduce the measured optical flux by an amount less than invoking a cooling break at 0.3 keV. Thus it is possible for a GRB host galaxy to contain measurable amounts of dust while not being reported as optically dark.
The optically darkest burst is GRB 130925A. This burst was an unusual event as the prompt high-energy emission was long-lived, making it one of the few “ultra-long” GRBs observed to date (Evans et al., 2014). Several studies of this event have suggested that the central engine must occur in a low density environment (Evans et al., 2014; Piro et al., 2014), such that more emitted shells have chance to interact before being decelerated by the circumburst medium. The SED for GRB 130925A, as shown in Figure 5, implies a high dust content in the host galaxy. It is perhaps possible that whilst the immediate environment of the GRB central engine is low density and cleared by a strong stellar wind, outside of this the host galaxy has a high dust content.
We obtained X-ray defined measures of absorption from the GRB host galaxy in the form of the neutral hydrogen column density, (Watson et al., 2006; Watson et al., 2007; Campana et al., 2010; Watson, 2011), using the spectral fitting algorithms of Butler & Kocevski (2007a). The soft X-ray spectra are fitted with a power-law spectrum and two absorption components, corresponding to a Galactic and extragalactic column. In this pipeline solar abundances are assumed according to Anders & Grevesse (1989). Those bursts observed by RATIR within eight hours of the initial Swift trigger with a measured Swift/XRT spectrum have reported in Table 2. In total there are 15 GRBs with both a fitted value for and . Of these 15, eleven had a measurable excess above that from our own Galaxy. These eleven GRBs are plotted in Figure 9, once more with previous values obtained from samples in the literature. We have also compared our distribution of to those available from the literature, using further K-S tests, and find no significant differences, as shown in Table 5.
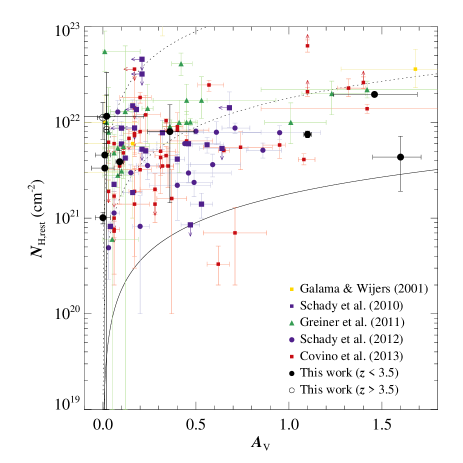
is a measure of the dust abundance of the GRB host galaxy along the sight line to the burst. , as measured from soft X-ray spectra, is a probe of the total metal content of the host galaxy along the same line of sight, regardless of the phase it exists in. Figure 9 confirms that the sight-line from the GRB central engine probes regions in the host galaxy with a higher metal-to-dust ratio than our Galaxy. This is in agreement with previous studies (Galama & Wijers, 2001; Greiner et al., 2011) and suggests that the host galaxies of GRBs are similar to molecular clouds, with less dust than our Galaxy. Galama & Wijers (2001) also consider a scenario in which the central engine of the GRB photoionizes dust in the circumburst medium. Such an effect, however, would only occur close to the GRB, depleting dust from a region of order a few tens of parsecs. This is much less than the distance of host galaxy through which the GRB emission must travel, and as such is less plausible than the host galaxy having a lower bulk dust content.
It must also be noted that we have assumed solar abundances in deriving . The curvature of the X-ray spectrum is strongly related to absorption by oxygen, and as such the derived depends inversely on the O/H ratio in the GRB host galaxy. As the metal content in GRB host galaxies is actually lower than that assumed (Savaglio et al., 2012; Campana et al., 2014; Cucchiara et al., 2014), for a given amount of X-ray absorption, a more realistic metal abundance would reduce the O/H ratio and hence increase , therefore increasing the inferred metal-to-dust ratio.
We also obtained estimates of neutral hydrogen column densities, , derived from optical spectroscopy as presented in Table 6. Previous studies have shown that optically derived are usually significantly lower that those estimates from X-ray spectra (Schady et al., 2012; Zafar & Watson, 2013). In contrast to X-ray derived , provides an estimate of the quantity of gas in the host galaxy. Using this, we can consider the gas-to-dust ratio of the four host galaxies for which measurements are available.
| GRB | Reference | |
|---|---|---|
| 130606A | 19.930.2 | (Chornock et al., 2013) |
| (Hartoog et al., 2014) | ||
| 140311A | 21.800.30 | (Cucchiara et al., 2014) |
| 140419A | 19.30.2 | (Cucchiara et al., 2014) |
| 140518A | 21.650.20 | (Cucchiara et al., 2014) |
The host for three of these GRBs is small, with GRB 140419A having , as shown in Table 4. However, GRB 140311A has a fitted . For GRB 130606A, GRB 140311A and GRB 140518A, we derive cm-2mag-1, cm-2mag-1, and cm-2mag-1, respectively. In comparison, for the LMC cm-2mag-1 and SMC cm-2mag-1 (Weingartner & Draine, 2001). This suggests that the gas-to-dust ratio for GRB 140518A is high in comparison to both the LMC and SMC, while that of GRB 130606A is most consistent with that of the LMC. GRB 140311A appears to be consistent with a gas-to-dust ratio similar to that of the SMC. These latter two results fit nicely with the preferred dust extinction templates, albeit with a very low quantity of dust for GRB 130606A. To reconcile the X-ray and optical values of requires either a much larger metal abundance, specifically oxygen, in the GRB host galaxy or for a large fraction of hydrogen gas in the host to be ionised. The latter is perhaps more plausible as the required oxygen abundance would have to be at least an order of magnitude higher. Watson et al. (2013) consider GRBs occurring within a star forming H ii region, attributing the X-ray absorption to a He-dominated absorber. In another study Watson et al. (2007) discuss the sample of Jakobsson et al. (2006), in which 17 GRBs with optical and X-ray measures of column density are compared. Watson et al. (2007) propose that the fundamental difference between absorption in the two regimes may result from the X-ray absorbing column density sampling the immediate environment of the GRB, which is substantially ionised by the burst. The H i column density may, however, probe an environment further from the GRB progenitor, and thus one that is little affected by the GRB.
3.3 Standardising
Greiner et al. (2011) and Melandri et al. (2012) observe time evolution in the recovered values of . With the morphology of optical and X-ray light curves not always being correlated, the temporal power-law index with which both regimes decay can differ. We find mean values of temporal decay index of and , which states that GRB light curves in our RATIR sample decay more slowly on average in the optical regime. As such, it is more likely that GRBs with measured at earlier times will be reported as optically dark. With bursts occurring at a broad range of redshifts, fixed observer frame times and wavelengths means that is not a standardised measure with regards to the intrinsic GRB emission. To solve this, a fiducial time fixed in the rest frame of the GRB can be taken, hours. With our sample having a redshift range of , corresponds to a range of observer frame times from 2 to 11 hours. At the lowest redshifts a time of 2 hours should allow for sampling of the afterglow at a time after the plateau phase. Conversely, choosing to be only slightly after the end of the plateau phase reduces any contamination of the host galaxy to the photometry of the GRB per se. At the highest redshift in the RATIR sample corresponds to approximately 10.5 hours in the observer frame.
To calculate a rest frame measure of optical darkness, , one should also define the energies at which the X-ray and optical fluxes are evaluated in the GRB rest frame, with keV and m, respectively. was chosen such that at the peak of the observed GRB redshift distribution (; Jakobsson et al. 2012), keV. This minimises the amount by which the X-ray fluxes must be, on average, extrapolated from the 1 keV light curves. m was chosen to avoid extrapolation beyond the H band.
The two expected mechanisms for optical darkness, as measured by , are high dust content in the host galaxy along the GRB sight line, or high redshift. By selecting a fixed rest frame wavelength in the ultraviolet regime, m, always corresponds to the observed optical (or indeed NIR) flux above the observed Lyman break, thus removing the effects of high-redshift from the measure. All bursts with , therefore, should result from significant quantity of dust in their host galaxy. It is also worth noting, however, that a rest frame wavelength of 0.25 m will not sample the 2175 Åbump observed in a MW type dust extinction law, although this feature only becomes visible to optical and NIR facilities at redshifts .
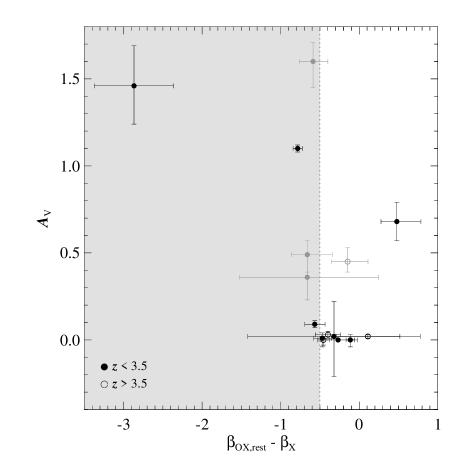
Looking at Figure 10, we see that all of the GRBs classified as optically dark in using do indeed have a detectable amount of dust in their host galaxy along the GRB sight line. We note, however, that our sample size is small, as only 15 GRBs met the observational criteria required to measure both and . It is perhaps surprising that a trend of increasing with increasing optical darkness (i.e. decreasing ) is not apparent, however, the most notable deviations from this trend are GRB 130418A, GRB 130701A and GRB 140311A.
The value of optical flux for GRB 130701A was extrapolated from a single detection assuming which may not best represent the actual GRB decay slope. Additionally, as noted in § 3.2, GRB 130701A may suffer from contamination in the optical and NIR regime from a nearby source. As such, this would artificially enhance the reported optical flux, and increase from its true value.
GRB 130418A has the softest measured X-ray spectrum in our sample (), thus increasing the value of , keeping the burst in the optically bright region of the parameter space in Figure 10, despite significant fitted dust content (). As measured in the observer frame, GRB 130418A has , which is typical of the expected value of . It is possible that the actual value of lies closer to the upper end of the error bound in the measured value. In addition to this, the optical and X-ray regimes could lie on the same segment of the intrinsic GRB synchrotron spectrum, thus leading to the burst remaining in the bright region of the parameter space.
GRB 140311A is the final burst with significant amounts of fitted dust, , that is within the optically bright region of Figure 10. As discussed in § 3.2, this GRB was only observed in four filters, giving poorer constraints on the template fitted to the SED. It is also possible that, like GRB 130418A, GRB 140311A has both the optical and X-ray regimes on the same power-law segment of the intrinsic GRB spectrum. As such, to be reported as optically dark, the amount of dust along the line of sight in the host galaxy would have to be sufficient to reduce the optical flux below the level predicted by having a cooling break just below the X-ray regime. Both GRB 130418A and GRB 140311A highlight the complicated role played by the cooling break in identifying optically attenuated GRBs. As a cooling break could occur anywhere between the optical and X-ray regimes, or indeed not at all, a simple linear relation of increasing with decreasing is unlikely to be observed. However, all GRBs denoted as dark in Figure 10 are successfully explained by either having a high redshift or moderate to high amounts of dust along the GRB line of sight in the host galaxy.
A further test of the results from Figure 10 would be to consider a fixed rest frame wavelength that is also less affected by dust extinction. This could be achieved by considering the rest-frame i band, which would allow a measure of optical darkness that should only consider the intrinsic GRB spectrum. If the GRB is intrinsically underluminous , as evaluated in the rest-frame i band, will continue to indicate optical darkness independent of redshift and dust content. Conversely, a GRB that is optically attenuated, due to either being at high-redshift or the dust content of its host galaxy, would not be reported as optically dark using such a measure. We have not calculated at a rest-frame i band for the RATIR sample of GRBs as this would require an extrapolation further into the NIR, outside of the RATIR coverage for .
4 Conclusions
In this work we present photometry of 28 GRBs rapidly observed by RATIR. Combining these data with those obtained by the Swift/XRT allows us to quantify optical darkness in these GRBs at a fiducial time of 11 hours after the high-energy trigger. To account for the expected synchrotron emission mechanism, we use the van der Horst et al. (2009) definition of darkness to find 469 per cent (13/28) of our sample of GRBs are considered optically dark, or 5010 per cent (13/26) when only including long GRBs. This fraction is broadly consistent with previous studies (Melandri et al., 2008; Fynbo et al., 2009; Cenko et al., 2009; Greiner et al., 2011; Melandri et al., 2012). The optically dark fraction of GRBs in our sample also remains constant when calculated at an earlier epoch of 5.5 hours.
To investigate the underlying causes of optical darkness, we use the template fitting algorithm presented in Littlejohns et al. (2014) to model the optical and NIR SEDs for the 19 GRBs in our sample with coverage in a sufficient number of filters. We were able to model seven of the bursts identified as optically dark. Of these seven, two have high redshift, two have and two have . GRB 130420A has been modelled, but shown to have neither high redshift nor high dust extinction. We consider two alternative explanations, which suggest either a cooling break immediately below the X-ray regime or that a more precise measurement in the H band would prefer a template with a larger dust content in the GRB host galaxy.
Optical darkness is indicative of interesting GRB events, as they either occur at high-redshift or within highly dust extincted galaxies. Considering optically attenuated GRBs, we find that 23 per cent (3/13) are due to moderate or high redshifts (). Four dark GRBs have unknown redshift, and so this fraction may in fact be higher.
Of the 19 GRBs with modelled SEDs, 3711 per cent (7/19) had moderate or high amounts of dust extinction. This is in general agreement with previous studies (Greiner et al., 2011; Covino et al., 2013), where the majority of the sample have low dust extinction. Averaging across the entire fitted sample using a single type of dust extinction law, we find an average best fit of with an SMC model. Individually, only 5 GRBs prefer an SMC type extinction law, but the improvement in is much larger in a few of these cases than obtained in choosing a different dust extinction law in the other 14 SED fits.
We perform an extensive array of K-S tests comparing the RATIR distributions of , , , and to samples provided in previous literature (Melandri et al., 2008; Cenko et al., 2009; Fynbo et al., 2009; van der Horst et al., 2009; Kann et al., 2010; Greiner et al., 2011; Melandri et al., 2012; Covino et al., 2013). These tests confirm, with one exception, that our sample is statistically consistent with these previous studies, both individually and when considered as a single sample. We do however, find that our distribution of host galaxy along the GRB sight line differs significantly from that of Covino et al. (2013). Further K-S tests reveal that the BAT6 distribution of host galaxy also differs from other previous literature, whilst the RATIR sample is consistent with these other studies. The BAT6 sample is notable for a handful of very high values, including one in excess of , which is derived from a fit with zero degrees of freedom. However, it must also be noted that the selection criteria for the BAT6 sample differ significantly from other studies.
Within the sample of optically dark GRBs, an X-ray derived excess from the host galaxy is detected in 11 bursts. Figure 9 compares to the dust content, as probed along the line of sight. As such, we find the GRB host galaxies tend to have a higher metal-to-dust ratio, which is in agreement with some previous studies (Galama & Wijers, 2001; Greiner et al., 2011). Optically derived estimates of are also presented for four bursts, showing GRB 130606A and GRB 140311A to have a gas-to-dust ratio broadly consistent with that of the LMC and SMC, respectively.
Finally, we present a standardised measurement of optical darkness , which corresponds to optical darkness in a fixed rest frame time of 1.5 hours, considering flux at fixed rest frame values of keV and m. In doing so, we reduce the dependency of optical darkness solely to the host galaxy dust content along the GRB line of sight. As such, we demonstrate that optical darkness in our sample is only due to either high-redshift or host galaxy dust content. This statement is limited by the small sample size of rapidly observed RATIR GRBs, but further population of the versus parameter space should finally and conclusively confirm this to be true.
Acknowledgements
We thank Pall Jakobsson for useful comments and suggestions on the manuscript. We also thank Jochen Greiner for supplying us with detailed data related to Greiner et al. (2011). We thank the RATIR project team and the staff of the Observatorio Astronómico Nacional on Sierra San Pedro Mártir. RATIR is a collaboration between the University of California, the Universidad Nacional Autonóma de México, NASA Goddard Space Flight Center, and Arizona State University, benefiting from the loan of an H2RG detector and hardware and software support from Teledyne Scientific and Imaging. RATIR, the automation of the Harold L. Johnson Telescope of the Observatorio Astronómico Nacional on Sierra San Pedro Mártir, and the operation of both are funded through NASA grants NNX09AH71G, NNX09AT02G, NNX10AI27G, and NNX12AE66G, CONACyT grants INFR-2009-01-122785 and CB-2008-101958, UNAM PAPIIT grant IN113810, and UC MEXUS-CONACyT grant CN 09-283. A.C. is supported by the NASA Postdoctoral Program at the Goddard Space Flight Center, administered by Oak Ridge Associated Universities through a contract with NASA. This work made use of data supplied by the UK Swift Science Data Centre at the University of Leicester.
References
- Ahn et al. (2012) Ahn C. P., Alexandroff R., Allende Prieto C., Anderson S. F., Anderton T., Andrews B. H., Aubourg É., Bailey S., Balbinot E., Barnes R., et al. 2012, ApJS, 203, 21
- Anders & Grevesse (1989) Anders E., Grevesse N., 1989, Geochim. Cosmochim. Acta, 53, 197
- Balucinska-Church & McCammon (1992) Balucinska-Church M., McCammon D., 1992, ApJ, 400, 699
- Barthelmy et al. (2005) Barthelmy S. D., Barbier L. M., Cummings J. R., Fenimore E. E., Gehrels N., Hullinger D., Krimm H. A., Markwardt C. B., Palmer D. M., Parsons A., Sato G., Suzuki M., Takahashi T., Tashiro M., Tueller J., 2005, Space Sci. Rev., 120, 143
- Berger et al. (2003) Berger E., Kulkarni S. R., Frail D. A., 2003, ApJ, 590, 379
- Bertin (2010) Bertin E., , 2010, SWarp: Resampling and Co-adding FITS Images Together
- Bertin & Arnouts (1996) Bertin E., Arnouts S., 1996, A&AS, 117, 393
- Burrows et al. (2005) Burrows D. N., et al., 2005, Space Sci. Rev., 120, 165
- Butler et al. (2012) Butler N., et al., 2012, in Society of Photo-Optical Instrumentation Engineers (SPIE) Conference Series Vol. 8446 of Society of Photo-Optical Instrumentation Engineers (SPIE) Conference Series, First Light with RATIR: An Automated 6-band Optical/NIR Imaging Camera
- Butler et al. (2015) Butler N., et al., , in prep.
- Butler & Kocevski (2007a) Butler N. R., Kocevski D., 2007a, ApJ, 663, 407
- Butler & Kocevski (2007b) Butler N. R., Kocevski D., 2007b, ApJ, 668, 400
- Campana et al. (2014) Campana S., Bernardini M. G., Braito V., Cusumano G., D’Avanzo P., D’Elia V., Ghirlanda G., Ghisellini G., Melandri A., Salvaterra R., Tagliaferri G., Vergani S. D., 2014, MNRAS, 441, 3634
- Campana et al. (2010) Campana S., Thöne C. C., de Ugarte Postigo A., Tagliaferri G., Moretti A., Covino S., 2010, MNRAS, 402, 2429
- Casali et al. (2007) Casali M., et al., 2007, A&A, 467, 777
- Castro-Tirado et al. (2014) Castro-Tirado A. J., et al., 2014, GRB Coordinates Network, 16505, 1
- Cenko et al. (2009) Cenko S. B., et al., 2009, ApJ, 693, 1484
- Chornock et al. (2013) Chornock R., Berger E., Fox D. B., Lunnan R., Drout M. R., Fong W.-f., Laskar T., Roth K. C., 2013, ApJ, 774, 26
- Chornock et al. (2014) Chornock R., Fox D. B., Cucchiara A., Perley D. A., Levan A., 2014, GRB Coordinates Network, 16301, 1
- Chornock et al. (2014) Chornock R., Fox D. B., Tanvir N. R., Berger E., 2014, GRB Coordinates Network, 15966, 1
- Chornock et al. (2013) Chornock R., Lunnan R., Berger E., 2013, GRB Coordinates Network, 15307, 1
- Covino et al. (2013) Covino S., et al., 2013, MNRAS, 432, 1231
- Cucchiara et al. (2011) Cucchiara A., et al., 2011, ApJ, 736, 7
- Cucchiara & Fumagalli (2013) Cucchiara A., Fumagalli M., 2013, GRB Coordinates Network, 14207, 1
- Cucchiara et al. (2014) Cucchiara A., Fumagalli M., Rafelski M., Kocevski D., Prochaska J. X., Cooke R. J., Becker G. D., 2014, ArXiv e-prints
- Curran et al. (2008) Curran P. A., Wijers R. A. M. J., Heemskerk M. H. M., Starling R. L. C., Wiersema K., van der Horst A. J., 2008, A&A, 490, 1047
- De Pasquale et al. (2003) De Pasquale M., et al., 2003, ApJ, 592, 1018
- de Ugarte Postigo et al. (2013) de Ugarte Postigo A., Tanvir N., Sanchez-Ramirez R., Thoene C. C., Gorosabel J., Fynbo J. P. U., 2013, GRB Coordinates Network, 14437, 1
- de Ugarte Postigo et al. (2013) de Ugarte Postigo A., Thoene C. C., Gorosabel J., Sanchez-Ramirez R., Fynbo J. P. U., Tanvir N., Alvarez Iglesias C. A., 2013, GRB Coordinates Network, 14380, 1
- de Ugarte Postigo et al. (2013) de Ugarte Postigo A., Xu D., Malesani D., Gorosabel J., Jakobsson P., Kajava J., 2013, GRB Coordinates Network, 15187, 1
- Evans et al. (2007) Evans P. A., et al., 2007, A&A, 469, 379
- Evans et al. (2009) Evans P. A., et al., 2009, MNRAS, 397, 1177
- Evans et al. (2014) Evans P. A., et al., 2014, MNRAS, 444, 250
- Evans et al. (2010) Evans P. A., Willingale R., Osborne J. P., O’Brien P. T., Page K. L., Markwardt C. B., Barthelmy S. D., Beardmore A. P., Burrows D. N., Pagani C., Starling R. L. C., Gehrels N., Romano P., 2010, A&A, 519, A102
- Fox et al. (2012) Fox O. D., et al., 2012, in Society of Photo-Optical Instrumentation Engineers (SPIE) Conference Series Vol. 8453 of Society of Photo-Optical Instrumentation Engineers (SPIE) Conference Series, Performance and calibration of H2RG detectors and SIDECAR ASICs for the RATIR camera
- Fynbo et al. (2009) Fynbo J. P. U., et al., 2009, ApJS, 185, 526
- Galama & Wijers (2001) Galama T. J., Wijers R. A. M. J., 2001, ApJ, 549, L209
- Gehrels et al. (2004) Gehrels N., et al., 2004, ApJ, 611, 1005
- Gehrels et al. (2008) Gehrels N., et al., 2008, ApJ, 689, 1161
- Granot & Sari (2002) Granot J., Sari R., 2002, ApJ, 568, 820
- Greiner et al. (2008) Greiner J., et al., 2008, PASP, 120, 405
- Greiner et al. (2011) Greiner J., et al., 2011, A&A, 526, A30
- Grindlay et al. (2006) Grindlay J., Portegies Zwart S., McMillan S., 2006, Nature Physics, 2, 116
- Grupe et al. (2013) Grupe D., Nousek J. A., Veres P., Zhang B.-B., Gehrels N., 2013, ApJS, 209, 20
- Gunn & Peterson (1965) Gunn J. E., Peterson B. A., 1965, ApJ, 142, 1633
- Hartoog et al. (2014) Hartoog O. E., et al., 2014, ArXiv e-prints
- Hartoog et al. (2014) Hartoog O. E., Malesani D., Sanchez-Ramirez R., de Ugarte Postigo A., Levan A. J., Fynbo J. P. U., Vreeswijk P. M., Kaper L., 2014, GRB Coordinates Network, 16437, 1
- Hodgkin et al. (2009) Hodgkin S. T., Irwin M. J., Hewett P. C., Warren S. J., 2009, MNRAS, 394, 675
- Jakobsson et al. (2006) Jakobsson P., et al., 2006, A&A, 460, L13
- Jakobsson et al. (2004) Jakobsson P., Hjorth J., Fynbo J. P. U., Watson D., Pedersen K., Björnsson G., Gorosabel J., 2004, ApJ, 617, L21
- Jakobsson et al. (2012) Jakobsson P., Hjorth J., Malesani D., Chapman R., Fynbo J. P. U., Tanvir N. R., Milvang-Jensen B., Vreeswijk P. M., Letawe G., Starling R. L. C., 2012, ApJ, 752, 62
- Kalberla et al. (2005) Kalberla P. M. W., Burton W. B., Hartmann D., Arnal E. M., Bajaja E., Morras R., Pöppel W. G. L., 2005, A&A, 440, 775
- Kann et al. (2010) Kann D. A., et al., 2010, ApJ, 720, 1513
- Klein et al. (2012) Klein C. R., et al., 2012, in Society of Photo-Optical Instrumentation Engineers (SPIE) Conference Series Vol. 8453 of Society of Photo-Optical Instrumentation Engineers (SPIE) Conference Series, Software solution for autonomous observations with H2RG detectors and SIDECAR ASICs for the RATIR camera
- Kouveliotou et al. (1993) Kouveliotou C., Meegan C. A., Fishman G. J., Bhat N. P., Briggs M. S., Koshut T. M., Paciesas W. S., Pendleton G. N., 1993, ApJ, 413, L101
- Krühler et al. (2011) Krühler T., et al., 2011, A&A, 526, A153
- Lamb & Reichart (2000) Lamb D. Q., Reichart D. E., 2000, ApJ, 536, 1
- Lang et al. (2010) Lang D., Hogg D. W., Mierle K., Blanton M., Roweis S., 2010, AJ, 139, 1782
- Lee & Ramirez-Ruiz (2007) Lee W. H., Ramirez-Ruiz E., 2007, New Journal of Physics, 9, 17
- Lee et al. (2010) Lee W. H., Ramirez-Ruiz E., van de Ven G., 2010, ApJ, 720, 953
- Li et al. (2012) Li L., et al., 2012, ApJ, 758, 27
- Liang et al. (2008) Liang E.-W., Racusin J. L., Zhang B., Zhang B.-B., Burrows D. N., 2008, ApJ, 675, 528
- Littlejohns et al. (2014) Littlejohns O. M., et al., 2014, AJ, 148, 2
- Markwardt (2009) Markwardt C. B., 2009, in Bohlender D. A., Durand D., Dowler P., eds, Astronomical Data Analysis Software and Systems XVIII Vol. 411 of Astronomical Society of the Pacific Conference Series, Non-linear Least-squares Fitting in IDL with MPFIT. p. 251
- Melandri et al. (2008) Melandri A., et al., 2008, ApJ, 686, 1209
- Melandri et al. (2012) Melandri A., et al., 2012, MNRAS, 421, 1265
- Monet et al. (2003) Monet D. G., et al., 2003, AJ, 125, 984
- Nakar (2007) Nakar E., 2007, Phys. Rep., 442, 166
- Nousek et al. (2006) Nousek J. A., et al., 2006, ApJ, 642, 389
- Oates et al. (2009) Oates S. R., et al., 2009, MNRAS, 395, 490
- O’Brien et al. (2006) O’Brien P. T., et al., 2006, ApJ, 647, 1213
- Panaitescu & Kumar (2002) Panaitescu A., Kumar P., 2002, ApJ, 571, 779
- Pei (1992) Pei Y. C., 1992, ApJ, 395, 130
- Perley et al. (2014) Perley D. A., et al., 2014, ApJ, 781, 37
- Piran (2004) Piran T., 2004, Reviews of Modern Physics, 76, 1143
- Piran et al. (2001) Piran T., Kumar P., Panaitescu A., Piro L., 2001, ApJ, 560, L167
- Piro et al. (2014) Piro L., Troja E., Gendre B., Ghisellini G., Ricci R., Bannister K., Fiore F., Kidd L. A., Piranomonte S., Wieringa M. H., 2014, ApJ, 790, L15
- Predehl & Schmitt (1995) Predehl P., Schmitt J. H. M. M., 1995, A&A, 293, 889
- Rees & Meszaros (1994) Rees M. J., Meszaros P., 1994, ApJ, 430, L93
- Rhoads (1999) Rhoads J. E., 1999, ApJ, 525, 737
- Rol et al. (2005) Rol E., Wijers R. A. M. J., Kouveliotou C., Kaper L., Kaneko Y., 2005, ApJ, 624, 868
- Roming et al. (2005) Roming P. W. A., et al., 2005, Space Sci. Rev., 120, 95
- Rossi et al. (2012) Rossi A., et al., 2012, A&A, 545, A77
- Salvaterra et al. (2009) Salvaterra R., et al., 2009, Nature, 461, 1258
- Salvaterra et al. (2012) Salvaterra R., et al., 2012, ApJ, 749, 68
- Savaglio et al. (2012) Savaglio S., et al., 2012, MNRAS, 420, 627
- Savaglio et al. (2009) Savaglio S., Glazebrook K., Le Borgne D., 2009, ApJ, 691, 182
- Schady et al. (2012) Schady P., Dwelly T., Page M. J., Krühler T., Greiner J., Oates S. R., de Pasquale M., Nardini M., Roming P. W. A., Rossi A., Still M., 2012, A&A, 537, A15
- Schady et al. (2010) Schady P., Page M. J., Oates S. R., Still M., de Pasquale M., Dwelly T., Kuin N. P. M., Holland S. T., Marshall F. E., Roming P. W. A., 2010, MNRAS, 401, 2773
- Schlafly & Finkbeiner (2011) Schlafly E. F., Finkbeiner D. P., 2011, ApJ, 737, 103
- Schlegel et al. (1998) Schlegel D. J., Finkbeiner D. P., Davis M., 1998, ApJ, 500, 525
- Schmidl et al. (2013) Schmidl S., Kann D. A., Greiner J., 2013, GRB Coordinates Network, 14634, 1
- Skrutskie et al. (2006) Skrutskie M. F., et al., 2006, AJ, 131, 1163
- Smette et al. (2013) Smette A., Ledoux C., Vreeswijk P., De Cia A., Petitjean P., Fynbo J., Malesani D., Fox A., 2013, GRB Coordinates Network, 14848, 1
- Tanvir et al. (2009) Tanvir N. R., et al., 2009, Nature, 461, 1254
- Tanvir et al. (2014) Tanvir N. R., Kruehler T., Schulze S., Karjalainen R., 2014, GRB Coordinates Network, 15988, 1
- Tanvir et al. (2014) Tanvir N. R., Levan A. J., Coulson D., 2014, GRB Coordinates Network, 16570, 1
- Tanvir et al. (2014) Tanvir N. R., Levan A. J., Cucchiarra A., Perley D., Cenko S. B., 2014, GRB Coordinates Network, 16125, 1
- van der Horst et al. (2009) van der Horst A. J., Kouveliotou C., Gehrels N., Rol E., Wijers R. A. M. J., Cannizzo J. K., Racusin J., Burrows D. N., 2009, ApJ, 699, 1087
- Vreeswijk et al. (2013) Vreeswijk P. M., Malesani D., Fynbo J. P. U., De Cia A., Ledoux C., 2013, GRB Coordinates Network, 15249, 1
- Watson et al. (2012) Watson A. M., et al., 2012, in Society of Photo-Optical Instrumentation Engineers (SPIE) Conference Series Vol. 8444 of Society of Photo-Optical Instrumentation Engineers (SPIE) Conference Series, Automation of the OAN/SPM 1.5-meter Johnson telescope for operations with RATIR
- Watson (2011) Watson D., 2011, A&A, 533, A16
- Watson et al. (2013) Watson D., et al., 2013, ApJ, 768, 23
- Watson et al. (2007) Watson D., Hjorth J., Fynbo J. P. U., Jakobsson P., Foley S., Sollerman J., Wijers R. A. M. J., 2007, ApJ, 660, L101
- Watson et al. (2006) Watson D., Reeves J. N., Hjorth J., Fynbo J. P. U., Jakobsson P., Pedersen K., Sollerman J., Castro Cerón J. M., McBreen S., Foley S., 2006, ApJ, 637, L69
- Weingartner & Draine (2001) Weingartner J. C., Draine B. T., 2001, ApJ, 548, 296
- Willingale et al. (2007) Willingale R., O’Brien P. T., Osborne J. P., Godet O., Page K. L., Goad M. R., Burrows D. N., Zhang B., Rol E., Gehrels N., Chincarini G., 2007, ApJ, 662, 1093
- Woosley & Bloom (2006) Woosley S. E., Bloom J. S., 2006, ARA&A, 44, 507
- Xu et al. (2013) Xu D., de Ugarte Postigo A., Malesani D., Vreeswijk P., D’Elia V., Fynbo J. P. U., Milvang-Jensen B., Flores H., Hartoog O., Goldoni P., Kaper L., Vergani S. D., 2013, GRB Coordinates Network, 14956, 1
- Xu et al. (2013) Xu D., Fynbo J. P. U., Jakobsson P., Cano Z., Milvang-Jensen B., Malesani D., de Ugarte Postigo A., Hayes M., 2013, GRB Coordinates Network, 15407, 1
- Yan et al. (1998) Yan M., Sadeghpour H. R., Dalgarno A., 1998, ApJ, 496, 1044
- Zafar & Watson (2013) Zafar T., Watson D., 2013, A&A, 560, A26
- Zhang (2014) Zhang B., 2014, International Journal of Modern Physics D, 23, 30002
- Zhang & Mészáros (2004) Zhang B., Mészáros P., 2004, International Journal of Modern Physics A, 19, 2385