Protostellar Outflows and Radiative Feedback from Massive Stars
Abstract
We carry out radiation hydrodynamical simulations of the formation of massive stars in the super-Eddington regime including both their radiative feedback and protostellar outflows. The calculations start from a prestellar core of dusty gas and continue until the star stops growing. The accretion ends when the remnants of the core are ejected, mostly by the force of the direct stellar radiation in the polar direction and elsewhere by the reradiated thermal infrared radiation. How long the accretion persists depends on whether the protostellar outflows are present. We set the mass outflow rate to 1% of the stellar sink particle’s accretion rate. The outflows open a bipolar cavity extending to the core’s outer edge, through which the thermal radiation readily escapes. The radiative flux is funneled into the polar directions while the core’s collapse proceeds near the equator. The outflow thus extends the “flashlight effect”, or anisotropic radiation field, found in previous studies from the few hundred AU scale of the circumstellar disk up to the 0.1-parsec scale of the core. The core’s flashlight effect allows core gas to accrete on the disk for longer, in the same way that the disk’s flashlight effect allows disk gas to accrete on the star for longer. Thus although the protostellar outflows remove material near the core’s poles, causing slower stellar growth over the first few free-fall times, they also enable accretion to go on longer in our calculations. The outflows ultimately lead to stars of somewhat higher mass.
© 2014. All rights reserved
1 Introduction
Protostellar outflows are ubiquitous in high-mass star forming regions and are believed to be a direct consequence of the stars’ growth. The outflows from massive protostars range broadly in appearance, from highly collimated and jet-like (e.g. Forbrich et al. 2009; Linz et al. 2010; Beuther et al. 2010b; Sepúlveda et al. 2011; Wang et al. 2011; Beltran et al. 2011; Moscadelli et al. 2013; Cesaroni et al. 2013; Palau et al. 2013) to somewhat collimated (Hennemann et al. 2009) or confined outflow structures (Wang et al. 2011). Beltran et al. (2011), for instance, report an outflow with a poorly collimated blue-shifted lobe and a better collimated red-shifted lobe in their source A. Poorly collimated outflows sometimes surround collimated jets and hence could result from the jet entraining ambient gas (e.g. Fallscheer et al. 2009; Beuther et al. 2010a; Sepúlveda et al. 2011). Furthermore, recent observations of a couple of massive young stars show collimated fast jets in combination with disk winds roughly perpendicular to Keplerian-like accretion disks (Murakawa et al. 2013), a picture quite similar to that for Solar-mass stars. The observed range of outflow properties might be an evolutionary sequence (Beuther & Shepherd 2005); a recent observational study of the evolution of molecular outflows in high-mass star forming regions and the associated SiO excitation conditions is in Sánchez-Monge et al. (2013). Broader reviews of massive stars’ outflow properties are in Shepherd (2005), Arce et al. (2007), and Bally (2008).
Theoretical studies of outflows can be divided between those focusing on the launching, acceleration and collimation, and those dealing with the feedback effects of outflows on the circumstellar environment. On the launching side of this division, tight collimation is generally attributed to Lorentz forces. However, the complex outflow morphologies in high-mass star forming regions could mean that more than one acceleration and collimation mechanism is at work. Magnetic fields (e.g. Seifried et al. 2012; Sheikhnezami et al. 2012), molecular line radiation pressure (Vaidya et al. 2011), ionization (Peters et al. 2012), and photoevaporation of disks (Yorke & Richling 2002) have all been suggested as contributing to outflows.
Only a few studies include both the launching physics and the feedback at large scales. These follow the magneto-hydrodynamical (MHD) evolution of a collapsing molecular core either with a cooling prescription (Banerjee & Pudritz 2007) or a barotropic equation of state (Hennebelle et al. 2011). The time span covered in such calculations is limited by the need to simultaneously resolve the MHD launching physics on small scales and span the large-scale collapse. So far it has only been possible to study the early stages of collapse — up to half the free-fall time of the pre-stellar core. To circumvent the small timesteps and make it possible to follow the outflow feedback longer, several studies have used a sub-grid scheme to inject protostellar outflows into the computational domain. These include MHD simulations (Wang et al. 2010), radiation-hydrodynamics (RHD) studies (Cunningham et al. 2011), and multiple outflow interactions (Peters et al. 2014). Whereas Wang et al. (2010) followed the MHD collapse for roughly 2-3 free-fall times, the RHD simulations of Cunningham et al. (2011) were still limited to the initial 0.8 free-fall times, i.e. not long enough to determine the net effect of outflows on the evolution. Peters et al. (2014) studied the effect of multiple outflows from low-mass companion stars in massive star forming regions, explaining the morphology and power of observed outflows, but neglecting the effect of radiation pressure from the massive star.
Here we focus on the long-term evolution of the collapsing pre-stellar environment. A protostar forms, grows through accretion, initiates an outflow, and continues to grow until it becomes so luminous that its radiative forces shape the dynamics of the surrounding gas. The high optical depth of a massive accretion disk surrounding a protostar significantly reduces the radiation pressure onto the stellar accretion flow by causing an anisotropy of the reemitted thermal radiation field, a mechanism also known as the “flashlight effect” (Yorke & Bodenheimer 1999; Yorke & Sonnhalter 2002; Krumholz et al. 2005; Kuiper et al. 2010a).
In general, protostellar outflows impact the stellar environment via their momentum feedback (see Ray et al. 2007; Arce et al. 2007; Frank et al. 2014, for reviews). Hence, outflows are assumed to have a negative SFE feedback via decreasing the accretion rate and, hence, limiting the accreted mass. On the other hand, for massive stars in the super-Eddington regime (i.e. their environment is severely affected by radiative forces), early protostellar outflows may alter the later radiative feedback epoch of these stars. Indeed, a low-density / optically thin cavity produced by protostellar outflows might decrease the radiative feedback on the accretion flow, i.e. outflows also have a positive SFE feedback. Conceptually, this effect was already shown in purely radiation transport simulations of a static configuration with a star, a disk, an envelope, and an outflow cavity in Krumholz et al. (2005). To finally conclude, which of these effects is stronger - the negative or the positive one - dynamical studies of the star formation process are essential. But previous radiation-hydrodynamical studies including the effect of radiative forces (such as Krumholz et al. 2007; Cunningham et al. 2011; Commercon et al. 2011) have been performed only for the sub-Eddington / marginal-Eddington regime. Here, we go beyond this barrier, to quantitatively determine the efficiency of both effects and their interplay for substantially massive stars.
Such super-Eddington massive stars are assumed to form naturally via global cloud collapse as presented in recent observations by Peretto et al. (2013).
When the high optical depth cannot further be sustained by ongoing accretion from the envelope onto the disk, ultimately, the radiation forces overcome the gravitational attraction of the protostar and reverse the infall. We follow the evolution of the core through the entire stellar accretion phase, stopping the calculations only after the initial mass within our computational domain is either accreted onto the central star or expelled through the outer boundary at a radius of 0.1 pc. The simulations run 6.7 and 5.7 free-fall times starting with pre-stellar cores having initial density profiles and , respectively. To separate the consequences of protostellar outflows from radiation feedback, we also perform comparison calculations without the outflows. The difference between these two is expected to be the cavities opened by the early protostellar outflows and these will affect the radiation field.
We treat the radiation pressure feedback using a hybrid radiative transport scheme, calculating the stellar irradiation by a ray-tracing method and the thermal dust emission by flux-limited diffusion. For details, we refer the reader to the methods section below.
In Sect. 2 we briefly describe our star formation modeling framework and the sub-grid model for the protostellar outflows, and in Sect. 3 the initial state of the pre-stellar cores. The results are presented in four sections focusing on the dominant forces (Sect. 4), the core evolution and mass loss (Sect. 5)), the outflows (Sect. 6) and the disk and stellar accretion (Sect. 7). In Sect. 8 we discuss the observational implications and in Sect. 9 reiterate the limitations of this study and outline the prospects for follow-up work. A summary is in Sect. 10.
2 Methods
2.1 General Star Formation Framework
To follow the evolution of the gas and dust in a collapsing, slowly rotating pre-stellar core, we solve the equations of compressible radiation-hydrodynamics, including self-gravity and shear viscosity. The basic numerical code is the same as in our previous studies (Kuiper et al. 2010a, 2011, 2012). The hydrodynamical solver we use is the open source magneto-hydrodynamics code Pluto (Mignone et al. 2007). The coordinate system is spherical with radial and colatitude coordinates .
A special feature of the code is our hybrid radiation transport scheme, which combines a highly accurate frequency-dependent ray-tracing step for the stellar irradiation with a gray flux-limited diffusion (FLD) approximation for the dust thermal (re-)emission. Detailed description of the derivation, numerical implementation, and benchmarking of the radiation transport solver are in Kuiper et al. (2010b). Our hybrid approach is a major improvement over the pure gray FLD approximation (e.g. Bodenheimer et al. 1990; Yorke & Kaisig 1995), in which not only the thermal dust emission but also the stellar irradiation is computed in the FLD approximation. Especially when radiation dominates the energy budget of an optically thin outflow cavity, the stellar irradiation must be treated accurately to correctly model the dynamical evolution (Kuiper et al. 2012). Most importantly, the much higher opacity of the stellar irradiation in contrast to the rather low opacity of the thermal radiation field has to be taken into account properly. Furthermore, the technique takes into account the irradiation’s anisotropy in the optically thin limit (relevant for studies of molecular outflows) and renders the formation of shadows behind highly optically thick regions (relevant for studies of circumstellar disks). For a setup including a star, a slightly flared disk, and an envelope, the hybrid method is nearly as accurate as modern Monte-Carlo radiative transfer codes (excluding the effect of scattering) in all optical depth regimes (Kuiper & Klessen 2013), but much faster.
The spectrum of the stellar irradiation is treated using 79 frequency bins. Across these bins the dust opacity’s frequency dependence is drawn from Laor & Draine (1993). Frequency-averaged (gray) Planck and Rosseland mean opacities for the thermal dust emission are computed from the frequency-dependent dust opacities. In dust-free regions the gas opacity is used instead of dust and is fixed to a constant value .
The central star evolves following a sub-grid model computed by fitting the stellar evolutionary tracks of Hosokawa & Omukai (2009). These tracks include the effects of accretion onto forming high-mass stars. Including the effects of protostellar outflows is a straightforward extension of the self-gravity radiation-hydrodynamical star formation framework of Kuiper et al. (2010a).
2.2 Protostellar Outflows Sub-Grid Model
A consistent study of the launching mechanism(s) and the developing outflow structure within the collapsing pre-stellar core would require computing the MHD evolution of the collapse down to a small fraction of an AU resolution to guarantee meaningful results. Due to limited computing resources, we can currently perform such a self-consistent study in 2D for about one free-fall time of the pre-stellar core. To enable this investigation of protostellar outflow feedback over the course of the protostar’s entire accretion phase, we adopt the following approach. Rather than modeling the launching mechanism(s) and structures of protostellar outflows from basic principles, we use a sub-grid model, whereby the momentum injection and mass loss rate of the protostellar outflows follow an analytical prescription (Cunningham et al. 2011), and depend on the protostellar parameters (mass, radius, and accretion rate).
In these simulations a protostar forms and evolves at the center of our grid, i.e. within a sink cell of radius , the inner radial boundary of the computational domain. The protostellar outflow associated with the protostar can therefore be implemented in the numerical scheme as an inner boundary condition at , which we set equal to 10 AU. Because the protostellar outflow’s launching is generally attributed to magneto-centrifugal acceleration and/or twisting of magnetic field lines near the accretion disk’s inner rim, we turn on the outflow when a rotation-supported disk first forms in the calculation. The exact time to initiate the outflow is chosen based on the corresponding reference simulation without an outflow. The switching-on occurs when the central protostar has grown to and in the cases with initial core density profiles with power law indexes and , respectively.
Once the outflow turns on, the outward radial velocity at the inner radial boundary is set proportional to the Keplerian velocity at the stellar radius
| (1) |
with , where is the gravitational constant and and are the protostellar mass and radius. Here we use . The parametrization above can also be given in terms of the escape speed at the injection radius
| (2) |
At all epochs of the simulations, the injection velocity is higher than the corresponding escape velocity. The mean ratio .
The density at the inner radial boundary is set proportional to the actual accretion rate onto the protostar
| (3) |
The mass loss rate in the outflow is
| (4) |
The outflow is concentrated near the polar axis. The angular distribution is conveniently parametrized using a formulation from Matzner & McKee (1999)
| (5) |
This yields collimated flows up and down the rotation axis and broad wings toward the disk’s mid-plane , resembling the jets observed within broader molecular outflows. The so-called flattening of the distribution is given by the constant , which we set to 0.01 in accordance with Cunningham et al. (2011), giving the angular weighting in Fig. 1.

The low value of yields an outflow force feedback focussed near the rotation axis, most strongly impacting the poles. The momentum flux injected at () is four orders of magnitude greater than in the disk mid-plane ().
Protostellar outflows have several feedback effects. First, the accretion onto the star is reduced by (“mass loss feedback”). Second, the outflow changes the dynamics of the stellar environment due to additional outward momentum (“kinematic feedback”). Third, the outflows clear material away from the poles, making the ambient density more anisotropic. This is especially important for high-mass stars, where the starlight radiative forces eventually dominate (“radiative feedback”). For simplicity and to allow straightforward comparison with simulations lacking the protostellar outflows, here we focus on the kinematic and radiative feedback, setting so that mass loss feedback is minor.
2.3 Comparison to Cunningham et al. (2011)
While the analytical formulae we use to parametrize the outflows are identical to Cunningham et al. (2011), the numerical implementation differs because of the particulars of the computational grids. Cunningham et al. (2011) use a 3D Cartesian adaptive mesh with maximum resolution . We use a 2D static grid in spherical coordinates with maximum resolution . In Cunningham et al. (2011), forming protostars are represented by sink particles. A protostellar outflow associated with a sink particle is injected into the ambient gas via a kernel function, which spreads the outflow injection over four to eight grid cells radially around the sink particle, i.e. within AU. In our treatment, the protostar forms in a sink cell at the center of the spherical grid. Hence, its interaction with the ambient medium can be described via ordinary boundary conditions at the innermost grid point, at AU.
We aim to run the simulations long enough to follow the protostar’s whole accretion phase, and to investigate the protostellar outflows’ effects at late epochs when the star grows so luminous that radiative forces dominate the dynamics. This is made possible by choosing a simpler setup than Cunningham et al. (2011): our models are symmetric around the rotation axis and about the midplane. High spatial resolution is important especially in the innermost regions, where the protostellar outflow is injected and first interacts with the envelope medium, and where radiative forces act on the inner rim of the accretion disk. High resolution is achieved by using spherical coordinates with a logarithmically-spaced radial grid. The pressure scale height of the accretion disk is resolved by at least one grid cell in our simulations. In Cunningham et al. (2011) the disk scale height was unresolved and therefore – to avoid an artificial disruption of the forming disk by the protostellar outflow – the outflow injection was switched off in an equatorial belt at least one cell thick ( AU). No such switch is needed in our calculations, allowing us to investigate the accretion flow’s interaction with the outflow and starlight, both as the disk is forming and in late evolutionary stages.
3 Initial Conditions
We consider four cases. All start with a pre-stellar core containing , 0.1 pc in radius, with a uniform temperature 20 K and in slow solid body rotation at s-1. For each of two different initial density distributions, and , we carry out runs with and without protostellar outflows. The four cases are listed in Table 1.
| Run label | Protostellar Outflow | [kyr] | |||
|---|---|---|---|---|---|
| rho1.5 | 1.5 | No | 1.2 | 350 | 42 |
| rho1.5-PO | 1.5 | Yes | 1.0 | 460 | 47 |
| rho2.0 | 2.0 | No | 5.8 | 90 | 52 |
| rho2.0-PO | 2.0 | Yes | 1.5 | 360 | 55 |
4 Dominant Forces
Protostars’ masses are ultimately determined by what happens to the reservoir of potentially accretable material. In our calculations the growth ends when the remaining envelope is expelled either by radiation forces or by entrainment in outflows. To gain insight into these feedback processes, in this section we examine the main forces along the radial direction.
Initially the flow is governed by collapse under self-gravity. As collapse proceeds, centrifugal forces increase near the center of the core due to angular momentum conservation, until a rotation-supported disk forms in orbit around the protostar. Once the disk is in place, a protostellar outflow is launched and injects outward momentum into the ambient medium. The protostar’s luminosity grows until eventually radiative forces overcome the star’s gravitational attraction. Although thermal pressure builds up as the core contracts and the star brightens, its contribution to the radial forces remains limited. Note, however, that we neglect photoionization of the ambient medium and heating by photoelectrons, both of which increase thermal pressure forces. UV feedback is most likely limited to later epochs of stellar evolution (than we study here), after the accreting protostar reaches the main sequence (Hosokawa & Omukai 2009; Hosokawa et al. 2010; Kuiper & Yorke 2013b).
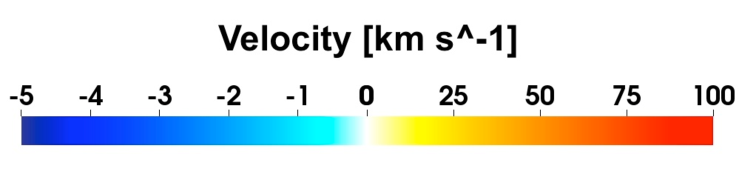
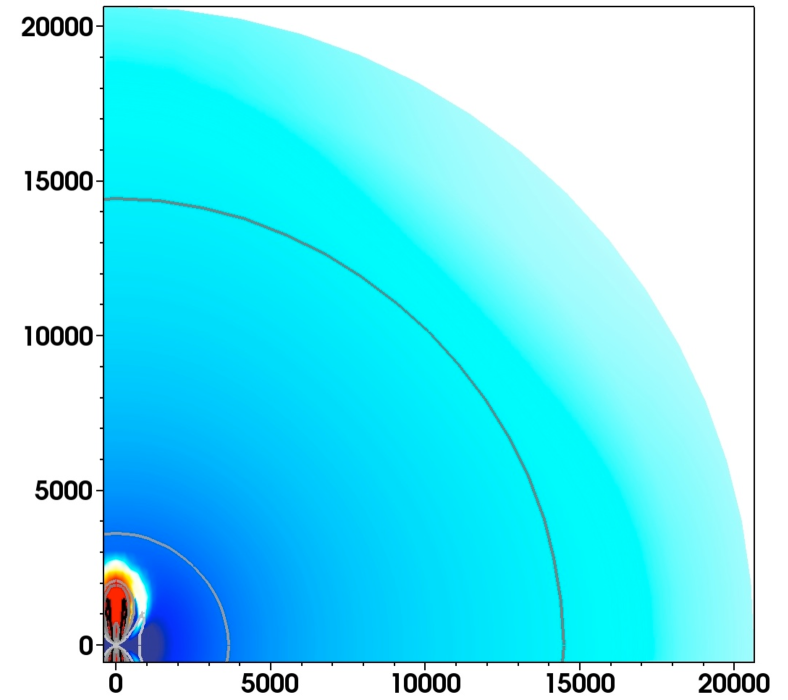
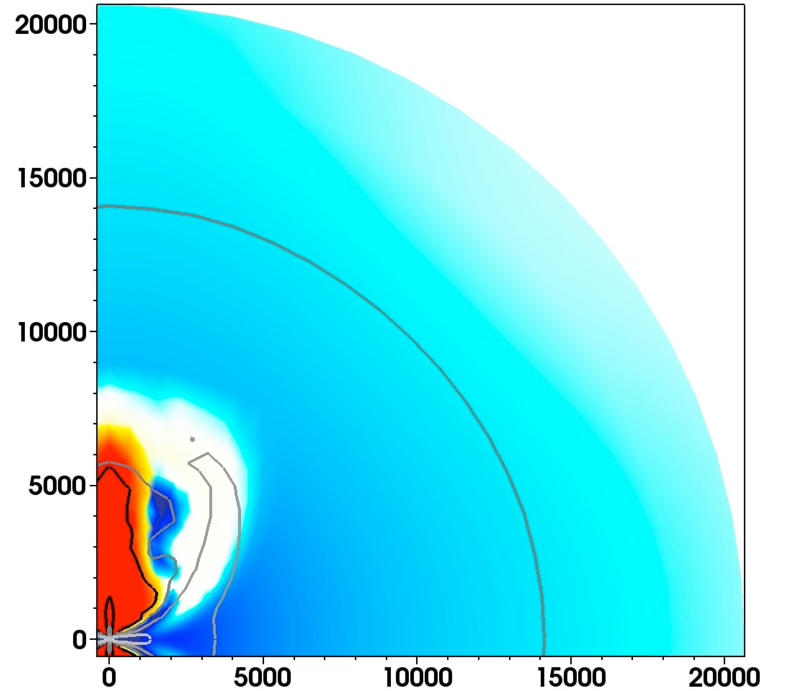
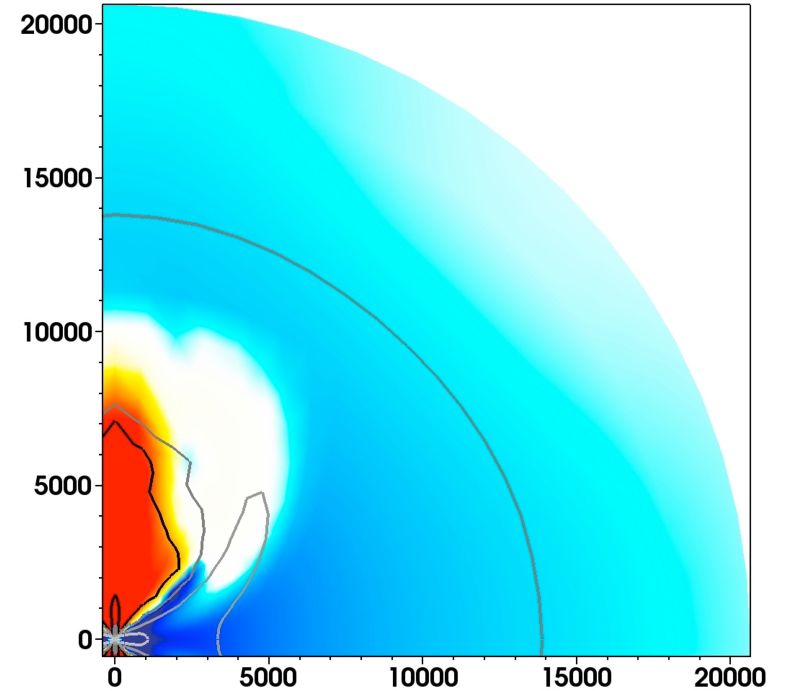
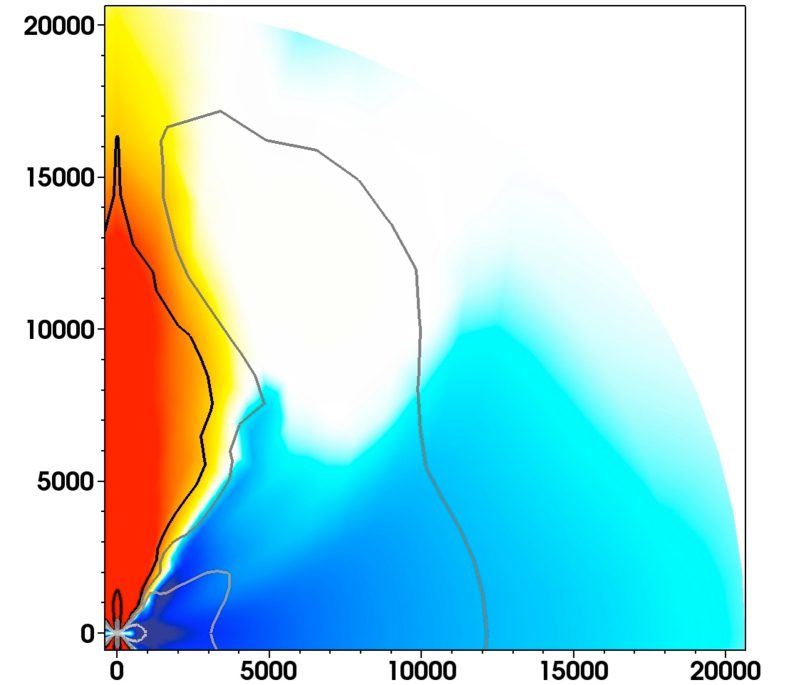
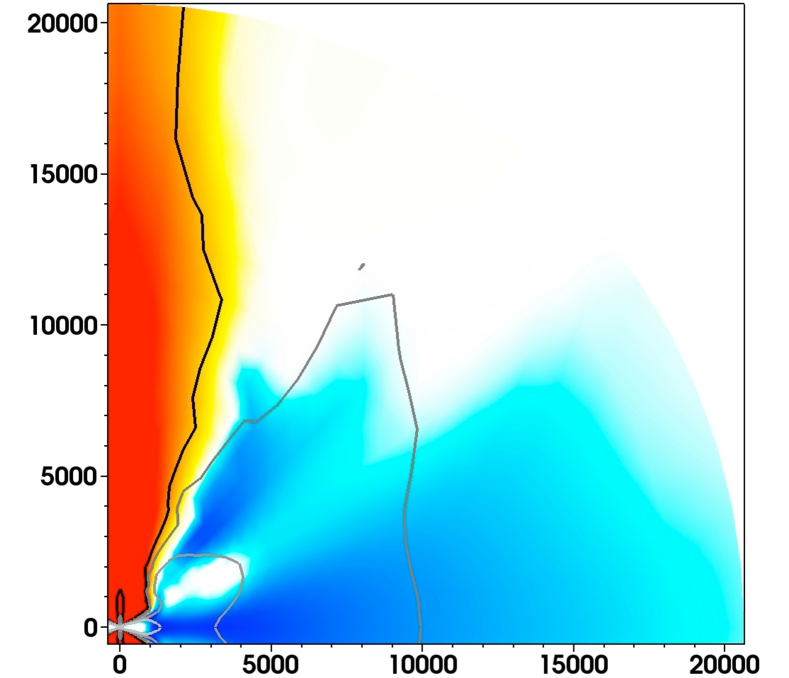
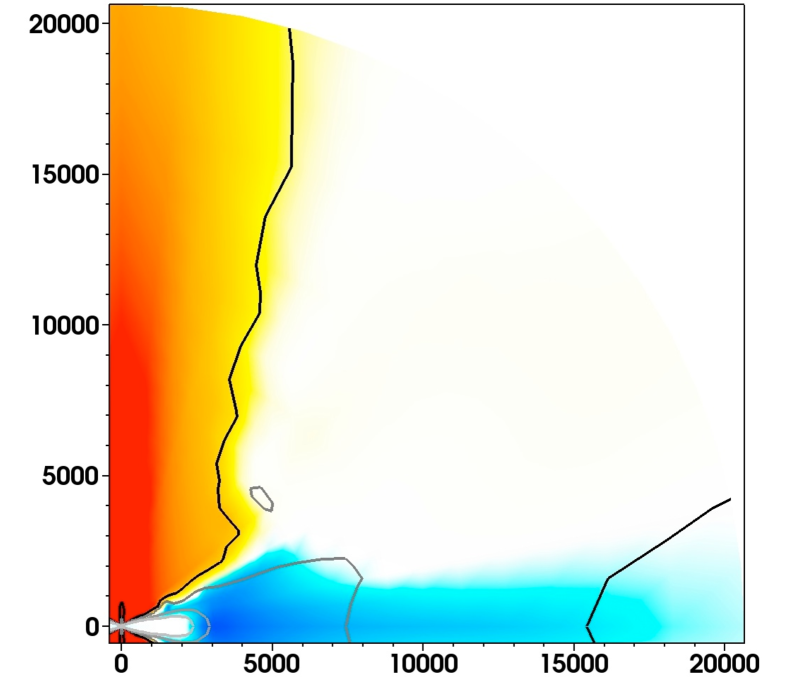
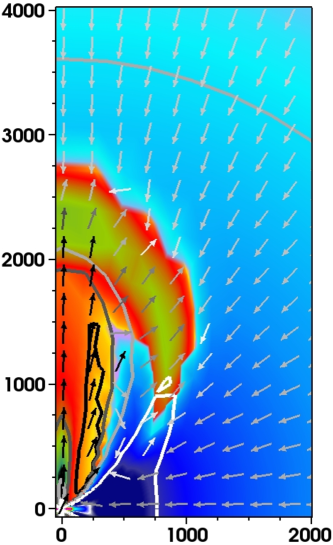
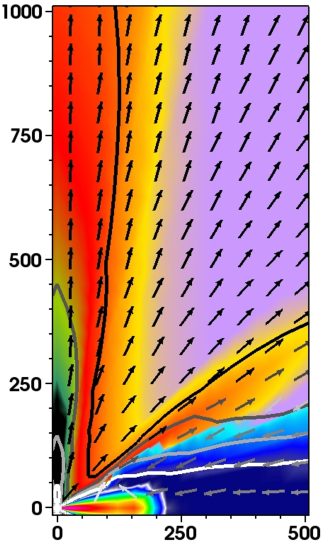
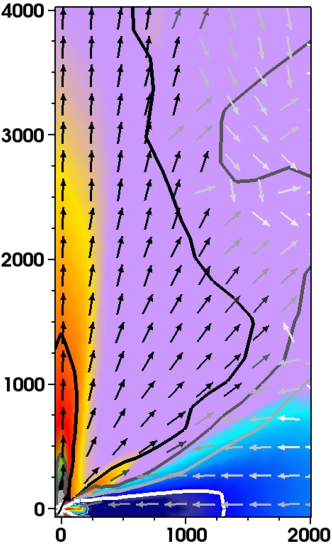
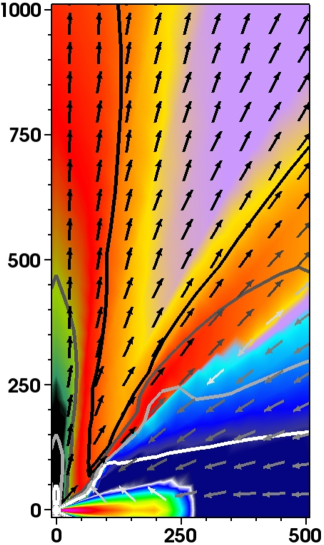
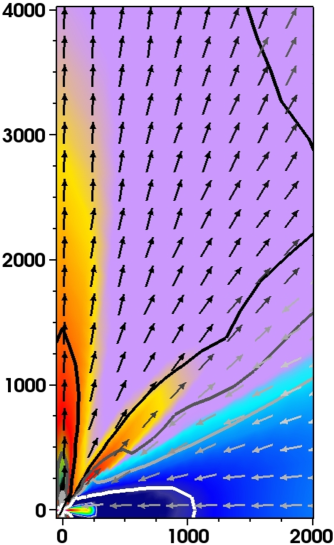
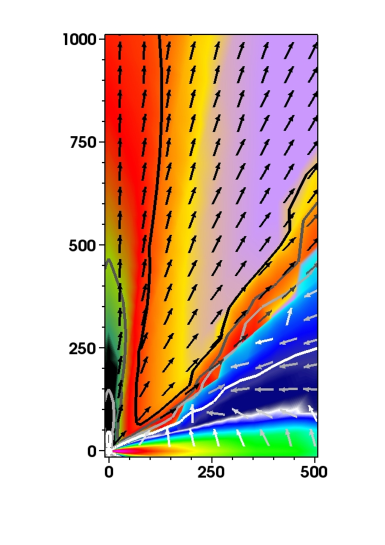
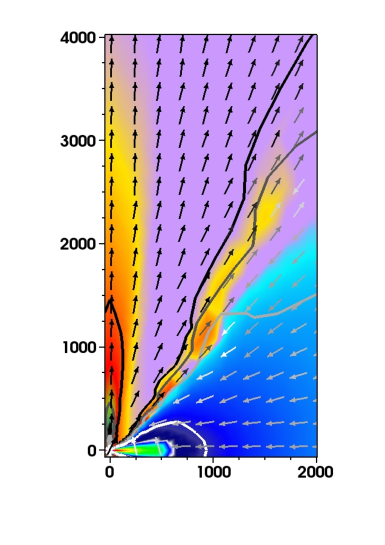
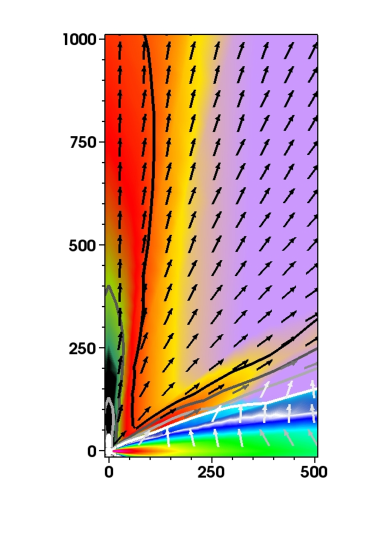
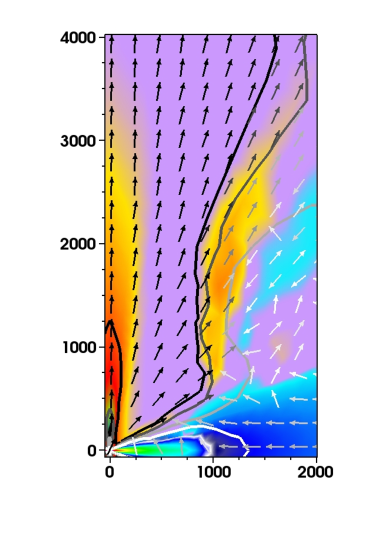
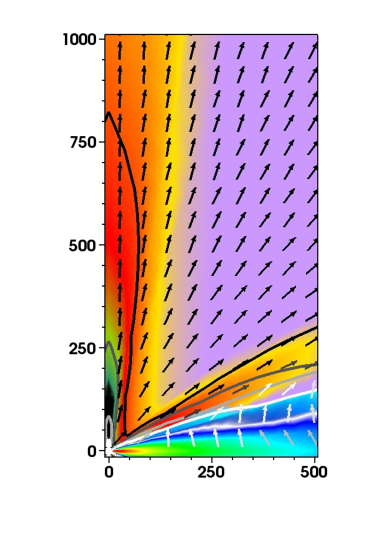
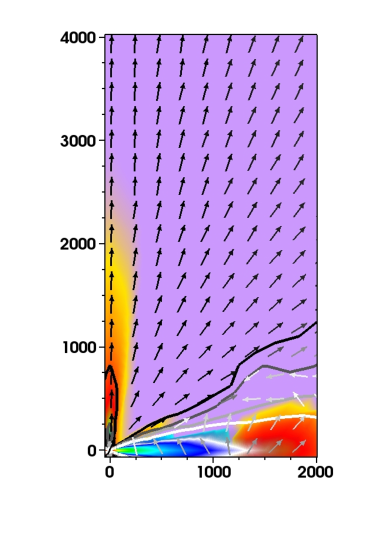
Thus the radial dynamics of the polar regions during the pre-main sequence phases are dominated by gravity, outflows and stellar radiative forces. The resulting velocity patterns in the pre-stellar core collapse are shown in Figs. 2 to 7. The figures distinguish the inward accretion flow from the outward motion due to protostellar outflow and both stellar and thermal radiation pressure feedback. The time sequence is chosen to display the clearing of the bipolar region. In the accretion disk the radial flows are controlled by gravity approximately balanced by centrifugal forces, with radiative forces contributing at certain times.
5 Core Evolution and Mass Loss
In all four runs, with and without the feedback from protostellar outflows, the radiative forces remove a substantial fraction of the envelope. The epoch of radiative feedback starts once the protostar becomes super-Eddington with respect to the opacities of the accreting material. In the two runs without protostellar outflows, radiative and centrifugal forces reverse the flow closely above (and below) the accretion disk, launching a wide-angle wind. Closer to the rotation axis, the stellar radiative forces reverse the flow, launching a bipolar outflow. At the same time the high midplane optical depth of the accretion disk means the thermal dust reemission is strongly anisotropic due to the flashlight effect, enhancing the radiative forces in the bipolar outflow while reducing them at lower latitudes.
The two runs including the protostellar outflows differ once the disk forms and the outflows are injected. Accretion onto the protostar is then slower than in the versions without the outflows, a direct result of the outflows entraining and carrying away envelope material. We designate this the “kinematic” feedback to contrast it with the “radiative” feedback.
By ejecting envelope material from the system, the outflows alter the evolution of the disk and protostar. Fig. 8 shows the rates of stellar accretion (upper panels) and mass loss from the prestellar core (lower panels) as functions of the accreted stellar mass .
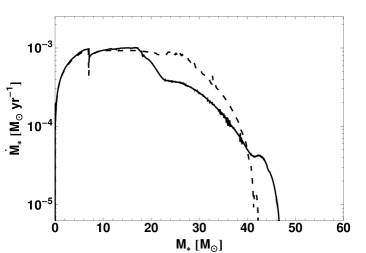
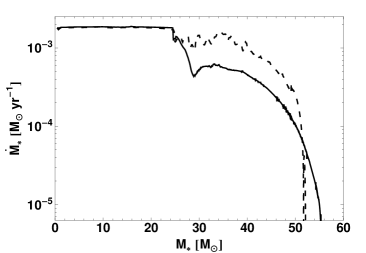
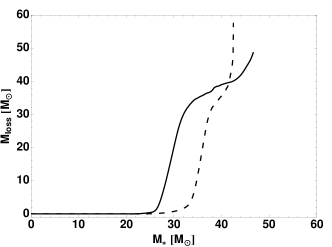
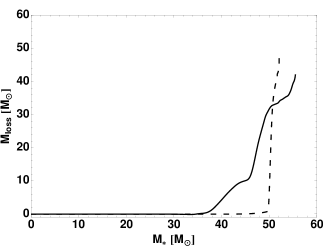
The kinematic outflow feedback coincides with a decline in the star’s accretion rate (fig. 8, upper panels). As the star gains mass, the radiative feedback becomes more important (lower panels) and eventually ends the stellar accretion (upper panels). Both feedback effects act first on small scales to diminish the stellar growth rate, and later on large scales to expel mass from the core.
6 Outflow Evolution
As with the core, the bipolar outflows are governed by the injected protostellar outflows at early times and later also shaped by the stellar radiative forces. Below we divide the discussion between the outflows’ dynamics, momentum and their opening angle history.
6.1 Outflow Dynamics
The outflow dynamics at low latitudes is complex. Basically, in the runs without protostellar outflows, the polar regions’ dynamics are dominated by gravity and stellar radiation forces. At low latitudes, centrifugal forces also contribute, yielding lower effective gravities. The radiatively-driven outflow therefore starts first at the lower latitudes, yielding a quadrupole or butterfly shape around the protostar. Shortly afterward, the radiation pressure also halts the infall along the rotation axis. In short order the flow reverses all the way to the boundary.
In the runs with protostellar outflows, the injected momentum leads to a disk wind at earlier epochs, before the onset of strong radiation forces. The centrifugal forces are unimportant because the outflow is strong enough to drive the disk wind without help. Once the radiation pressure increases, the dynamics at low latitudes are controlled by the kinematic feedback, the radiative feedback, and gravity. E.g. for the transition from kinematically dominated to radiatively dominated outflows, see Fig. 6, in which the white-colored region above and behind the accretion disk denotes the onset of flow reversal due to dominating radiative forces within the collapsing environment.
6.2 Momentum Distribution
Beginning soon after the protostellar outflows are first launched, and continuing until stellar radiation forces become important, the outflow momentum distribution is characterized by a collimated high-momentum jet-like structure ending in a somewhat wider bow shock. The degree of collimation is determined by the angular weighting used when injecting the outflows (Sect. 2).
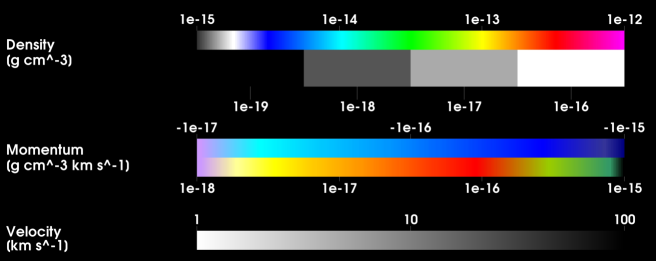
The outflow passes through several phases of evolution, shown by snapshots of the momentum, velocity and density distributions in Figs. 9 to 14. During all phases, the outflow consists of two components (Figs. 10 to 14). The first is a fast jet, confined to a small angle around the symmetry axis. Its extent is governed by the injection rate and thus the stellar accretion rate. The second component is a slower wind, which transports intermediate-density material () at lower latitudes in the bipolar cavity and/or the top of the accretion disk atmosphere. The slower wind is initially driven by the kinematic feedback of the outflow and limited in size to a few 100 AU. Over time the radiation forces become more and more important, and around the time they come to dominate, the wind briefly reaches out as far as 2000 AU (Fig. 12 and Fig. 13). In the later phase (Fig. 14), the protostellar radiation force eventually drags the intermediate-density gas to larger radii and clears the bipolar region over a large solid angle. Hence the wind component associated with the intermediate density gas vanishes on extents larger than roughly 500 AU once the stellar radiative forces dominate the outflow region.

6.3 Opening Angle
The bipolar outflow’s opening angle passes through three stages of evolution. Over long timescales the opening angle widens as the radiative feedback from the protostar increases. Over shorter timescales, however, the opening angle is affected by the distribution of intermediate-density gas and dust above and below the disk. The material’s opacity shields the environment from the central radiative force.
When the protostellar outflow is first injected, a shock propagates into the envelope, slowing and even reversing the infall on larger scales. The shock appears green in Fig. 9 right panel. Once the shock propagates past each radius, infall there resumes. The shock temporarily clears material, allowing the outflow opening angle to increase up a maximum of about 60 degrees (measured from the symmetry axis to one side). This broadening of the outflow is confined to within roughly AU of the protostar and reaches its maximum extent 18 kyr after the start of the collapse.
In a second stage, after the shock passes out of the domain, the outflow within AU of the protostar settles into a quasi-stationary state. The opening angle is governed by the injected momentum and the infall from larger scales. The quasi-stationary opening angle is about 40 degrees starting at 25 kyr. The outflow reaches AU along the symmetry axis at this time.
The quasi-stationary stage holds only up to about 30 kyr. Then, in a third stage, the stellar radiative force overcomes the gravitational attraction of the protostar and the opening angle of the radiation-pressure-dominated outflow broadens monotonically in time (Figs. 12 and 13). The maximum angle of the radiation-pressure-driven outflow is controlled by the inner accretion disk’s variation of optical depth with angle. The radiatively-driven outflow has a larger opening angle than the early protostellar outflow.
7 Disk Evolution and Stellar Accretion
In this section we look at how the kinematic and radiative feedback shape the star’s growth. The star grows by receiving mass from the accretion disk. Angular momentum conservation in the infalling gas dictates that the disk is assembled from inside out. Its growth is governed by the mass fed from larger scales, which appears in Figs. 9 to 13 as a blue torus of inward radial momentum. The disk’s outer edge undergoes radial oscillations and super-Keplerian azimuthal motion as the arriving material settles into radial force balance. The balance involves contributions from self-gravity, thermal pressure and radiation pressure. E.g. the red-colored region (positive outward momentum) at the outer rim of the accretion disk (Fig. 14, right panel) denotes the interaction zone of the disk with the collapsing environment; the process of in-falling material approaching its gravito-centrifugal balance (plus minor contributions of thermal and radiation pressure) yields small natural oscillations around the equilibrium point. For further details of this disk-growing process, we refer the interested reader to Kuiper et al. (2011), Sect. 4.2 and Fig. 4, where a 3-D calculation is compared with a series of axisymmetric disk models having varying shear viscosities..
The star’s final mass is the time integral of the accretion rate history and can be expressed as a mean accretion rate multiplied by the duration of the epoch of disk accretion. The disk’s mass flow rate and lifetime both depend on the supply of material falling from the envelope onto the disk, which in turn is governed by the radiative feedback. The surprise is that adding the modest protostellar outflow makes the star’s final mass larger. The outflow’s kinematic feedback is more than balanced by a reduction in the effectiveness of the thermal radiative feedback. The bipolar cavity cleared by the outflow amplifies the flashlight effect, letting both the stellar and thermal radiation escape more easily near the poles and reducing the fluxes into lower latitudes. The anisotropy of the thermal radiation, in particular, reduces the extent of the mass loss through the outer boundary, allowing more of the envelope mass ultimately to fall onto the disk.
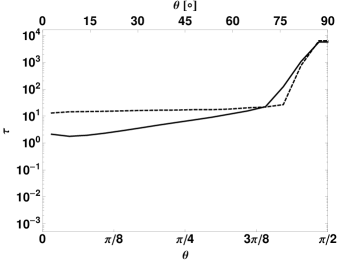
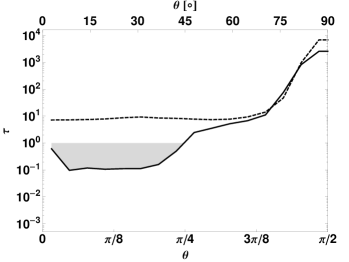
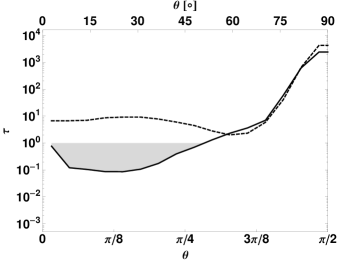
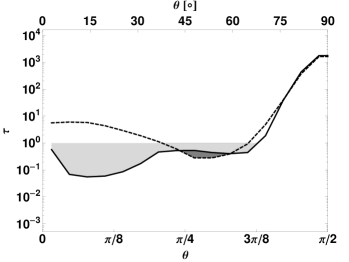
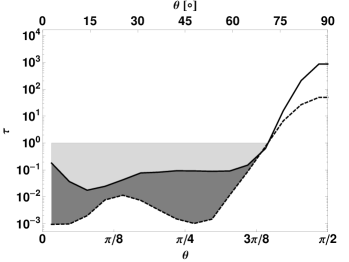
A measure of the flashlight effect is the density contrast between the disk and its surroundings. The contrast is several orders of magnitude greater with the protostellar outflow (Fig. 15). The flashlight effect’s strength can also be seen in the contrast from pole to equator in the optical depth for thermal radiation, (Fig. 16). The early evolution in simulations without protostellar outflow is characterized by an optical depth independent of the polar angle — that is, the protostar’s surroundings are isotropic. By contrast, simulations including the protostellar outflow reach the same point in time with the poles cleared so that the optical depth for the thermal radiation . The angular extent of the optically thin region grows in time (gray shading in Figs. 16(a) to 16(f)). Along the axis, the optical depth is due to the protostellar outflow itself and hence remains at higher values.
Even in the calculations without the protostellar outflows, the radiative forces eventually strengthen, slowing the accretion and at certain angles reversing it. Inside the optically thick accretion disk, the flashlight effect diminishes the thermal radiative forces. At angles immediately above the disk, the dynamics of the infalling envelope are governed by gravity, centrifugal and radiative forces, while at angles near the poles, centrifugal forces are negligible. Therefore the inflow is most easily halted along radial lines passing just outside the body of the disk. In our calculations without the protostellar outflows, the radiative and centrifugal forces drive winds at angles roughly above the midplane, leading to decreased optical depths (Figs. 16(b), 16(d), and 16(e)). But the winds are not continuously present in time. The winds’ erratic interaction with the envelope means during some phases the disk is mass-starved, while in others the disk receives infalling envelope material (compare the extent of the blue-colored disk feeding region in Figs. 9 to 11). At late epochs, when the star is luminous and radiative forces become important, simulations lacking the outflow are characterized by mass loss from the protostellar core due to radiative feedback on the previously isotropic environment. The optical depth decreases in a large range of viewing angles around the pole (see Fig. 16(f)). At the same time, the disk’s optical depth decreases due to limited accretion from the envelope.
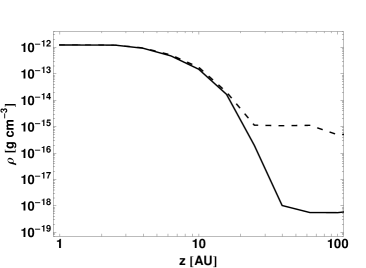
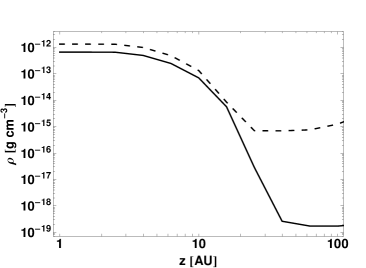
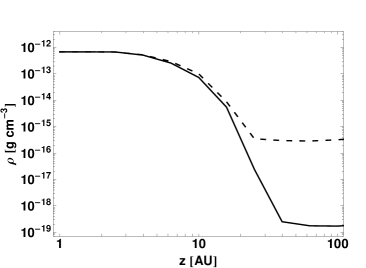
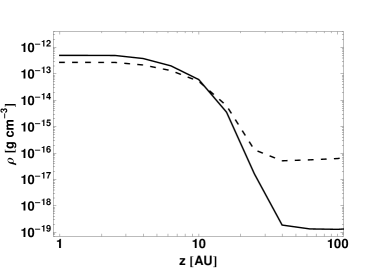
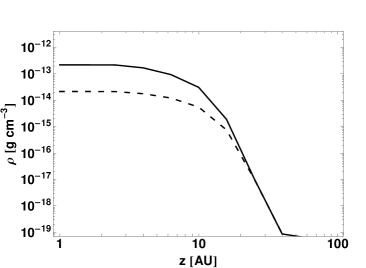

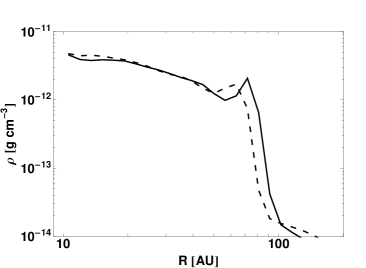
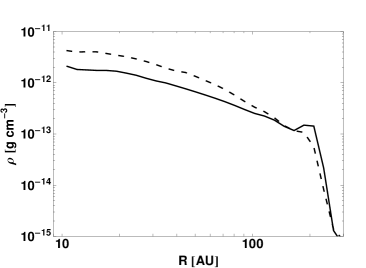
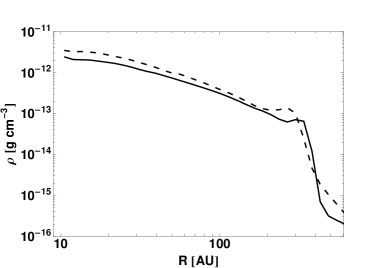
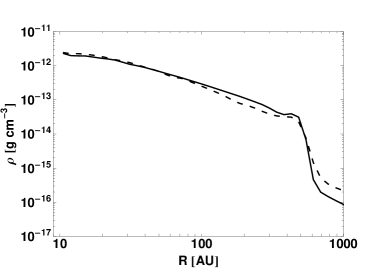
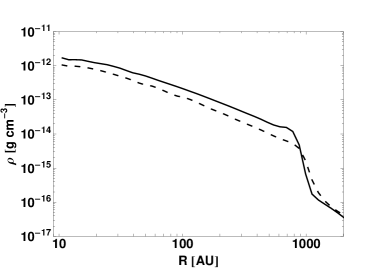
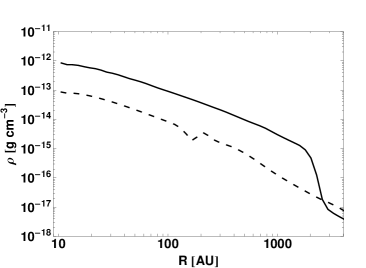
When we include the protostellar outflow, both the stellar and the thermal radiative flux is concentrated near the poles, and the bulk of the envelope elsewhere receives less radiation. The weaker radiation forces on the envelope mean a larger reservoir of mass is available to accrete onto the disk and ultimately onto the star. Although the disk mass flow rate is lower, the flow continues for longer. The slower depletion of the disk is evident in midplane density cuts (Fig. 17). The epoch of disk accretion lasts up to four times longer in the simulations with protostellar outflows (Table 1). However the relatively low accretion rates in the later stages yield only a few Solar masses of extra material. The final masses for the cases with protostellar outflow are and for initial density distributions and , respectively. The final masses in the reference runs without the protostellar outflow are and , respectively.
8 Observational Implications
The phase of rapid mass accretion onto a protostar is particularly important for understanding the origins of massive stars. The challenge is to capture observations during this brief phase. As the envelope collapses under its own gravity, the gas density above and below the disk decreases, allowing the radiation-driven outflow to broaden. The increasing opening angle makes the central protostar directly visible for observers over a larger portion of the sky. The cases we discuss here indicate that we could observe high-mass protostars either directly through their outflow cavities, if the viewing angle is nearly pole-on, or indirectly via scattered light (see also Bruderer et al. 2009). Several candidate massive protostars appear to be bloated (Linz et al. 2009; Bik et al. 2012; Palau et al. 2013) suggesting they are accreting gas at high rates (Hosokawa et al. 2010; Kuiper & Yorke 2013b). For more quantitative predictions of the observability and expected signatures of massive protostars during rapid mass accretion, hydrodynamical models like those presented here ought to be complemented by detailed radiative transport calculations.
Radiative feedback reduces the star formation efficiency of the pre-stellar core collapse to roughly 50%. In our simulations, about half the initial mass is expelled through the outer boundary at 0.1 pc and therefore does not contribute to the growth of the central star. The lost mass is mostly envelope material entrained in the protostellar outflow (at early times) and accelerated by radiation (at later times). There are minor contributions from disk winds and the redirection of the disk accretion flow into the protostellar outflow. This outcome is consistent with the tight correlation observed between outflow mass and core mass over many orders of magnitude by Beuther et al. (2002b). High-mass molecular outflows could resemble their counterparts around lower-mass stars in resulting from entrainment in a collimated protostellar outflow, as suggested by the match of the IRAS 05358+3543 outflow system to a shock entrainment model Beuther et al. (2002a), and by the correlation of outflow mass with source bolometric luminosity across outflows from both low-mass and high-mass stars Wu et al. (2004).
Finally, we note that since the outflowing gas entrains part of the envelope, we expect that the observed outflow rates exceed the sum of the masses being lost in the protostellar outflow and radiation-driven winds.
9 Limitations & Outlook
An important limitation of this study is the fact that the protostellar outflows are injected following a sub-grid prescription, rather than calculated from first principles. Unfortunately, determining the outflow launching forces accurately would require significantly better spatial resolution of the central regions. Achieving higher resolution with an explicit dynamical code requires short timesteps, so that the long-term evolution we studied here is so far accessible only using such an outflow prescription.
With a clear focus on disentangling the kinematic protostellar outflow feedback from the radiation pressure feedback, we considered an outflow-to-accretion-rate conversion factor of 0.01 only in this exploratory study. Because protostellar outflows and radiation interact, and do not simply add to each other’s effects, a range of outflow strengths should be considered in more detailed follow-up studies.
Also, shock waves driven into the surroundings when the outflow is launched would be even more important if the outflow were episodic. In our calculations the outflow momentum is determined from the stellar accretion rate, which in turn is governed mostly by the disk’s evolution (sect. 7 above). Hence the outflow evolves smoothly in time and weakens at later epochs. In contrast to this gradual evolution, similar collapse scenarios investigated in 3-D show long-term variations in the accretion rate due to gravitational torques from nonaxisymmetric density disturbances in the disk (Kuiper et al. 2011). Rapid accretion bursts also occur if the protostar and envelope are coupled together by the inward accretion flow and outward radiation forces (Kuiper & Yorke 2013b). Such an accretion history could mean episodic protostellar outflows driving repeated shocks into the surroundings. In this scenario, the outflow may never reach a quasi-stationary stage and its opening angle could be episodic also. This picture is best investigated including magnetic fields, so that the outflow launching is coupled to the magneto-hydrodynamical evolution of the infall, disk formation, and accretion flow.
The protostellar evolution of the forming star in the sink cell relies on the assumption that the accretion flow over the 10 AU sink cell radius denotes the actual stellar accretion rate. The potential formation of a binary or multiple stellar system within this region has not been taken into account. Hence, the resulting final stellar masses obtained in the simulations denote an upper mass limit of the most massive star of such a multiple system.
The stars’ growth continues much longer in our models including the protostellar outflows. The cause is the enhanced flashlight effect resulting from the clearing of the bipolar regions. The anisotropy in the thermal radiation could be stronger still if we included the accretion disk’s innermost optically thick dust-free region. Kuiper & Yorke (2013a) treated this region using temperature- and density-dependent mean gas opacities, while our simpler but longer-term calculations involve a constant (and generally lower) gas opacity. Accounting for both effects would likely result in an even longer disk accretion phase and lower accretion rates.
Finally, the disk lifetime is influenced by effects other than radiative acceleration, not accounted for in our simulations, including ionization, disk fragmentation under self-gravity, and the winds and UV radiation from nearby sources.
10 Summary
We numerically model the whole accretion phase of massive star formation, including the effects of protostellar outflows, stellar and thermal radiative feedback. We examine both the outflows’ direct kinematic feedback, and the indirect consequences for the later epoch of radiative feedback. To enable such long-term calculations, we restrict the simulations to (1) axially- and midplane-symmetric configurations and (2) launching the protostellar outflows using a sub-grid model.
The protostellar outflow and radiative forces together drive the surrounding material through two stages of evolution. At early times, kinematic feedback yields a bipolar outflow cavity whose shape comes from the collimation in the sub-grid launching model. At later times, radiative acceleration becomes significant and the outflow broadens. In addition, the protostellar outflow and radiative forces drive a high-momentum-flux wind along the disk’s upper (and lower) surface. These outflows ultimately entrain part of the envelope, reversing its infall and expelling it from the system. The outflow rates measured at the core’s outer edge are thus greater than those near the star and accretion disk.
The protostellar outflow’s kinematic feedback reduces the accretion rate onto the disk and ultimately onto the star, compared with calculations lacking the outflow. In later stages, however, the protostellar outflow cavities strengthen the flashlight effect, extending it from the starlight near the disk to the thermal radiation throughout the envelope. Although the thermal radiation forces are still significant, as they must be for such a luminous protostar, the flashlight effect means the thermal radiation ejects less of the envelope. For the cases considered here, the retained envelope material allows the star a longer accretion phase, more than balancing the decrease in accretion rate from the kinematic feedback. For the future it is desirable to examine whether this result holds for other initial conditions and ratios of outflow to accretion rate. Moreover, the final mass of the forming star depends on the lifetime of the circumstellar accretion disk, which could be influenced by several processes we have not included, such as ionization, magnetic fields, disk fragmentation, and UV radiation and winds from nearby sources. Nonetheless, the results of this study clearly show that long-term effects must be accounted for when investigating the final feedback efficiency of protostellar outflows.
Appendix A Convergence
For the simulations presented, we use a 2D static grid in spherical coordinates with maximum resolution . To check for numerical convergence, we compare one of the simulations with three additional simulation runs using a different resolution, namely with a factor of two lower, with a factor of two higher, and with a factor of four higher resolution in each dimension, respectively. The initial condition for these simulations are identical to the one with and an exponent of the density slope of . The factor two higher resolution run was computed up to 34 kyr of evolution. The factor four higher resolution run was computed up to 14.2 kyr of evolution, which marks the onset of the protostellar outflow launching. Due to the high speed of the outflow, the Courant-Friedrich-Levy condition on the numerical hydrodynamical timestep limits the realizability of longer-term and/or higher resolution studies.
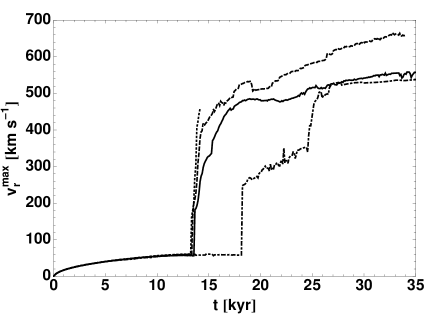
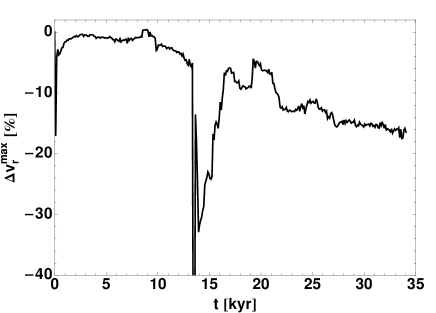
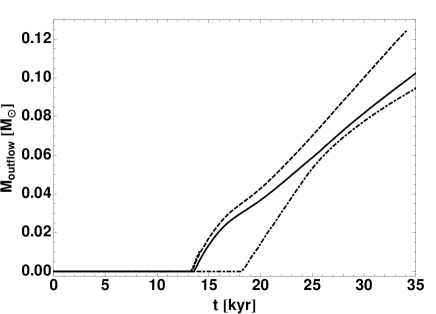
The resulting mass growth of the central star, the maximum velocity of the protostellar outflow, and the accumulated injected mass by the outflow without the entrainment is presented in Fig. 18.
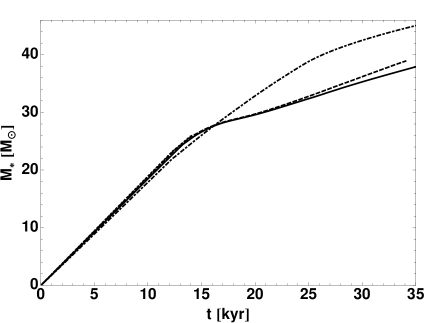
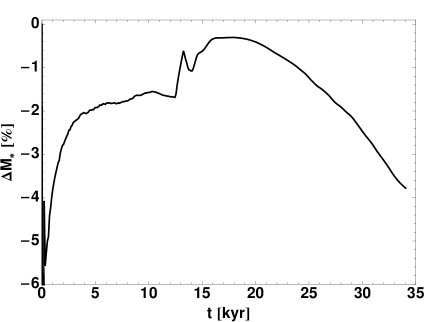
The stellar accretion rate is controlled by the large scale collapse at early times and the accretion disk physics at later times. The default resolution of our simulation runs is already high enough to follow the pressure scale height of the forming accretion disk; as a result, the differences in the stellar mass growth between the simulations with default or higher resolution stay below a few percent.
With respect to the outflow properties, the a priori defined angular distribution of the outflow velocity (Eq. 5) yields a faster outflow at the poles with increasing polar resolution as well as an earlier launching time (due to the higher velocity/momentum at the pole). Both effects are clearly visible in Fig. 18, middle and lower panel, at about 13 -18 kyr of evolution (the onset of outflow launching). After this difference in the launching time, the maximum velocity of the outflow remains within a 20% difference between the default resolution and the factor of two higher resolution run. As a side effect of the delayed outflow launching in the low resolution run, also the stellar mass growth of the low resolution differs visibly from the other runs in default and higher resolution due to the fact that accretion along the polar regions sustains for a longer period in time. The accumulated injected mass by the outflow agrees within 20% as well.
The dependence of the injected outflow velocity at the poles (see Eq. 5 within model section) on the numerical polar resolution in use makes it difficult to derive further conclusions. In principle, this dependence could have been avoided in the convergence study by computing the injected outflow velocity as the integral value of Eq. 5 over the polar extent of a grid cell rather than using the grid cell center as a reference point.
In conclusion, the quantitative results such as the outflow velocity and mass load differ on the 20% level and clearly depend on the sub-grid model of the outflow injection. A scan of the broad parameter space goes beyond the scope of this pioneering study. We also have to admit that a quantitative determination of the outflow quantities cannot be the aim of this study and would e.g. better be tackled within MHD simulations of the outflow launching process.
Our focus is the protostellar outflow feedback’s long-term consequences, including its influence on the radiation-pressure-dominated epoch. In a nutshell, the main conclusions are (a) the outflow amplifies the flashlight effect and the large-scale anisotropy of the core’s radiation field; as a result, (b) the core loses less mass, (c) a large reservoir of gas in the core’s outer region remains available for sustained feeding of the disk, and (d) radiation feedback is lessened, compensating for the outflow’s kinematic feedback so that growth in the super-Eddington regime is easier than expected. These findings are of general and qualitative interest, and, hence, adequately represented in the runs with the default grid resolution.
References
- Arce et al. (2007) Arce, H. G., Shepherd, D., Gueth, F., et al. 2007, in: Protostars and Planets V, ed. B. Reipurth, Bo Reipurth, D. Jewitt, K. Keil, 245
- Bally (2008) Bally, J. 2008, in: ASP Conf. Ser., vol. 387, Massive Star Formation: Observations Confront Theory, ed. H. Beuther, H. Linz, & T. Henning, 387, 158
- Banerjee & Pudritz (2007) Banerjee, R., & Pudritz, R. E. 2007, ApJ, 660, 479
- Beltran et al. (2011) Beltran, M. T., Cesaroni, R., Zhang, Q., et al. 2011, A&A, 532, 91
- Beuther et al. (2010a) Beuther, H., Linz, H., Bik, A., Goto, M., & Henning, T. 2010a, A&A, 512, 29
- Beuther et al. (2002a) Beuther, H., Schilke, P., Gueth, F., et al. 2002a, A&A, 387, 931
- Beuther et al. (2002b) Beuther, H., Schilke, P., Sridharan, T. K., et al. 2002b, A&A, 383, 892
- Beuther & Shepherd (2005) Beuther, H., & Shepherd, D. 2005, in: Cores to Clusters: Star Formation with Next Generation Telescopes, ed. M. S. Nanda Kumar, 105
- Beuther et al. (2010b) Beuther, H., Vlemmings, W. H. T., Rao, R., & van der Tak, F. F. S. 2010b, ApJL, 724, L113
- Bik et al. (2012) Bik, A., Henning, T., Stolte, A., et al. 2012, ApJ, 744, 87
- Bodenheimer et al. (1990) Bodenheimer, P., Yorke, H. W., Rozyczka, M., & Tohline, J. E. 1990, ApJ, 355, 651
- Bruderer et al. (2009) Bruderer, S., Benz, A. O., Doty, S. D., van Dishoeck, E. F., & Bourke, T. L. 2009, ApJ, 700, 872
- Cesaroni et al. (2013) Cesaroni, R., Massi, F., Arcidiacono, C., et al. 2013, A&A, 549, 146
- Commercon et al. (2011) Commercon, B., Hennebelle, P., & Henning, T. 2011, ApJL, 742, L9
- Cunningham et al. (2011) Cunningham, A. J., Klein, R. I., Krumholz, M. R., & McKee, C. F. 2011, ApJ, 740, 107
- Fallscheer et al. (2009) Fallscheer, C., Beuther, H., Zhang, Q., Keto, E. R., & Sridharan, T. K. 2009, A&A, 504, 127
- Forbrich et al. (2009) Forbrich, J., Stanke, T., Klein, R., et al. 2009, A&A, 493, 547
- Frank et al. (2014) Frank, A., Ray, T. P., Cabrit, S., et al. 2014, eprint arXiv, 1402, 3553
- Hennebelle et al. (2011) Hennebelle, P., Commercon, B., Joos, M., et al. 2011, A&A, 528, 72
- Hennemann et al. (2009) Hennemann, M., Birkmann, S. M., Krause, O., et al. 2009, ApJ, 693, 1379
- Hosokawa & Omukai (2009) Hosokawa, T., & Omukai, K. 2009, ApJ, 691, 823
- Hosokawa et al. (2010) Hosokawa, T., Yorke, H. W., & Omukai, K. 2010, ApJ, 721, 478
- Krumholz et al. (2007) Krumholz, M. R., Klein, R. I., & McKee, C. F. 2007, ApJ, 656, 959
- Krumholz et al. (2005) Krumholz, M. R., McKee, C. F., & Klein, R. I. 2005, ApJL, 618, L33
- Kuiper et al. (2010a) Kuiper, R., Klahr, H., Beuther, H., & Henning, T. 2010a, ApJ, 722, 1556
- Kuiper et al. (2011) —. 2011, ApJ, 732, 20
- Kuiper et al. (2012) —. 2012, A&A, 537, 122
- Kuiper et al. (2010b) Kuiper, R., Klahr, H., Dullemond, C. P., Kley, W., & Henning, T. 2010b, A&A, 511, 81
- Kuiper & Klessen (2013) Kuiper, R., & Klessen, R. S. 2013, A&A, 555, 7
- Kuiper & Yorke (2013a) Kuiper, R., & Yorke, H. W. 2013a, ApJ, 763, 104
- Kuiper & Yorke (2013b) —. 2013b, ApJ, 772, 61
- Laor & Draine (1993) Laor, A., & Draine, B. T. 1993, ApJ, 402, 441
- Linz et al. (2009) Linz, H., Henning, T., Feldt, M., et al. 2009, A&A, 505, 655
- Linz et al. (2010) Linz, H., Krause, O., Beuther, H., et al. 2010, A&A, 518, L123
- Matzner & McKee (1999) Matzner, C. D., & McKee, C. F. 1999, ApJL, 526, L109
- Mignone et al. (2007) Mignone, A., Bodo, G., Massaglia, S., et al. 2007, ApJS, 170, 228
- Moscadelli et al. (2013) Moscadelli, L., Li, J., Cesaroni, R., et al. 2013, A&A, 549, 122
- Murakawa et al. (2013) Murakawa, K., Lumsden, S. L., Oudmaijer, R. D., et al. 2013, MNRAS, 436, 511
- Palau et al. (2013) Palau, A., Contreras, C. S., Sahai, R., Sánchez-Monge, Á., & Rizzo, J. R. 2013, MNRAS, 428, 1537
- Peretto et al. (2013) Peretto, N., Fuller, G. A., Duarte-Cabral, A., et al. 2013, A&A, 555, 112
- Peters et al. (2012) Peters, T., Klaassen, P. D., Low, M.-M. M., Klessen, R. S., & Banerjee, R. 2012, ApJ, 760, 91
- Peters et al. (2014) Peters, T., Klaassen, P. D., Low, M.-M. M., et al. 2014, ApJ, 788, 14
- Ray et al. (2007) Ray, T. P., Dougados, C., Bacciotti, F., Eislöffel, J., & Chrysostomou, A. 2007, in: Protostars and Planets V, ed. B. Reipurth, Bo Reipurth, D. Jewitt, K. Keil, 231
- Sánchez-Monge et al. (2013) Sánchez-Monge, Á., López-Sepulcre, A., Cesaroni, R., et al. 2013, A&A, 557, 94
- Seifried et al. (2012) Seifried, D., Pudritz, R. E., Banerjee, R., Duffin, D. F., & Klessen, R. S. 2012, MNRAS, 422, 347
- Sepúlveda et al. (2011) Sepúlveda, I., Anglada, G., Estalella, R., et al. 2011, A&A, 527, 41
- Sheikhnezami et al. (2012) Sheikhnezami, S., Fendt, C., Porth, O., Vaidya, B., & Ghanbari, J. 2012, ApJ, 757, 65
- Shepherd (2005) Shepherd, D. 2005, in: IAU Symp. Proc. 227, Massive star birth: A crossroads of Astrophysics, ed. R. Cesaroni, M. Felli, E. Churchwell, & C. M. Walmsley (Cambridge: Cambridge Univ. Press), 227, 237
- Vaidya et al. (2011) Vaidya, B., Fendt, C., Beuther, H., & Porth, O. 2011, ApJ, 742, 56
- Wang et al. (2010) Wang, P., Li, Z.-Y., Abel, T., & Nakamura, F. 2010, ApJ, 709, 27
- Wang et al. (2011) Wang, Y., Beuther, H., Bik, A., et al. 2011, A&A, 527, 32
- Wu et al. (2004) Wu, Y., Wei, Y., Zhao, M., et al. 2004, A&A, 426, 503
- Yorke & Bodenheimer (1999) Yorke, H. W., & Bodenheimer, P. 1999, ApJ, 525, 330
- Yorke & Kaisig (1995) Yorke, H. W., & Kaisig, M. 1995, Computer Physics Communications, 89, 29
- Yorke & Richling (2002) Yorke, H. W., & Richling, S. 2002, Ionized Gaseous Nebulae, 12, 92
- Yorke & Sonnhalter (2002) Yorke, H. W., & Sonnhalter, C. 2002, ApJ, 569, 846