Reconciliation of local and long range tilt correlations in underdoped La2-xBaxCuO4 ()
Abstract
A long standing puzzle regarding the disparity of local and long range CuO6 octahedral tilt correlations in the underdoped regime of La2-xBaxCuO4 is addressed by utilizing complementary neutron powder diffraction and inelastic neutron scattering (INS) approaches. Long-range and static CuO6 tilt order with orthogonally inequivalent Cu-O bonds in the CuO2 planes in the low temperature tetragonal (LTT) phase is succeeded on warming through the low-temperature transition by one with orthogonally equivalent bonds in the low temperature orthorhombic (LTO) phase. In contrast, the signatures of LTT-type tilts in the instantaneous local atomic structure persist on heating throughout the LTO crystallographic phase on the nanoscale, although becoming weaker as temperature increases. Analysis of the INS spectra for the composition reveals the dynamic nature of the LTT-like tilt fluctuations within the LTO phase and their 3D character. The doping dependence of relevant structural parameters indicates that the magnitude of the Cu-O bond anisotropy has a maximum at doping where bulk superconductivity is most strongly suppressed, suggesting that the structural anisotropy might be influenced by electron-phonon coupling and the particular stability of the stripe-ordered phase at this composition. The bond-length modulation that pins stripe order is found to be remarkably subtle, with no anomalous bond length disorder at low temperature, placing an upper limit on any in-plane Cu-O bondlength anisotropy. The results further reveal that although appreciable octahedral tilts persist through the high-temperature transition and into the high temperature tetragonal (HTT) phase, there is no significant preference between different tilt directions in the HTT regime. This study also exemplifies the importance of a systematic approach using complementary techniques when investigating systems exhibiting a large degree of complexity and subtle structural responses.
pacs:
74.72.Dn, 74.72.-h, 61.12.-q,I Introduction
Since the discovery of high-temperature superconductivity in La2-xBaxCuO4 Bednorz and Müller (1986), the connection between the lattice and electronic structures has been the subject of considerable attention Jorgensen et al. (1987); Paul et al. (1987). The further discovery Moodenbaugh et al. (1988) of the “1/8 anomaly”—a dramatic dip in the superconducting transition temperature at the dopant concentration of —motivated careful powder diffraction studies of the structural phase diagram Axe et al. (1989); Suzuki and Fujita (1989a); Cox et al. (1989); Billinge et al. (1993). The latter revealed a low temperature transition ( K) to a crystal structure with inequivalent Cu-O bonds in orthogonal directions within the CuO2 planes. It is this structural anisotropy, associated with a particular pattern of tilts of the CuO6 octahedra, that pins charge stripes Tranquada et al. (1995); Fujita et al. (2004). While the charge stripes are compatible with superconducting correlations within the CuO2 planes Li et al. (2007); Tranquada et al. (2008), the rotation of the structural anisotropy from one layer to the next leads to frustration of the interlayer Josephson coupling and the depression of the onset of bulk superconducting order Berg et al. (2009); Himeda et al. (2002).
Given the strong response of the electronic properties to the crystal symmetry, it is of considerable interest to understand the nature of the structural transitions in La2-xBaxCuO4. Both powder Suzuki and Fujita (1989b); Billinge et al. (1993) and single-crystal Zhao et al. (2007); Hücker et al. (2011a); Wen et al. (2012) diffraction studies clearly demonstrate that the transition to the low-temperature structure, involving a change in tilt direction of the CuO6 octahedra, is of first order. A surprisingly different perspective is given by a pair-distribution-function (PDF) analysis of neutron scattering measurements Billinge et al. (1994a). In the latter analysis, the local structure appears to be unaffected by warming through the transition, retaining the low-temperature tilt pattern to higher temperatures. That picture is supported by an x-ray absorption fine structure (XAFS) study Haskel et al. (2000). Furthermore, the local tilts appear to remain in the high-temperature phase where the average tilts are zero Haskel et al. (2000); Božin et al. (1997); Fabbris et al. (2013). The aim of the present paper is to resolve the apparent conflict between local and long-range measures of tilt correlations in La2-xBaxCuO4.
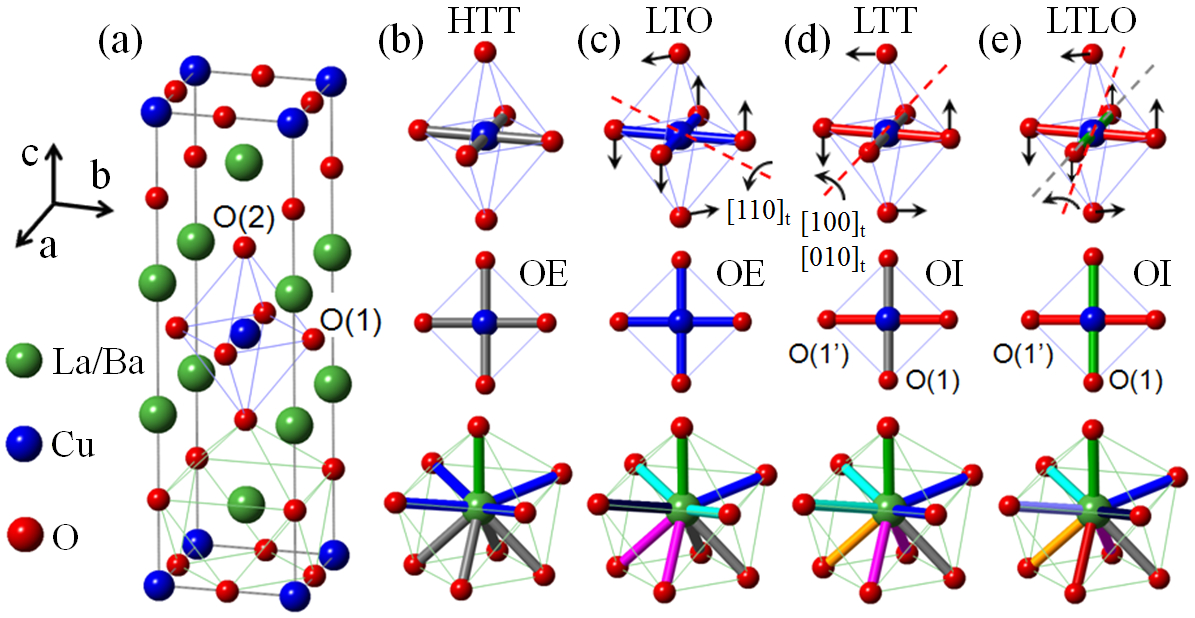
In terms of the symmetry of the average structure, the thermal sequence of structural transitions is well understood Axe and Crawford (1994). The high-temperature tetragonal (HTT) phase (space group ) has the highest symmetry, with no octahedral tilts (see Fig. 1); here, the in-plane lattice parameters, , correspond to the shortest Cu-Cu distance. On cooling, there is a second-order transition to the low-temperature orthorhombic (LTO) phase (space group ), involving tilts of the CuO6 octahedra about [110]t axes of the HTT phase; as nearest-neighbor octahedra must rotate in opposite directions, the unit cell volume increases by a factor of two, with . (This is the structure of La2-xSrxCuO4 in the superconducting phase Radaelli et al. (1994).) Further cooling leads to a second transition involving a change in the octahedral tilt axis towards the and directions. When the shift in the tilt axis is complete, the structure is the low-temperature tetragonal (LTT; space group ), while a partial shift results in the low-temperature less-orthorhombic (LTLO; space group ); in both cases, the unit cell size is the same as for LTO.
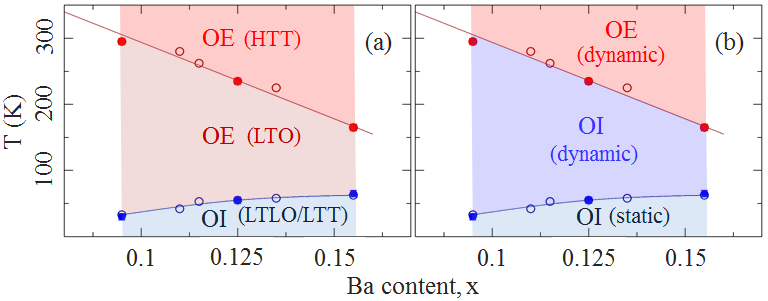
For charge ordering, the key distinction among these different phases is the degree of symmetry among the Cu-O bonds. The tilt pattern in the LTO phase leaves the Cu-O bonds in (approximately) orthogonal directions equivalent; we will denote such a symmetry as “orthogonal equivalent” (OE). In contrast, the tilt of an octahedron about a axis, as in the LTT phase, leaves two in-plane oxygens within the CuO2 plane but shifts the orthogonal pair above and below the plane, resulting in two different Cu-O bond lengths. We will label this case as “orthogonal inequivalent” (OI), and note that the LTLO phase also has an OI symmetry. The phase diagram for the relevant range of doping in La2-xBaxCuO4 is shown in Fig. 2(a).
The structural transformations have been analyzed in terms of a Landau-Ginzburg model, in which the degenerate octahedral tilts about and axes are taken as the order parameters Axe et al. (1989); Axe and Crawford (1994). When only one order parameter is finite, one obtains the LTO phase; when both are finite and equal, the structure is LTT. This model allows an elegant analysis of the phase diagram, and predicted the possible occurrence of the LTLO phase as confirmed in a closely-related system Crawford et al. (1991). It has also motivated detailed studies of the octahedral tilts in La2-xSrxCuO4 Birgeneau et al. (1987); Thurston et al. (1989); Kimura et al. (2000), La1.65Nd0.35CuO4 Keimer et al. (1993), and La2-xBaxCuO4 Kimura et al. (2005); Wakimoto et al. (2006); however, these studies have been done at points of reciprocal space that have a finite structure factor for both LTO and LTT-like tilts. Hence, while these measurements have been interpreted in terms of LTO-like (OE) tilts, they could not uniquely distinguish the fluctuations from LTT-like (OI) tilts.
Helpful guidance is provided by a calculation of the potential-energy surface as a functional of octahedral tilts performed with density functional theory for a rough model of La2-xBaxCuO4 with Pickett et al. (1991). The calculation finds that the lowest energy is given by LTT tilts, with local minima corresponding to LTO tilts higher in energy by about 15 meV. It was proposed that the LTO phase might be stabilized with increasing temperature due to the entropy associated with low-energy octahedral tilt fluctuations Pickett et al. (1991). This proposal gained support from a Monte Carlo study of the temperature dependence of a model including both the mean-field potential energy and interactions between neighboring octahedra Cai and Welch (1994). The latter calculation yielded evidence for strong local LTT-like tilt amplitudes throughout the LTO phase.
In this paper, we present neutron total scattering measurements on polycrystalline samples of La2-xBaxCuO4 with , 0.125, and 0.155 obtained as a function of temperature. We analyze these data sets both by Rietveld refinement and by the pair distribution function analysis technique. The two approaches yield complementary evidence for dynamical LTT-like tilts within the LTO phase, as well as local tilt fluctuations in the HTT phase. We directly confirm the LTT-like tilt fluctuations in the LTO phase through inelastic neutron scattering measurements on a single crystal of La2-xBaxCuO4 with .
The rest of the paper is organized as follows: In Sec. II we describe the experimental and analysis methods, and the choice of reciprocal lattice used to index the reflections. In Sec. III we present three subsections dedicated to our results on average crystal structure, local structure, and octahedral tilt dynamics. In Sec. IV we discuss the various properties as a function of the nominal Ba content and temperature, compare our results with the literature, and in Sec. V finish with a short summary.
II Experimental
Finely pulverized samples of La2-xBaxCuO4, with Ba-content in the range, as well as an undoped La2CuO4 polycrystalline reference, were grown using standard solid state protocols; these were used for the total scattering atomic PDF experiments. Neutron time-of-flight measurements were carried out on the NPDF instrument at Los Alamos Neutron Scattering Center at Los Alamos National Laboratory. Powders (15 grams each) were loaded under helium atmosphere into standard extruded vanadium containers and sealed. Temperature dependent measurements in the range were performed using a closed cycle cryo-furnace sample environment for 2 hours at each temperature on each sample, yielding good statistics and a favorable signal to noise ratio at high momentum transfers. Raw data were normalized and various experimental corrections performed following standard protocols Egami and Billinge (2012). High resolution experimental PDFs were obtained from the Sine Fourier transform of the measured total scattering structure functions, , over a broad range of momentum transfers, ( Å-1). Data reduction to obtain the PDFs, , was carried out using the program PDFGETN Peterson et al. (2000). The average structure was assessed through Rietveld refinements Rietveld (1967) to the raw diffraction data using GSAS Larson and Von Dreele (1987) operated under EXPGUI Toby (2001), utilizing I4/mmm (HTT), Bmab (LTO), P42/ncm (LTT), and Pccn (LTLO) models from the literature Hücker et al. (2011b). Structural refinement of PDF data was carried out using PDFFIT2 operated under PDFGUI Farrow et al. (2007) using the same models.
The single crystal of La2-xBaxCuO4 with was grown using the traveling-solvent floating zone method and has been characterized previously, as described elsewhere Hücker et al. (2011a). The crystal, of size mm, was studied by inelastic neutron scattering using the HYSPEC instrument (beam line 14B) at the Spallation Neutron Source, Oak Ridge National Laboratory Winn et al. (2014). For the experiment on HYSPEC, the crystal was mounted in a Displex closed-cycle cryostat. With the axis vertical, scattering wave vectors are in the horizontal scattering plane. A fixed incident energy of 27 meV and a chopper frequency of 300 Hz were used for all data shown here, and the graphite-crystal array in the incident beam was put in the flat mode (no vertical focusing) to improve the resolution along . For a typical measurement, the position-sensitive detector tank was placed at a particular mean scattering angle, and then measurements were collected for a series of sample orientations, involving rotations about the vertical axis in steps of . From such a set of scans, a four-dimensional data set was created and analyzed with the MANTID Arnold et al. (2014) and DAVE Azuah et al. (2009) software packages. Slices of data corresponding to particular planes in energy and wave-vector space can then be plotted from the larger data set. Wave vectors will be expressed in units of with Å and Å, corresponding to the LTT phase.
The measurements of the soft phonon that tilts along the Cu-O bonds were performed in the vicinity of the (330) position, which corresponds to a superlattice peak in the LTT but not the LTO phase. To sample the fluctuations associated with the tilts of the LTO phase, it was necessary to tilt the sample so as to put (032) in the scattering plane. We then looked at the behavior along .
III Results
III.1 Average crystal structure
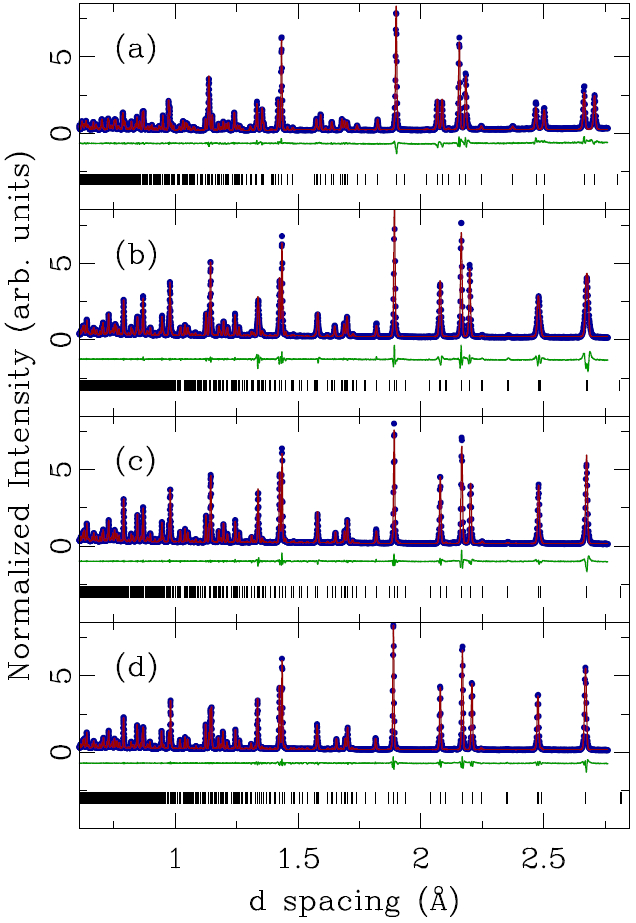
Typical Rietveld fits are shown in Fig. 3 for reference. The resulting temperature evolution of the in-plane lattice parameters is shown in Fig. 4, where the vertical dashed lines indicate the temperatures of the structural phase transitions. These are in good agreement with published work Hücker et al. (2011a), as indicated in the phase diagram shown in Fig. 2.
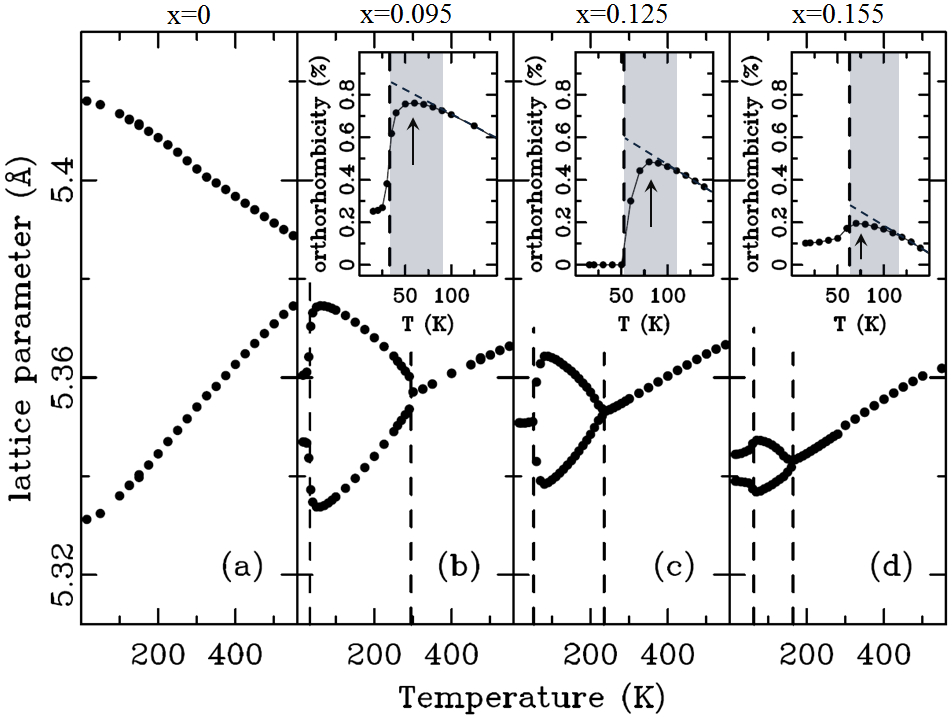
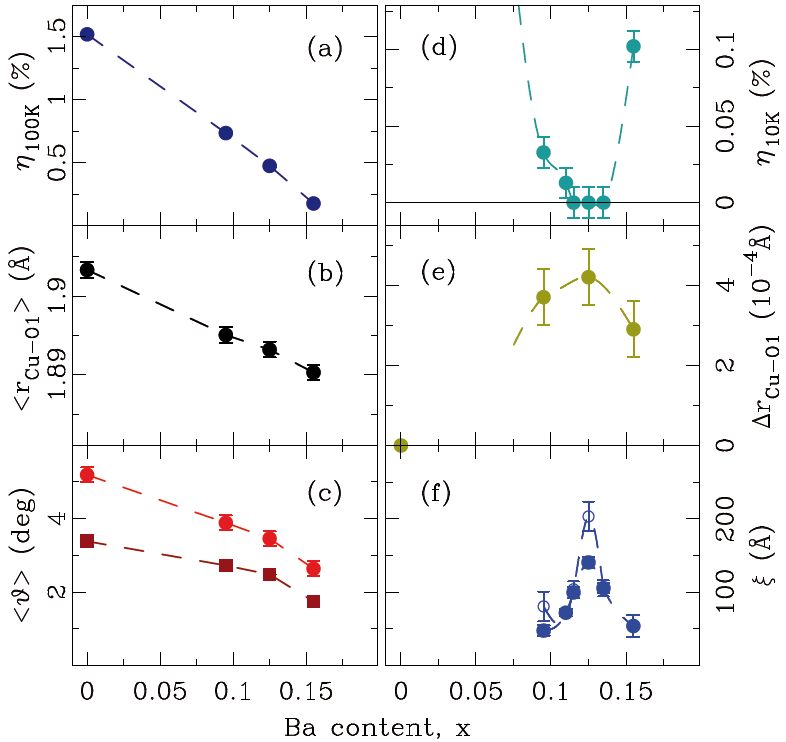
Figure 5 shows the evolution of the Rietveld refined average in-plane Cu-O distances. Undoped La2CuO4 is in the LTO phase down to the lowest temperature and has a single Cu-O planar-bond length (solid black circles in all panels of Fig. 5), highlighting the OE nature of the LTO tilts. The biggest effect on doping is a significant shortening of the average Cu-O bond-length, highlighted by the red arrows in Fig. 5. This is due to the decrease in electronic charge in the Cu-O bonds, which are stabilized because charge is removed from anti-bonding states. At low temperature, where the doped samples enter the LTT/LTLO phase Hücker et al. (2011a), Rietveld analysis reveals two distinct Cu-O bond-lengths consistent with the OI tilts.
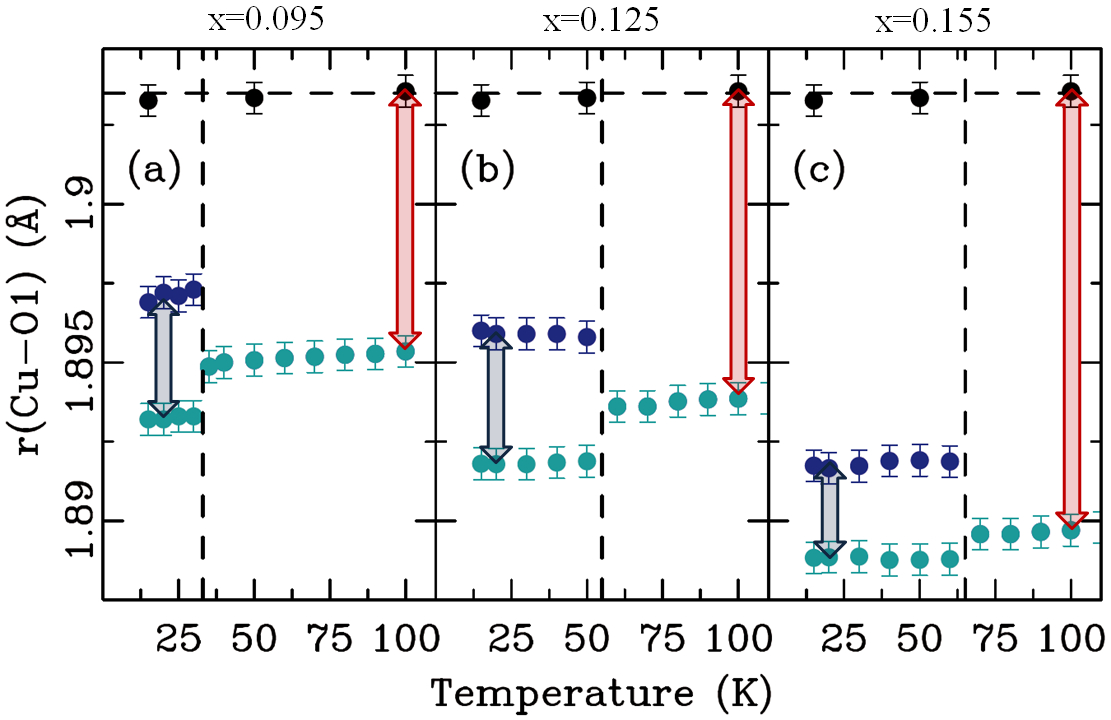
It is noteworthy that the difference in the in-plane Cu-O bondlengths of doped samples at base temperature is quite small—0.005(1) Å at most at 20 K, as indicated by the blue double arrows in Fig. 5(a)-(c). This may be compared to the distortions of 0.25 Å observed in the ground state of LaMnO3 due to the cooperative Jahn-Teller effect Qiu et al. (2005); Božin et al. (2008), which are nearly two orders of magnitude larger. Nonetheless, because they are long-range ordered and can be observed crystallographically, such a small difference in the average bond-lengths can be reliably measured, giving us a direct indication of the broken symmetry between orthogonal Cu-O bonds. Notably, despite the average tilt angles decreasing monotonically with increasing doping we see that the bond length mismatch (the difference between the and bond lengths) increases from to before decreasing again at , suggesting a stronger electronic stabilization of the orthogonal inequivalency around doping.
The first-order character of the low-temperature transition has a signature in the temperature dependence of the orthorhombic strain, shown in the insets to Fig. 4 (b)-(d). On cooling through the LTO phase, the strain grows with decreasing temperature. This growth slows as the low-temperature transition is approached so that at 30 K above the low- transition the average orthorhombicity even decreases, followed by a sharp drop at the transition. The small decrease in strain on approaching the transition is consistent with the presence of a 2-phase coexistence region, as identified in past studies Billinge et al. (1993, 1994b); Hücker et al. (2011a); Wen et al. (2012).
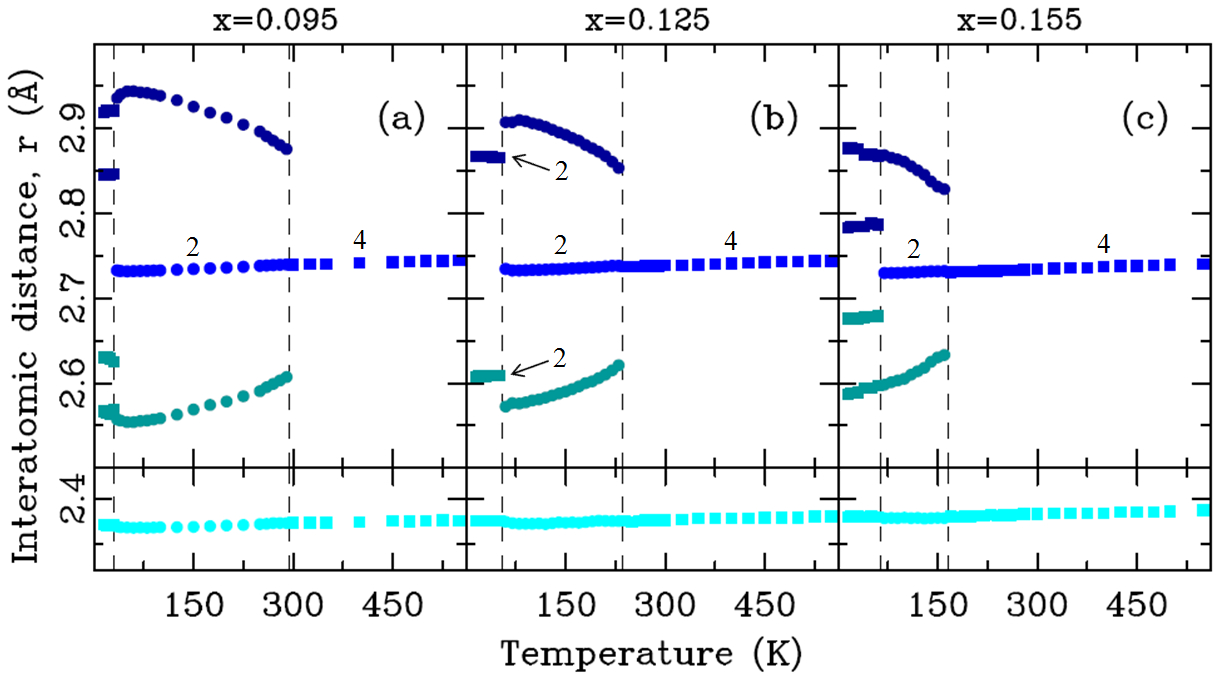
If the LTO-HTT transition were purely displacive, then we would expect a continuous variation of structural parameters on passing through it. Figure 6 demonstrates that this is not the case: the longer La-O2 bonds (O2 = apical oxygen) are split into three distances in the LTO phase, and this splitting abruptly drops to zero at the transition to the HTT phase. Given the clear evidence that the transition is second order Zhao et al. (2007); Hücker et al. (2011a), the apparent jump in the bond lengths must be an artifact of the Rietveld refinement. The La-O2 bond length is affected most strongly by displacements of the apical oxygens, associated with octahedral tilts. If there are disordered tilts present in the LTO phase, then the fitting process may result in unrealistic O2 displacements to compensate for the associated impact on Bragg peak intensities. Note that in the fitting, we have assumed isotropic mean square atomic displacements, where is the displacement of an atom at site and the average is over all equivalent sites in the sample. It follows that anisotropic fluctuations of the apical oxygens, such as occur in tilt fluctuations, might be modeled by finite displacements, even when the true average static displacement is essentially zero (just below the transition).
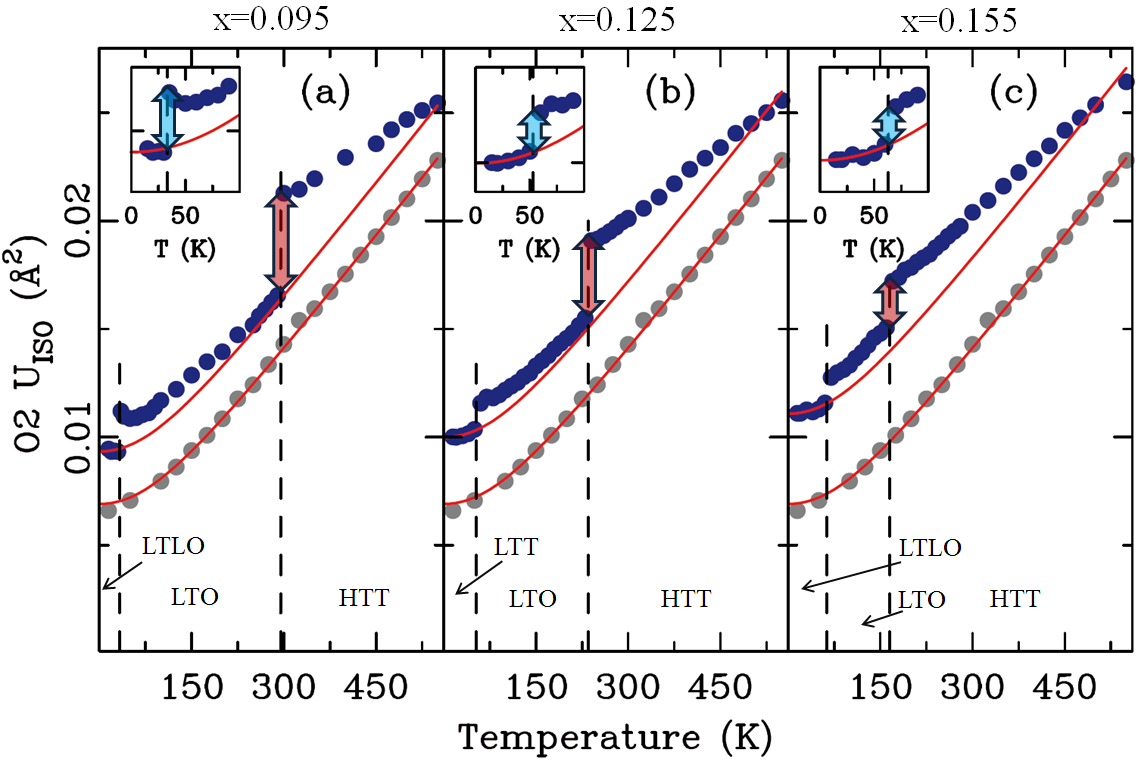
If the disordered tilts change continuously across the transition, then we should expect to see an anomalous jump in for O2 on entering the HTT phase. Figure 7 shows that this, indeed, is the case. In fact, there is also a jump at the low-temperature transition, indicating that there are anisotropic fluctuations present in the LTO phase that cannot be compensated by adjusting the symmetry-allowed atomic displacements. The lower red curve corresponds to a Debye-model fit Debye (1912) to the O2 of La2CuO4 (gray circles). This involves two parameters, the Debye temperature , and an offset factor Knox et al. (2013); Božin et al. (2014); the behavior for La2CuO4 is well described by the parameter values of 500(2) K and of 0.0023(2) Å2. In the other Figure panels, in each case the upper red curve is obtained by adding a doping-dependent offset to match the experimental values at the lowest temperature, but keeping the Debye temperature the same as that obtained for the undoped end-member. The offset grows with Ba concentration, which is consistent with the disorder in O2 positions induced by Ba substitution for La Haskel et al. (2000). It appears to capture the underlying trend in each case, with the excess disorder associated with the jumps gradually becoming indistinguishable from the thermal effects with increasing temperature. This is in agreement with earlier observations in La2-xBaxCuO4 and La2-xSrxCuO4 of persisting local tilt fluctuations across these macroscopic phase transitions Billinge et al. (1994c); Božin and Billinge (1998); Božin et al. (1998, 1999). Similar anomalies have been seen in other systems, where they are typically ascribed either to the inadequacy of the structural model used, or sometimes more specifically to the presence of nanoscale structural features, such as broken symmetry states, that do not propagate over long length-scales Božin et al. (2010); Knox et al. (2013, 2014); Božin et al. (2014).
III.2 Local structure
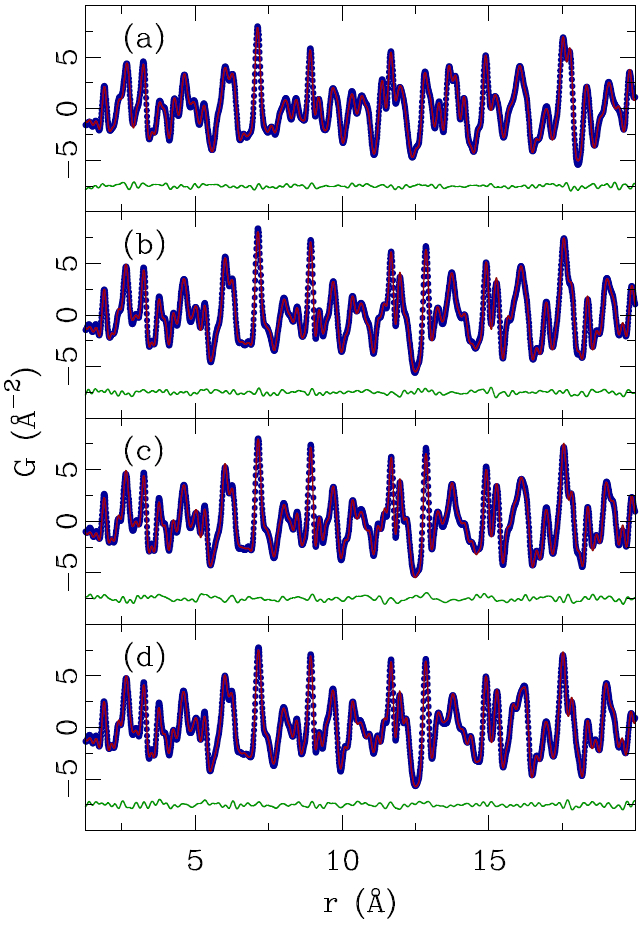
Using the same neutron scattering data, we have characterized the local structure of La2-xBaxCuO4 by the PDF approach. Figure 8 shows PDF fits over intermediate -ranges at 15 K using the average structure models, establishing the overall data quality and displaying that good fits can be obtained on this length scale. Here, we have taken account of the correlated motion of short interatomic bonds Jeong et al. (1999); Proffen and Billinge (1999) by defining the mean-square relative displacement of atoms at positions and , separated by distance , as
| (1) |
where the parameter is fixed at 1.6 Å for all PDF calculations in this paper.
To explore the origin of enhanced mean-square displacements in the Rietiveld refinements shown in Fig. 7, we focus on the very local structure. We first evaluate the expected effects on the PDF of the symmetry change across the low-temperature transition in the case where the local and average structures agreed. Fig. 9(b)-(d) shows a comparison of PDFs simulated using parameters from the Rietveld refinements at base temperature (blue profile, OI model) and at the temperature of maximum orthorhombic strain (red profile, OE model), bracketing the low temperature transition in the doped samples. The changes expected in the PDF across the transition are clearly observable in the respective difference curves, with the strongest features just below 3 Å (marked by arrows), corresponding to La–O2 bonds.
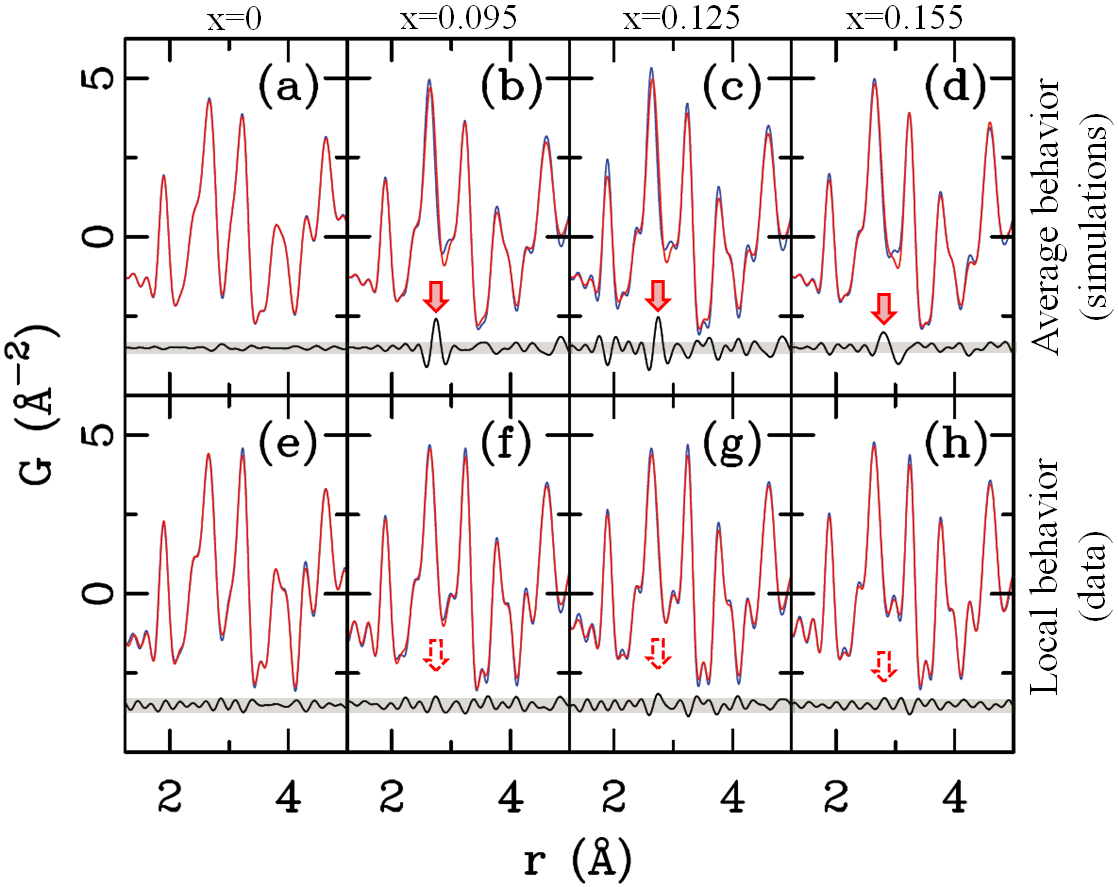
The actual measured PDFs at the same temperatures are shown in Fig. 9(f)-(h). The difference curves show nothing above the noise level, indicating the absence of change in the local structure across the transition, in contrast to the predictions from the average structure. In fact, the temperature difference is similar to that observed in pure La2CuO4, Fig. 9(e), where there is no change in the average structure. These results are consistent with earlier work Billinge et al. (1994c).
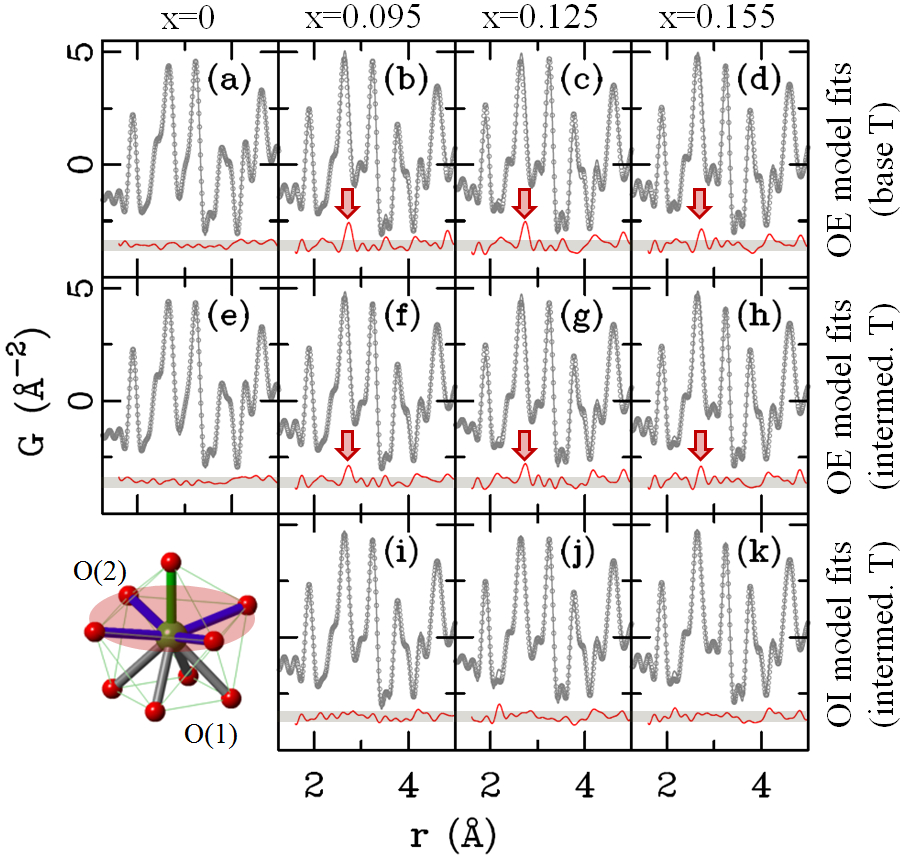
Further confirmation of this comes from explicit short range PDF modeling that was carried out using both OE-type and OI-type models fit to the data at base temperature and at the maximum orthorhombicity temperature in the doped samples. These fits are shown in Fig. 10. While the OE-type model readily explains the La2CuO4 data at both base and intermediate temperature, Fig. 10(a) and (e), it gives an unsatisfactory fit to the region of the La–O2 bonds in the doped samples. Such a discrepancy at base temperature (Fig. 10(b)-(d)) is expected, since the underlying atomic structure there is OI. At the temperature of maximum orthorhombic strain, the discrepancy with the OE fits remains, as shown in Fig. 10(f)-(h), whereas OI fits do much better, as indicated in Fig. 10(i)-(k).
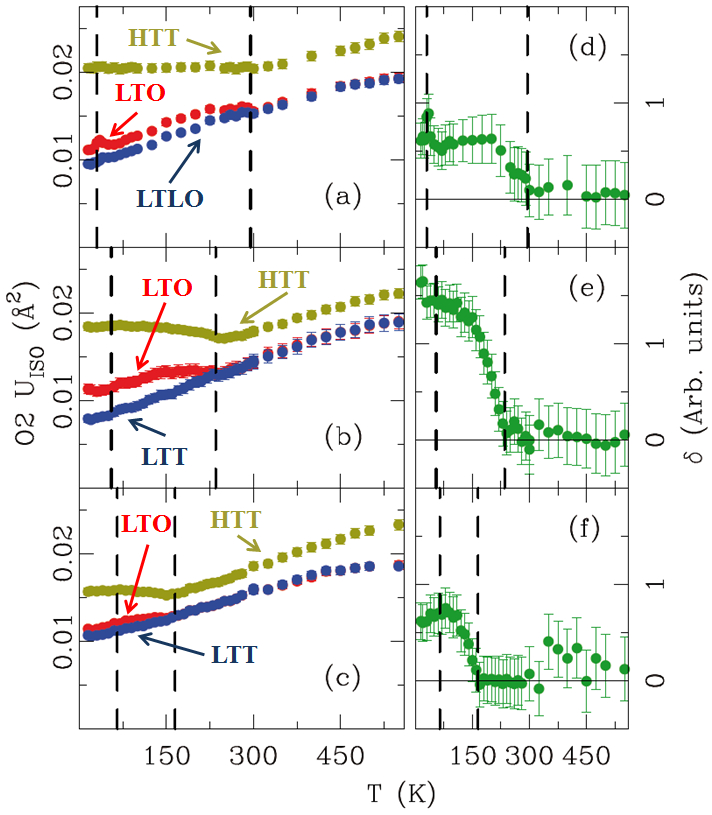
We saw previously that provides a distinctive measure of the tilt disorder that cannot be simulated by the symmetry-allowed structural parameters in the Rietveld refinements. We now consider the behavior of obtained from fits to the PDF data (for the range Å), as shown in Fig. 11(a)–(c). At each temperature, separate fits have been performed with the LTT (LTLO), LTO, and HTT models. At all temperatures, we find that the -factor, measuring the quality of fit, is always smallest for LTT (LTLO), followed by LTO, and then HTT. As one can see, from the LTT (LTLO) fit shows a monotonic increase with temperature, with no anomalies at the transition temperatures. The LTO fit is consistent with LTT at high temperature, but is larger in the LTO and LTT phases. The results for HTT are considerably larger at all temperatures.
As a measure of the distinctly OI tilts, we define the parameter as
| (2) |
where is the difference in parameter values obtained from the LTO and LTT (LTLO) fits, normalized to the square of the average transverse displacement of the O(2) site in the LTT phase at low temperature, . The temperature dependence of is plotted in Fig. 11(d)–(f) for the doped samples. For , we find evidence for substantial OI tilts throughout the LTO phase, with a reduced magnitude for and 0.155. On entering the HTT phase, we have already seen evidence that tilt disorder is present; however, the fact that suggests that there is little preference between OI and OE tilts at high temperature. It is consistent with the idea that, in the HTT phase, the Cu-O(2) bond precesses rather smoothly around the axis as discussed before Axe et al. (1989); Pickett et al. (1991); Isaacs et al. (1994).
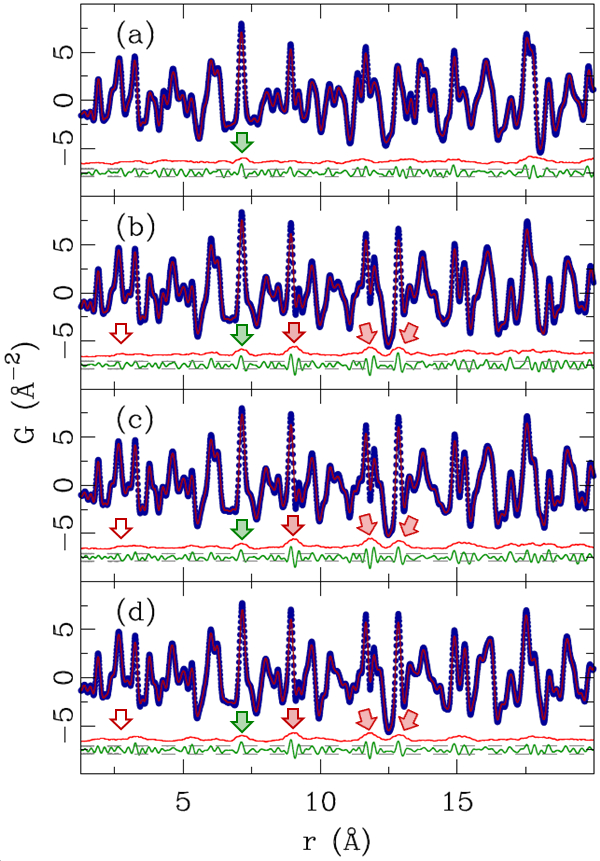
We now address the length-scale of the local OI tilts. This can be obtained qualitatively from a direct comparison of the experimental PDF data at 15 K and 100 K (well above the phase coexistence region) for all samples studied. This is shown in Fig. 12(a)-(d). Panel (a) shows the result for La2CuO4; only small differences are seen in the PDFs beyond the expected uncertainties (e.g., indicated by the green arrow), and these provide a measure of the signal we should expect due to thermal effects within the same phase. From Fig. 12(b)–(d), it is clear that in the doped samples there are additional signals in the difference curve, starting near a distance of 9 Å, that are reproducible from sample to sample and especially evident in the running average of the difference curve (red curve). This suggests that the OI tilt correlations within the LTO phase have a correlation length that is Å.
The PDF analysis presented here is based on total scattering data that do not discriminate between the elastic and inelastic scattering channels, and hence the PDF does not distinguish whether the underlying short-range features are static or dynamic. This is in contrast to the Rietveld analysis, which is sensitive only to the time-averaged information in the Bragg peaks; the inelastic information is largely in the tails of the Bragg peaks. To test the static or dynamic character, we turn next to inelastic neutron scattering on a single crystal, focusing on La2-xBaxCuO4 with .
III.3 Octahedral tilt dynamics
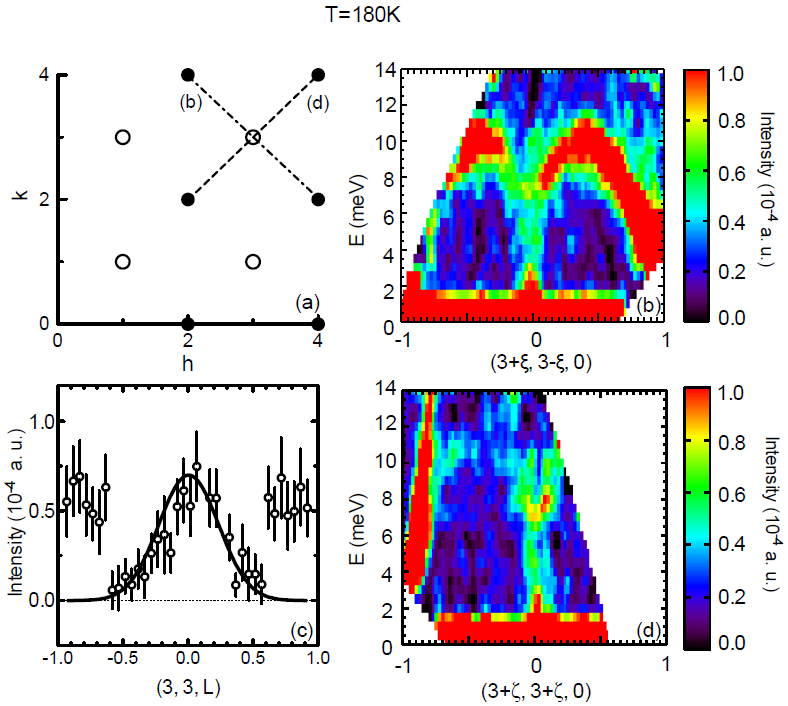
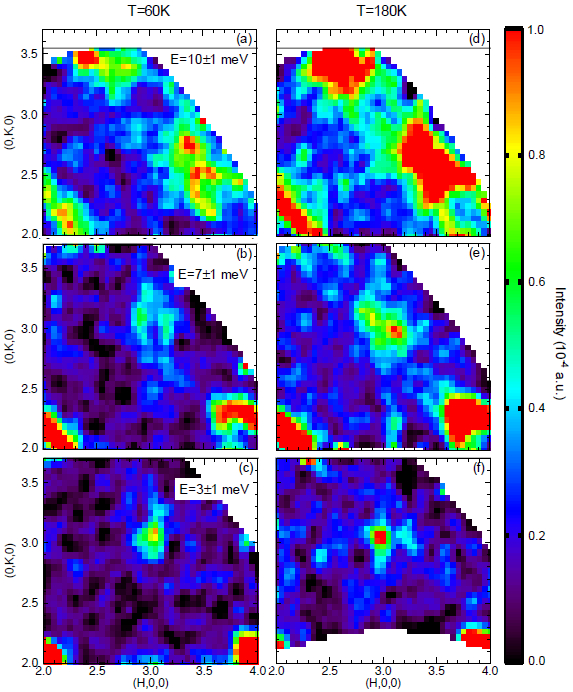
The inelastic scattering about the (330) reciprocal point of our La2-xBaxCuO4 with is shown in Fig. 13. The cuts in reciprocal space that were taken are shown schematically in Fig. 13(a). Figures 13(b) and (d) show the dispersion of excitations along the transverse and longitudinal directions, respectively, within the LTO phase at K. In both cases, one can see a soft phonon with intensity that can be resolved between 2 and 10 meV. In the transverse direction, these excitations connect to the transverse acoustic modes dispersing from the neighboring (240) and (420) fundamental Bragg points. Another perspective is given by the constant energy slices shown in Fig. 14 for several different energies, where we compare with results at 60 K, slightly above the low-temperature transition. For dispersion in the longitudinal direction, the intensity becomes quite weak as one moves away from the (330) point. Figure 13(c) shows that the excitations, integrated between 2 and 4 meV, have a finite width along , demonstrating that the LTT tilt fluctuations have 3D character.
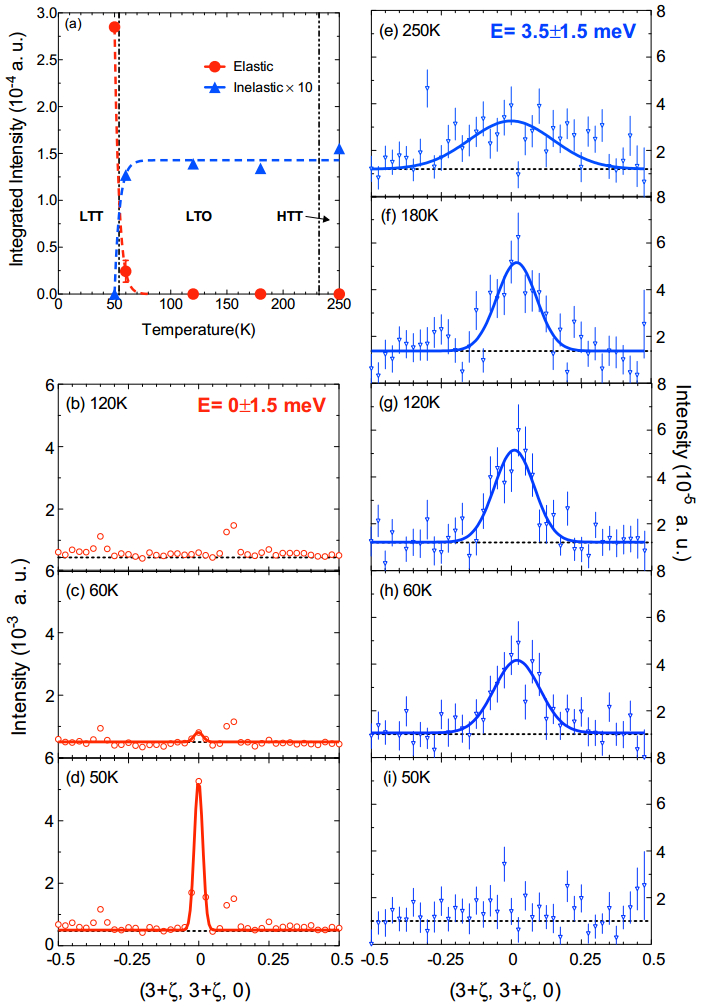
The temperature dependence of the scattering near (330) is presented in Fig. 15. There is a clear superlattice reflection at (330) in the LTT phase at 50 K. Warming to 60 K, just across the transition to the LTO phase, very weak elastic scattering is still detectable; however, this is completely gone at 120 K. In contrast, soft phonon fluctuations (integrated over 2 to 5 meV) centered at (330) are clearly seen in the LTO phase and even in the HTT, at 250 K. At 50 K, the intensity from the soft fluctuations has all condensed into the elastic superlattice peak. (There must be acoustic phonons dispersing out of the superlattice peak, but these are too weak for us to detect.) The temperature dependences of both the elastic and inelastic signals are summarized in Fig. 15(a).
The correlation length for the LTT-like tilts within the LTO phase can be estimated from the -width of the soft-phonon scattering. Taking the inverse of the half-width-at-half-maximum for the fitted peaks in Fig. 15(e-h), we find an effective correlation length of Å in the LTO phase, decreasing to about half of that in the HTT phase. This is consistent with estimate of Å obtained from the PDF analysis.
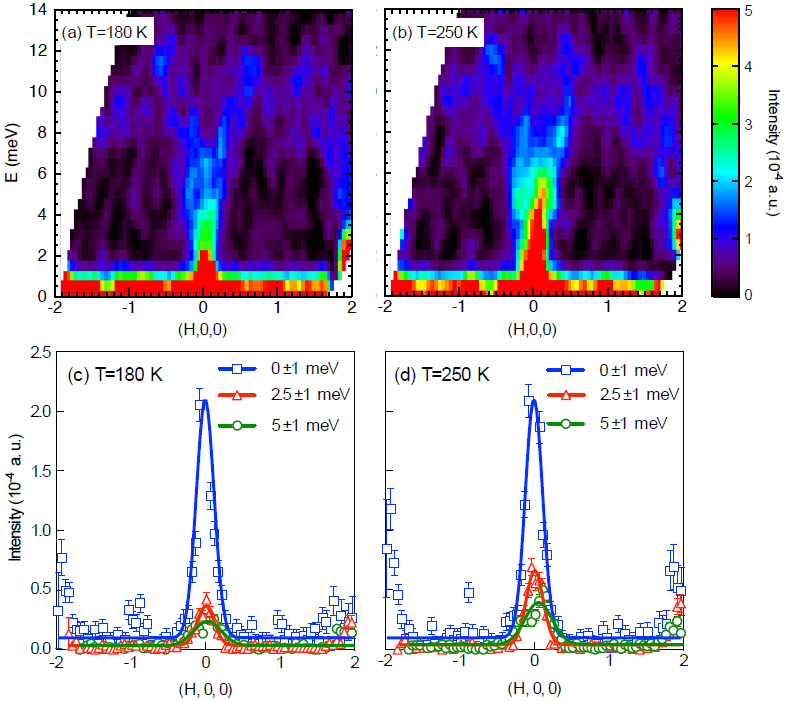
For comparison, Fig. 16 (a) and (b) show the dispersion of tilt fluctuations in the transverse direction about the (032) position (an LTO superlattice peak) in the LTO and HTT phases, respectively. The intensity is much stronger than at (330) because of a much larger structure factor. There is substantial intensity from soft tilt fluctuations, and even quasielastic scattering, at 250 K in the HTT phase, as seen previously Kimura et al. (2005). In the LTO phase at 180 K, much of the low-energy weight is due to the residual soft mode that condenses at the LTT transition. We note that scattering at (032) is allowed in both the LTO and LTT phases; it follows that one cannot uniquely distinguish between OE and OI soft tilt fluctuations at this -point, in contrast to fluctuations at (330).
IV Discussion
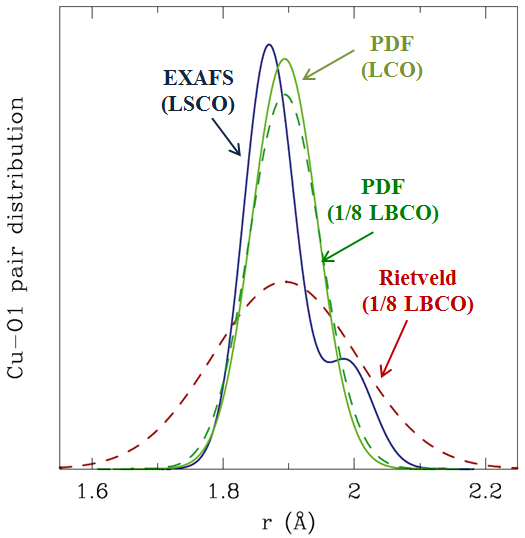
The distribution of Cu-O nearest-neighbor bond lengths has been the subject of some controversy over the years, and so deserves some discussion. Our Rietveld analysis finds a maximum bond length splitting of just 0.005 Å in the LTT phase of La2-xBaxCuO4 with , consistent with earlier diffraction work on La2-xBaxCuO4 Cox et al. (1989). To appreciate how small this splitting is, we compare various measures of the bond-length distribution in Fig. 17. The peak obtained from the PDF analysis yields a mean-squared relative displacement, , of 0.0022(1) Å2 at 15 K, corresponding to a bond-length spread of 0.05 Å; hence, the disorder in the bond length, largely due to zero-point fluctuations, is an order of magnitude greater than the bond-length splitting. The width of the PDF peak is significantly smaller than that obtained from the Rietveld analysis, as the former is sensitive to the correlated motion of nearest neighbors, whereas diffraction intensities only have information on the independent fluctuations of the distinct atomic sites.
The Cu-O pair distribution can also be probed in x-ray absorption fine structure (XAFS) studies. Bianconi and coworkers Bianconi et al. (1996); Saini et al. (1997) have reported a splitting of the Cu-O bond distribution by 0.08 Å below 100 K in La1.85Sr0.15CuO4. We have reproduced their low-temperature distribution in Fig. 17. In a study of La1.875Ba0.125CuO4 Lanzara et al. (1996), they reported a corresponding anomalous increase of by 0.001 Å2 on cooling below 60 K. Such observations are incompatible with our results. As can be seen in Fig. 17, the PDF analysis has sufficient resolution to detect the splitting claimed in the La2-xSrxCuO4 study Bianconi et al. (1996); Saini et al. (1997). Regarding the temperature dependence of , we find on warming to 100 K that there is small increase to 0.0025(1) Å2, not a decrease. Our finding of an absence of anomalous bond length disorder at low temperature is consistent with that of other XAFS studies Haskel et al. (2000); Tranquada et al. (1987). It is also consistent with estimates of the bond-length modulation associated with stripe order based on superlattice intensities Tranquada et al. (1996). We conclude that the bond-length modulation that pins stripe order is remarkably subtle.
Next, we turn to the doping dependence of the Cu-O bond anisotropy, where we have two competing trends. One of these involves the decrease in the average octahedral tilt with doping. The shortening of the in-plane Cu-O bond length reduces the mismatch with bond lengths in the La2O2 layer, resulting in one contribution to the reduction in average tilt. Another comes from the quenched disorder associated with substituting Ba2+ for La3+. The Ba acts effectively as a negative defect, repelling the neighboring apical oxygens and disrupting the octahedral tilt pattern. These effects lead to the decrease in the average orthorhombic strain with , as summarized in Fig. 18. The competing trend involves the onset temperature for the LTT (LTLO) transition, resulting in ordering of OI tilts. The empirical trend is that this should grow with Ba concentration (as it depends on the average ionic radius of the ions relative to that of the ions Suzuki et al. (1994)). These competing trends lead to the bond-length anisotropy reaching a maximum that appears to occur coincidentally near , where stripe order is strongest Hücker et al. (2011a).
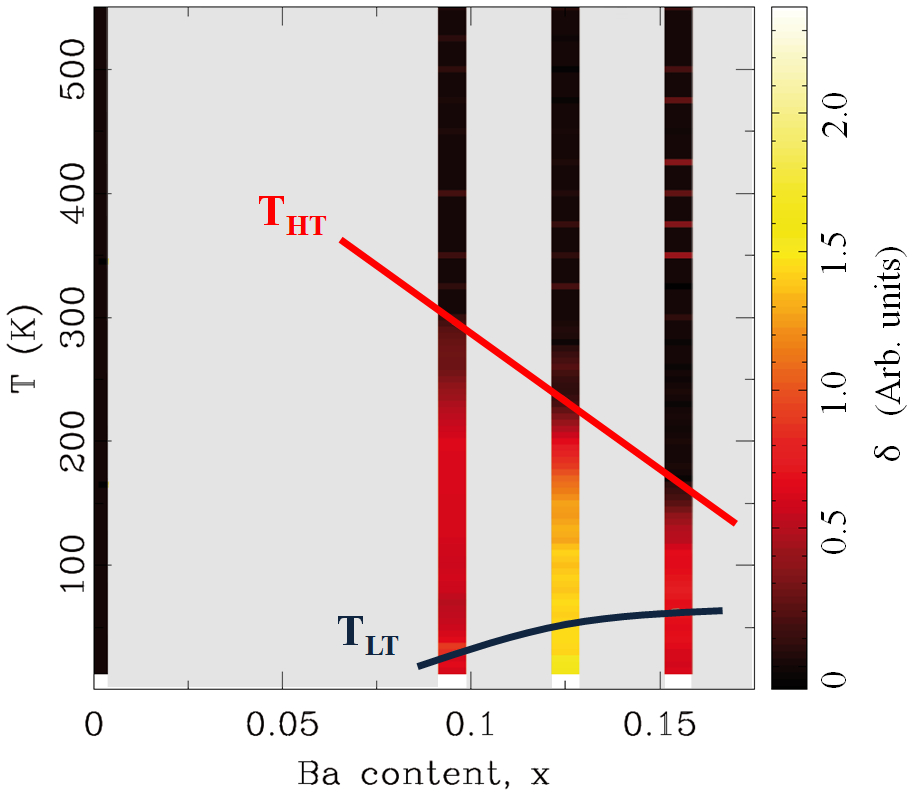
We get a somewhat different perspective from the temperature and doping dependence of parameter , defined in Eq. (2), which measures the LTT-like component of the octahedral tilts; a false color representation is shown in Fig. 19. Here we see that the OI tilts appear in a significant way at the onset of LTO order. Furthermore, the relative magnitude is largest at even before LTT order is achieved. This behavior is suggestive that the structural anisotropy might be influenced by electron-phonon coupling and particular stability of the stripe-ordered phase at . Regarding stability, it is interesting to note the results of recent optical pump probe studies. Pumping the phase in La1.8-xEu0.2SrxCuO4 with 80-meV photons with polarization parallel to the planes induces interlayer superconducting coherence for K Fausti et al. (2011); this also causes stripe melting in La2-xBaxCuO4 Först et al. (2014). In contrast, pumping La2-xBaxCuO4 with polarization perpendicular to the planes enhances interlayer superconducting coherence for , but not for Nicoletti et al. (2014).
It is also relevant to compare with observations of charge-density-wave (CDW) order in YBa2Cu3O6+d Ghiringhelli et al. (2012); Chang et al. (2012). While there are differences in the doping dependence of the charge-ordering wave vectors and the connection to the spin correlations, the CDW order in YBa2Cu3O6+d is strongest for hole concentration near 0.12 Hücker et al. (2014); Blanco-Canosa et al. (2014), a remarkable similarity to La2-xBaxCuO4 Hücker et al. (2011a) and La1.6-xNd0.4SrxCuO4 Ichikawa et al. (2000). The CDW order in YBa2Cu3O6+d appears at temperatures as high as K in a lattice with OI order present to above room temperature.
Finally, we note that charge-stripe order has recently been detected by x-ray diffraction in La2-xSrxCuO4 with Wu et al. (2012); Christensen et al. (2014); Croft et al. (2014); Thampy et al. (2014), confirming an earlier identification by nuclear magnetic resonance Hunt et al. (1999). This result is somewhat surprising, as the average structure of La2-xSrxCuO4 is LTO (although electron diffraction studies have indicated LTT-like regions at LTO twin boundaries for Horibe et al. (1997) and LTLO order for Koyama et al. (1995)). A key difference from La2-xBaxCuO4 is that the average orientation of the charge stripes is rotated away from the Cu-O bond direction by a small amount. Despite this difference, it seems relevant to ask whether dynamic or quasi-static OI tilts may be present in La2-xSrxCuO4. We hope to test this possibility in the future.
V Summary
Experimental evidence for the persistence, on a nanometer lengthscale, of CuO6 LTT-like octahedral tilt correlations deep into the LTO crystallographic phase in La2-xBaxCuO4 with has been presented. Despite the average structure becoming orthorhombic above as evidenced by Rietveld refinements of neutron scattering data, PDF analysis of the same data shows that the local structure retains its base temperature signatures consistent with orthogonal inequivalent state up to at least , where LTO transforms to HTT. The analysis also suggests that there is little preference between OI and OE tilts at high temperature, consistent with the idea that, in the HTT phase, the Cu-O(2) bond precesses rather smoothly around the axis. The bond-length modulation that pins stripe order is found to be remarkably subtle, with no anomalous bond length disorder at low temperature, placing an upper limit on in-plane Cu-O bondlength anisotropy of 0.005 Å. Complementary inelastic neutron scattering measurements on single crystal sample reveal that upon heating across the tilt correlations become extremely short-range and dynamic. The finite width of excitations around along further indicates that the LTT tilt fluctuations have 3D character. The relative magnitude of the effect is maximum at doping where bulk superconductivity is most strongly suppressed, suggesting that the structural anisotropy might be influenced by electron-phonon coupling and particular stability of the stripe-ordered phase at this composition.
Acknowledgements.
Work at Brookhaven National Laboratory was supported by US DOE, Office of Science, Office of Basic Energy Sciences (DOE-BES) under contract DE-AC02-98CH10886. Neutron PDF experiments were carried out on NPDF at LANSCE, funded by DOE BES; Los Alamos National Laboratory is operated by Los Alamos National Security LLC under contract No. DE-AC52-06NA25396. Inelastic neutron scattering experiments were carried out on HYSPEC at Spallation Neutron Source at ORNL, sponsored by the Scientific User Facilities Division, Office of Basic Energy Sciences, U.S. Department of Energy. JMT and RDZ are grateful to B. L. Winn and M. Graves-Brook for assistance with the HYSPEC measurements. ESB gratefully acknowledges T. E. Proffen and J. Siewenie for assistance with the NPDF measurements.References
- Bednorz and Müller (1986) J. Bednorz and K. Müller, Z. Phys. B 64, 189 (1986).
- Jorgensen et al. (1987) J. D. Jorgensen, H. B. Schüttler, D. G. Hinks, D. W. Capone II, K. Zhang, M. B. Brodsky, and D. J. Scalapino, Phys. Rev. Lett. 58, 1024 (1987).
- Paul et al. (1987) D. M. Paul, G. Balakrishnan, N. R. Bernhoeft, W. I. F. David, and W. T. A. Harrison, Phys. Rev. Lett. 58, 1976 (1987).
- Moodenbaugh et al. (1988) A. R. Moodenbaugh, Y. Xu, M. Suenaga, T. J. Folkerts, and R. N. Shelton, Phys. Rev. B 38, 4596 (1988).
- Axe et al. (1989) J. D. Axe, A. H. Moudden, D. Hohlwein, D. E. Cox, K. M. Mohanty, A. R. Moodenbaugh, and Y. Xu, Phys. Rev. Lett. 62, 2751 (1989).
- Suzuki and Fujita (1989a) T. Suzuki and T. Fujita, J. Phys. Soc. Jpn. 58, 1883 (1989a).
- Cox et al. (1989) D. E. Cox, P. Zolliker, J. D. Axe, A. H. Moudden, A. R. Moodenbaugh, and Y. Xu, Mat. Res. Symp. Proc. 156, 141 (1989).
- Billinge et al. (1993) S. J. L. Billinge, G. H. Kwei, A. C. Lawson, J. D. Thompson, and H. Takagi, Phys. Rev. Lett. 71, 1903 (1993).
- Tranquada et al. (1995) J. M. Tranquada, B. J. Sternlieb, J. D. Axe, Y. Nakamura, and S. Uchida, Nature 375, 561 (1995).
- Fujita et al. (2004) M. Fujita, H. Goka, K. Yamada, J. M. Tranquada, and L. P. Regnault, Phys. Rev. B 70, 104517 (2004).
- Li et al. (2007) Q. Li, M. Hücker, G. D. Gu, A. M. Tsvelik, and J. M. Tranquada, Phys. Rev. Lett. 99, 067001 (2007).
- Tranquada et al. (2008) J. M. Tranquada, G. D. Gu, M. Hücker, Q. Jie, H.-J. Kang, R. Klingeler, Q. Li, N. Tristan, J. S. Wen, G. Y. Xu, Z. J. Xu, J. Zhou, and M. v. Zimmermann, Phys. Rev. B 78, 174529 (2008).
- Berg et al. (2009) E. Berg, E. Fradkin, S. A. Kivelson, and J. M. Tranquada, New J. Phys. 11, 115004 (2009).
- Himeda et al. (2002) A. Himeda, T. Kato, and M. Ogata, Phys. Rev. Lett. 88, 117001 (2002).
- Suzuki and Fujita (1989b) T. Suzuki and T. Fujita, Physica C 159, 111 (1989b).
- Zhao et al. (2007) Y. Zhao, B. D. Gaulin, J. P. Castellan, J. P. C. Ruff, S. R. Dunsiger, G. D. Gu, and H. A. Dabkowska, Phys. Rev. B 76, 184121 (2007).
- Hücker et al. (2011a) M. Hücker, M. v. Zimmermann, G. D. Gu, Z. J. Xu, J. S. Wen, G. Xu, H. J. Kang, A. Zheludev, and J. M. Tranquada, Phys. Rev. B 83, 104506 (2011a).
- Wen et al. (2012) J. Wen, Z. Xu, G. Xu, Q. Jie, M. Hücker, A. Zheludev, W. Tian, B. L. Winn, J. L. Zarestky, D. K. Singh, T. Hong, Q. Li, G. Gu, and J. M. Tranquada, Phys. Rev. B 85, 134512 (2012).
- Billinge et al. (1994a) S. J. L. Billinge, G. H. Kwei, and H. Takagi, Phys. Rev. Lett. 72, 2282 (1994a).
- Haskel et al. (2000) D. Haskel, E. A. Stern, F. Dogan, and A. R. Moodenbaugh, Phys. Rev. B 61, 7055 (2000).
- Božin et al. (1997) E. Božin, S. Billinge, and G. Kwei, Physica B 241—243, 795 (1997).
- Fabbris et al. (2013) G. Fabbris, M. Hücker, G. D. Gu, J. M. Tranquada, and D. Haskel, Phys. Rev. B 88, 060507 (2013).
- Axe and Crawford (1994) J. D. Axe and M. K. Crawford, J. Low Temp. Phys. 95, 271 (1994).
- Radaelli et al. (1994) P. G. Radaelli, D. G. Hinks, A. W. Mitchell, B. A. Hunter, J. L. Wagner, B. Dabrowski, K. G. Vandervoort, H. K. Viswanathan, and J. D. Jorgensen, Phys. Rev. B 49, 4163 (1994).
- Hücker et al. (2011b) M. Hücker, M. v. Zimmermann, G. D. Gu, Z. J. Xu, J. S. Wen, G. Xu, H. J. Kang, A. Zheludev, and J. M. Tranquada, Phys. Rev. B 83, 104506 (2011b).
- Crawford et al. (1991) M. K. Crawford, R. L. Harlow, E. M. McCarron, W. E. Farneth, J. D. Axe, H. Chou, and Q. Huang, Phys. Rev. B 44, 7749 (1991).
- Birgeneau et al. (1987) R. J. Birgeneau, C. Y. Chen, D. R. Gabbe, H. P. Jenssen, M. A. Kastner, C. J. Peters, P. J. Picone, T. Thio, T. R. Thurston, H. L. Tuller, J. D. Axe, P. Böni, and G. Shirane, Phys. Rev. Lett. 59, 1329 (1987).
- Thurston et al. (1989) T. R. Thurston, R. J. Birgeneau, D. R. Gabbe, H. P. Jenssen, M. A. Kastner, P. J. Picone, N. W. Preyer, J. D. Axe, P. Böni, G. Shirane, M. Sato, K. Fukuda, and S. Shamoto, Phys. Rev. B 39, 4327 (1989).
- Kimura et al. (2000) H. Kimura, K. Hirota, C.-H. Lee, K. Yamada, and G. Shirane, J. Phys. Soc. Jpn. 69, 851 (2000).
- Keimer et al. (1993) B. Keimer, R. J. Birgeneau, A. Cassanho, Y. Endoh, M. Greven, M. A. Kastner, and G. Shirane, Z. Phys. B 91, 373 (1993).
- Kimura et al. (2005) H. Kimura, Y. Noda, H. Goka, M. Fujita, K. Yamada, and G. Shirane, J. Phys. Soc. Jpn. 74, 445 (2005).
- Wakimoto et al. (2006) S. Wakimoto, H. Kimura, M. Fujita, K. Yamada, Y. Noda, G. Shirane, G. Gu, H. Kim, and R. J. Birgeneau, J. Phys. Soc. Jpn. 75, 074714 (2006).
- Pickett et al. (1991) W. E. Pickett, R. E. Cohen, and H. Krakauer, prl 67, 228 (1991).
- Cai and Welch (1994) Z.-X. Cai and D. O. Welch, Physica C 231, 383 (1994).
- Egami and Billinge (2012) T. Egami and S. J. L. Billinge, Underneath the Bragg peaks: structural analysis of complex materials, 2nd ed. (Elsevier, Amsterdam, 2012).
- Peterson et al. (2000) P. F. Peterson, M. Gutmann, T. Proffen, and S. J. L. Billinge, J. Appl. Crystallogr. 33, 1192 (2000).
- Rietveld (1967) H. M. Rietveld, Acta Crystallogr. 22, 151 (1967).
- Larson and Von Dreele (1987) A. C. Larson and R. B. Von Dreele, “General structure analysis system,” (1987), report No. LAUR-86-748, Los Alamos National Laboratory, Los Alamos, NM 87545.
- Toby (2001) B. H. Toby, J. Appl. Crystallogr. 34, 201 (2001).
- Farrow et al. (2007) C. L. Farrow, P. Juhás, J. Liu, D. Bryndin, E. S. Božin, J. Bloch, T. Proffen, and S. J. L. Billinge, J. Phys: Condens. Mat. 19, 335219 (2007).
- Winn et al. (2014) B. Winn, U. Filges, V. O. Garlea, M. Graves-Brook, M. Hagen, C. Jiang, M. Kenzelmann, L. Passell, S. M. Shapiro, X. Tong, and I. Zaliznyak, EPJ Web of Conferences (2014).
- Arnold et al. (2014) O. Arnold, J. C. Bilheux, J. M. Borreguero, A. Butsa, S. I. Campbell, L. Chapona, M. Doucet, N. Draper, R. Ferraz Leal, M. A. Gigga, V. E. Lynch, A. Markvardsen, D. J. Mikkelsone, R. L. Mikkelsone, R. Miller, K. Palmen, P. Parker, G. Passos, T. G. Perring, P. F. Peterson, S. Ren, M. A. Reuter, A. T. Savici, J. W. Taylor, R. J. Taylor, R. Tolchenov, W. Zhou, and J. Zikovsky, Nucl. Instrum. Meth. A 764, 156–166 (2014).
- Azuah et al. (2009) R. T. Azuah, L. R. Kneller, Y. Qiu, P. L. W. Tregenna-Piggott, C. M. Brown, J. R. D. Copley, and R. M. Dimeo, J. Res. Natl. Inst. Stan. Technol. 114, 341 (2009).
- Qiu et al. (2005) X. Qiu, T. Proffen, J. F. Mitchell, and S. J. L. Billinge, Phys. Rev. Lett. 94, 177203 (2005).
- Božin et al. (2008) E. S. Božin, A. Sartbaeva, H. Zheng, S. A. Wells, J. F. Mitchell, T. Proffen, M. F. Thorpe, and S. J. L. Billinge, J. Phys. Chem. Solids 69, 2146 (2008).
- Billinge et al. (1994b) S. J. L. Billinge, G. H. Kwei, and H. Takagi, Physica B 199-200, 244 (1994b).
- Debye (1912) P. Debye, Ann. Phys.-Berlin 39, 789 (1912).
- Knox et al. (2013) K. R. Knox, A. M. M. Abeykoon, H. Zheng, W.-G. Yin, A. M. Tsvelik, J. F. Mitchell, S. J. L. Billinge, and E. S. Bozin, Phys. Rev. B 88, 174114 (2013).
- Božin et al. (2014) E. S. Božin, K. R. Knox, P. Juhás, Y. S. Hor, J. F. Mitchell, and S. J. L. Billinge, Sci. Rep. 4, 4081 (2014).
- Billinge et al. (1994c) S. J. L. Billinge, G. H. Kwei, and H. Takagi, Phys. Rev. Lett. 72, 2282 (1994c).
- Božin and Billinge (1998) E. S. Božin and S. J. L. Billinge, Solid State Phenomena 61-62, 271 (1998).
- Božin et al. (1998) E. S. Božin, S. J. L. Billinge, and G. H. Kwei, Physica B 241-243, 795 (1998).
- Božin et al. (1999) E. S. Božin, S. J. L. Billinge, G. H. Kwei, and H. Takagi, Phys. Rev. B 59, 4445 (1999).
- Božin et al. (2010) E. S. Božin, C. D. Malliakas, P. Souvatzis, T. Proffen, N. A. Spaldin, M. G. Kanatzidis, and S. J. L. Billinge, Science 330, 1660 (2010).
- Knox et al. (2014) K. R. Knox, E. S. Bozin, C. D. Malliakas, M. G. Kanatzidis, and S. J. L. Billinge, Phys. Rev. B 89, 014102 (2014).
- Jeong et al. (1999) I. Jeong, T. Proffen, F. Mohiuddin-Jacobs, and S. J. L. Billinge, J. Phys. Chem. A 103, 921 (1999).
- Proffen and Billinge (1999) T. Proffen and S. J. L. Billinge, J. Appl. Crystallogr. 32, 572 (1999).
- Isaacs et al. (1994) E. D. Isaacs, G. Aeppli, P. Zschack, S.-W. Cheong, H. Williams, and D. J. Buttrey, Phys. Rev. Lett. 72, 3421 (1994).
- Bianconi et al. (1996) A. Bianconi, N. L. Saini, A. Lanzara, M. Missori, T. R. H. Oyanagi, H. Yamaguchi, K. Oka, and T. Ito, Phys. Rev. Lett. 76, 3412 (1996).
- Saini et al. (1997) N. L. Saini, A. Lanzara, H. Oyanagi, H. Yamaguchi, K. Oka, T. Ito, and A. Bianconi, Phys. Rev. B 55, 12759 (1997).
- Lanzara et al. (1996) A. Lanzara, N. L. Saini, T. Rossetti, A. Bianconi, H. Oyanagi, H. Yamaguchi, and Y. Maeno, Solid State Commun. 97, 93 (1996).
- Tranquada et al. (1987) J. M. Tranquada, S. M. Heald, and A. R. Moodenbaugh, Phys. Rev. B 36, 8401 (1987).
- Tranquada et al. (1996) J. M. Tranquada, J. D. Axe, N. Ichikawa, Y. Nakamura, S. Uchida, and B. Nachumi, Phys. Rev. B 54, 7489 (1996).
- Suzuki et al. (1994) T. Suzuki, M. Sera, T. Hanaguri, and T. Fukase, Phys Rev. B 49, 12392 (1994).
- Fausti et al. (2011) D. Fausti, R. I. Tobey, N. Dean, S. Kaiser, A. Dienst, M. C. Hoffmann, S. Pyon, T. Takayama, H. Takagi, and A. Cavalleri, Science 331, 189 (2011).
- Först et al. (2014) M. Först, R. I. Tobey, H. Bromberger, S. B. Wilkins, V. Khanna, A. D. Caviglia, Y.-D. Chuang, W. S. Lee, W. F. Schlotter, J. J. Turner, M. P. Minitti, O. Krupin, Z. J. Xu, J. S. Wen, G. D. Gu, S. S. Dhesi, A. Cavalleri, and J. P. Hill, Phys. Rev. Lett. 112, 157002 (2014).
- Nicoletti et al. (2014) D. Nicoletti, E. Casandruc, Y. Laplace, V. Khanna, C. R. Hunt, S. Kaiser, S. S. Dhesi, G. D. Gu, J. P. Hill, and A. Cavalleri, Phys. Rev. B 90, 100503 (2014).
- Ghiringhelli et al. (2012) G. Ghiringhelli, M. Le Tacon, M. Minola, S. Blanco-Canosa, C. Mazzoli, N. B. Brookes, G. M. De Luca, A. Frano, D. G. Hawthorn, F. He, T. Loew, M. M. Sala, D. C. Peets, M. Salluzzo, E. Schierle, R. Sutarto, G. A. Sawatzky, E. Weschke, B. Keimer, and L. Braicovich, Science 337, 821 (2012).
- Chang et al. (2012) J. Chang, E. Blackburn, A. T. Holmes, N. B. Christensen, J. Larsen, J. Mesot, R. Liang, D. A. Bonn, W. N. Hardy, A. Watenphul, M. v. Zimmermann, E. M. Forgan, and S. M. Hayden, Nat. Phys. 8, 871 (2012).
- Hücker et al. (2014) M. Hücker, N. B. Christensen, A. T. Holmes, E. Blackburn, E. M. Forgan, R. Liang, D. A. Bonn, W. N. Hardy, O. Gutowski, M. v. Zimmermann, S. M. Hayden, and J. Chang, Phys. Rev. B 90, 054514 (2014).
- Blanco-Canosa et al. (2014) S. Blanco-Canosa, A. Frano, E. Schierle, J. Porras, T. Loew, M. Minola, M. Bluschke, E. Weschke, B. Keimer, and M. Le Tacon, Phys. Rev. B 90, 054513 (2014).
- Ichikawa et al. (2000) N. Ichikawa, S. Uchida, J. M. Tranquada, T. Niemöller, P. M. Gehring, S.-H. Lee, and J. R. Schneider, Phys. Rev. Lett. 85, 1738 (2000).
- Wu et al. (2012) H. H. Wu, M. Buchholz, C. Trabant, C. F. Chang, A. C. Komarek, F. Heigl, M. v. Zimmermann, M. Cwik, F. Nakamura, M. Braden, and C. Schüßler-Langeheine, Nat. Commun. 3, 1023 (2012).
- Christensen et al. (2014) N. B. Christensen, J. Chang, J. Larsen, M. Fujita, M. Oda, M. Ido, N. Momono, E. M. Forgan, A. T. Holmes, J. Mesot, M. Hücker, and M. v. Zimmermann, “Bulk charge stripe order competing with superconductivity in La2-xSrxCuO4 (),” arXiv:1404.3192 (2014).
- Croft et al. (2014) T. P. Croft, C. Lester, M. S. Senn, A. Bombardi, and S. M. Hayden, Phys. Rev. B 89, 224513 (2014).
- Thampy et al. (2014) V. Thampy, M. P. M. Dean, N. B. Christensen, L. Steinke, Z. Islam, M. Oda, M. Ido, N. Momono, S. B. Wilkins, and J. P. Hill, Phys. Rev. B 90, 100510 (2014).
- Hunt et al. (1999) A. W. Hunt, P. M. Singer, K. R. Thurber, and T. Imai, Phys. Rev. Lett. 82, 4300 (1999).
- Horibe et al. (1997) Y. Horibe, Y. Inoue, and Y. Koyama, Physica C 282–287, 1071 (1997).
- Koyama et al. (1995) Y. Koyama, Y. Wakabayashi, K. Ito, and Y. Inoue, Phys. Rev. B 51, 9045 (1995).