![[Uncaptioned image]](/html/1412.6511/assets/x1.png)
Discordant optical and X-ray classification of AGN
Ordovás-Pascual, I.1,
Mateos, S.1,
Carrera, F. J.1,
and
Wiersema, K.2
1
Instituto de Física de Cantabria (CSIC-UC) 39005 Santander, Spain
2 Department of Physics and Astronomy, University of Leicester, Leicester, UK, LE1 7RH
Abstract
To provide insight into the apparent mismatch between the optical and X-ray absorption properties observed in 10-30 % of Active Galactic Nuclei (AGN), we have conducted a detailed study of two X-ray unabsorbed AGN with a type-2 optical spectroscopic classification. In addition to high quality X-ray spectroscopic observations, that we used to determine both the AGN luminosities and absorption, we have a VLT/XSHOOTER UV-to-near-IR high resolution spectrum for each object, that we used to determine the AGN intrinsic emision corrected for both contamination from the AGN hosts and extinction. Our analysis has revealed that the apparent mismatch is provoked by galaxy dilution. We dilution of two AGN with extreme properties: one of them has an intrinsically very high Balmer decrement while the other lies in a galaxy more massive than expected.
1 Introduction
According to the unified model of AGN, type-1 and type-2 AGN are the same kind of object. The differences in their observed properties can be explained by orientation effects. If our line-of-sight to the central engine intercepts the dusty torus invoked by unified models, the UV/optical broad emission lines are obscured, and the X-ray emission is absorbed. In this case, the AGN is classified as type-2. On the other hand, in type-1 we have a direct view of the central engine, the broad lines from the Broad Line Region (BLR) are present in the optical spectrum, and the X-ray emission is unobscured.
The classification of AGN using either the optical range or X-rays should agree according to this model, but approximately, 10-23% of type-1 AGN present an X-ray absorbed spectrum, and 3-17% of type-2 AGN are X-ray unabsorbed ([12], [6], [14]).
The objective of this study is to uncover the apparent mismatch between the UV/optical and X-ray properties of X-ray unobsured type-2 AGN. We tested three possible scenarios: a) the objects are Compton-Thick; ie. the nuclear NH column density is equal to or larger than the inverse of the Thomson cross-section (N=1.51024 cm-2). In this case, the X-ray emission below 10 keV is totally obscured and the spectrum would be scattered and reflected emission, a strong Fe line at 6.4-7 keV; b) the AGN signatures, the broad UV/optical emission lines, are present but diluted by the host galaxy contribution; c) the mismatch is provoked by intrinsic non-standard properties of the AGN, such as a weak BLR emission, and/or their hosts.
2 The sample
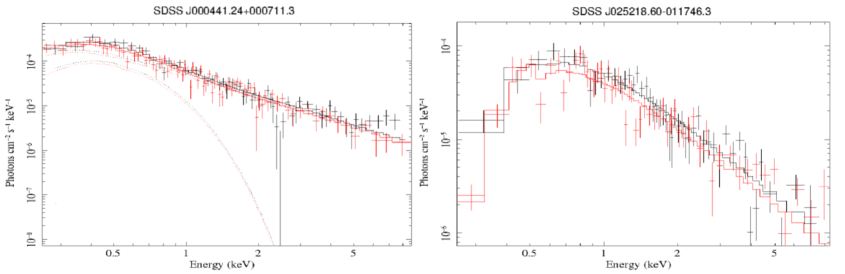
The two AGN analysed in this work were selected from the Bright Ultra-hard XMM-Newton Survey (BUXS). This is an X-ray selected sample at 4.5-10 keV energies that includes 258 AGN with (4.5-10 keV) 6 erg s-1 cm-2 detected in a total sky area of 44.43 deg2. The optical spectroscopic completeness is 98% [13]. We have selected 2 from this sample with an apparent mismatch between the UV/optical and X-ray properties.
SDSS J000441.24+000711.3: it is X-ray unobscured. The SDSS public spectrum show a broad component in Hα but not in Hβ, so it is a Seyfert 1.9. SDSS J025218.60-011746.3: is a Sb edge-on galaxy with low X-ray obscuration. 6dF public spectrum indicates a Seyfert 2 classification. In Figrure 1 it is shown the XMM-Newton spectra for the selected objects and in the caption we list their main properties.
3 The Data
We present high resolution spectra for both objects from VLT/XSHOOTER [17]. The observations were taken with a 1.0”x11” slit for the arm (UVB) and a 0.9”x11” slit for visible and near-infrared arms (VIS and NIR, respectively). The wavelength coverage is 3000-5500 Å for the UVB, 5500-10000 Å for VIS and 10000-25000 Å for NIR. For each frame and for both objects, the exposition time was 1420 seconds for UVB and VIs and 480 seconds for NIR. Full details on the reduction of the data will be presented in Ordovás-Pascual et al. 2015 (in preparation). In both cases we used a 2” region to extract the AGN spectra. We also obtained the spectra from the AGN host galaxies by extracting spectra 1” away from the centre for J000441.24+000711.3 and 1.25” for J025218.60-011746.3 using a 1.5” aperture.
4 Spectral analysis
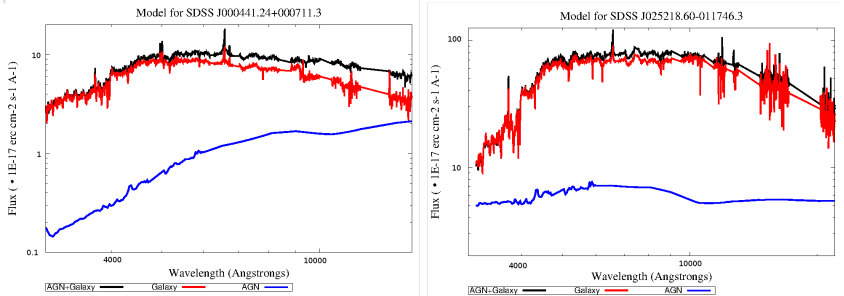
The XSHOOTER spectra are dominated by the host galaxy enmission, and most AGN signatures are completely diluted.
The next step is to obtain the relative contribution of the AGN and the galaxy. This is conducted using the CIAO’s SHERPA fitting tool [7]. We used a compound model of the extracted galaxy spectrum, a QSO1 template [16] with the nuclear extinction as a free parameter. The QSO1 model is corrected for slit loses. We fit the nuclei emission using a gaussian profile in the adquisition image, and then we compute the fraction of this profile that enters through the slit. We used an exctinction model of the Small Magellanic Cloud (SMC; [8], [1]). The spectra of the AGN host galaxies were recalibrated to match in flux with the Ca II K (-rest-frame 3933 Å) and Ca II H (-rest-frame 3968 Å) galactic absorption lines. In Table 1 we list the UV/optical derived extinction. Fig. 2 shows the result. After correcting for both host galaxy contamination and extinction, both objects show a broad lines in Hα, and also J000441.24+000711.3 show a broad line in Hβ-.
5 Properties of the SMBHs and their hosts
We have analyzed the zone of Hα to determine the mass of the SMBHs. The continuum is fitted by a straight line. The broad an narrow emission lines are fitted using gaussian profiles. The line widths have been corrected for the instrumental resolution of XSHOOTER. In Fig. 3 we show the results from this analysis. To compute the MSMBH we used the expresion in [9]. The measurements for the MSMBH are listed in Table 1.
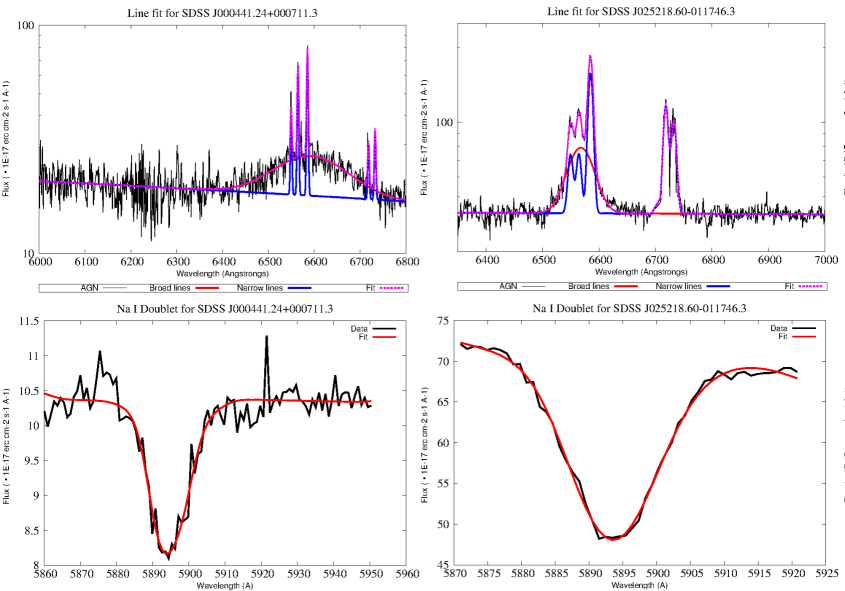
The M- relation consist in a linear correlation of the mass of a SMBH with the stellar velocity dispersion of the elliptical galaxy or bulge ([15], [9]). The doublet of NaI is an absorption feature that it can be used to calculate the line-of-sight velocity dispersion (LOSVD) through a deconvolution of the lines. In this case we use the templates from [3]. We adjust the NaId with a convolution of the chosen template and a gaussian function. The standard dispersion of this gaussian function gives the desired LOSVD. In Fig. 3 we show absorption lines and the results of the fit. The value obtained by the fitwere also corrected for the instrumental resolution of XSHOOTER. We calculate the mass of the galaxy using [4].
| Object | A(V) (mag) | (km s-1) | ||
|---|---|---|---|---|
| J000441.24+000711.3 | 0.030800.00075 | 8.21 | 11.07 | 15748 |
| J025218.60-011746.3 | 0.015180.00014 | 6.51 | 10.85 | 27115 |
6 Discussion
In this work we have investigated the origin of the apparent mismatch of the optical and X-ray classifications of two X-ray unpbscured type-2 AGN by obtaining the intrinsic emission of the AGN.We have investigated three possible explanations proposed in Section 1.
The values of the NH column derived from the X-ray spectroscopy indicate that none of the AGN are Compton-thick. The X-ray spectrum is too steep to be dominated by scattered or reflected emission, and there is no sign of a strong reflection Fe line. This is supported by the L/[OIII] ratio (being [OIII] the unreddened luminosity of the [OIII] emission line at -rest-frame 5007 Å) [2], that in the case of Compton-thick sources is lower than 1. This ratio is 37 for J025218.60-011746.3 and 385 for J000441.24+000711.3.
In both objects, there is significant host dilution of the nuclear emission in the UV-optical range. In the UV range the AGN contribution is in the same order as the uncertainly of the XSHOOTER spectra, and its contribution begins to be significant in the optical and near infrarred wavelengths. Only by subtracting the nuclear emission from the host galaxy contribution it is possible to uncover the broad Hα contribution, which was partially hidden in J000441.24+000711.3 and totally hidden in J025218.60-011746.3.
J000441.24+000711.3 on one hand follows the M- relation. The dynamical mass of the galaxy is the expected in comparison with the MSMBH as well. Using the AGN emission after subtracting the stellar emission but without correcting for extinction we can calculate the Balmer decrement of the broad emission lines, and then we can calculate the NH column derived from this Balmer decrement as in [5]. The Balmer decrement of the obscured broad lines (Hα/Hβ=6.86) gives a higher NH column than the one obtained in Section 4 and the X-ray derived one (5.01021 cm-2 versus 4.01020 cm-2 and 6.01020 cm-2 respectively), assuming an intrinsic Balmer decrement of 2.11 [11]. An intrinsic Balmer decrement of 6.25 would be needed in order to obtain the same NH column as in 4. Geometrically, it is impossible to find a way to obscure the BLR one factor higher than the accretion disk (where the AGN continuum is originated) and the corona (where the X-ray emission is originated). We conclude that this low Balmer decrement is an intrinsic property of this AGN. This is why the broad components are diluted in the galactic star light and the mismatch is originated in this object.
J025218.60-011746.3 falls below the M- relation (falls in the 2-3 range), the mass of the bulge is higher than expected compared to the SMBH mass [9], meaning that the star light contribution outshines the broad components of the nuclear emission. We do not found a broad component of Hβ.
In conclusion, the AGN signatures are hidden because the galaxy contribution outshines them for two different reasons. The complete study will be presented in Ordovás-Pascual et al. 2015 (in preparation).
Acknowledgments
IO-P, SM and FJC acknowledge funding by the spanish Plan Nacional grant AYA2012-31447. SM and FJC acknowledge financial support from the ARCHES project (7th Framework of the European Union, No. 313146)
References
- [1] Allen, C.W. 1976, The Athlone Press, London, UK, p.527
- [2] Bassani, L. et al. 1999 ApJS, 121, 473
- [3] Bruzual, G.; Charlot, S. 2003, MRAS, 344, 4, 1000-1028
- [4] Cappellari, M. et al. 2006, MRAS, 366 , 1126-1150
- [5] Carrera, F. J.; Page, M. J.; Mittaz, J. P. D. 2004 AA 420, 163-172
- [6] Corral, A. et al. 2011 AA, 530, A42
- [7] Freeman, P., Doe, S.; Siemiginowska, A. 2001, SPIE Proceedings, Vol. 4477, p.76
- [8] Gordon, K. D.; Clayton, G. C.; Misselt, K. A.; Landolt, A. U.; Wolff, M. J. 2003, ApJ, 594, 279
- [9] Xiao, T.; Barth, A. J.; Greene, J. E.; Ho, L. C.; Bentz, M. C.; Ludwig, R. R.; Jiang, Y. 2011, ApJ, 739, 28
- [10] Jiang, Y.; Greene, J. E.; Ho, L. C.; Xiao, T.; Barth, A. J. 2011, ApJ, 742, 68
- [11] Jin, C.; Ward, M.; Done, C. 2012, MNRAS, 422, 4, 3268-3284
- [12] Mateos, S. et al. 2005 AA 444, 79-99
- [13] Mateos, S. et al. 2012, MNRAS, 426, 3271
- [14] Merloni, A. et al. 2014 MNRAS 437,3550-3567
- [15] Park, D.; Kelly, B. C.; Woo, J.; Treu, To. 2012, ApJS, 203, 6
- [16] Polletta, M. et al. 2007 ApJ, 663, 81-102
- [17] Vernet, J. et al. 2011 AA 536, A105