Mopra CO Observations of the Bubble HII Region RCW 120
Abstract
We use the Mopra radio telescope to test for expansion of the molecular gas associated with the bubble H II region RCW 120. A ring, or bubble, morphology is common for Galactic H II regions, but the three-dimensional geometry of such objects is still unclear. Detected near- and far-side expansion of the associated molecular material would be consistent with a three-dimensional spherical object. We map the J = transitions of , , C18O, and C17O, and detect emission from all isotopologues. We do not detect the masing lines of CH3OH at 108.8939 GHz. The strongest CO emission is from the photo-dissociation region (PDR), and there is a deficit of emission toward the bubble interior. We find no evidence for expansion of the molecular material associated with RCW 120 and therefore can make no claims about its geometry. The lack of detected expansion is roughly in agreement with models for the time-evolution of an H II region like RCW 120, and is consistent with an expansion speed of . Single-position CO spectra show signatures of expansion, which underscores the importance of mapped spectra for such work. Dust temperature enhancements outside the PDR of RCW 120 coincide with a deficit of emission in CO, confirming that these temperature enhancements are due to holes in the RCW 120 PDR. H-alpha emission shows that RCW 120 is leaking of the ionizing photons into the interstellar medium (ISM) through PDR holes at the locations of the temperature enhancements. H emission also shows a diffuse “halo” from leaked photons not associated with discrete holes in the PDR. Overall of all ionizing photons are leaking into the nearby ISM.
1 Introduction
Spitzer-GLIMPSE observations of the Galactic plane at 8.0 µm (Benjamin et al., 2003) revealed the presence of Galactic infrared (IR) rings, or “bubbles” seen in projection (Churchwell et al., 2006, 2007). Simpson et al. (2012) expanded this to nearly 6000 objects, and using Widefield Infrared Survey Explorer (WISE; Wright et al., 2010) data Anderson et al. (2014) cataloged more than 8000 objects that have this same basic morphology. Nearly all bubbles enclose H II regions (Deharveng et al., 2010), and about half of all H II regions are bubbles (Anderson et al., 2011). The common, circularly symmetric bubble morphology for H II regions indicates that H II regions expand almost uniformly. The small morphological differences between bubbles are likely caused by evolutionary effects coupled with density variations in the ambient medium.
The 8.0 µm Spitzer emission traces the H II region photo-dissociation region (PDR) and surrounds the ionized gas. It is commonly assumed that the 8.0 µm emission is in part due to polycyclic aromatic hydrocarbons (PAHs). These molecules are destroyed within the harsh radiation field of the H II region itself (Povich et al., 2007; Pavlyuchenkov et al., 2013), but fluoresce when hit with ultra-violet photons in a weaker radiation field. The 8.0 µm emission therefore traces H II region PDRs. It is this emission at 8.0 µm from the H II region PDR that forms the bubble structure. The PDR surrounds the ionized gas of the H II region, but it is frequently patchy, which allows some radiation to escape.
Despite their ubiquity, the three-dimensional morphology of bubbles is still unclear. For 43 bubbles, Beaumont & Williams (2010) found no evidence for expansion, using () observations. For a three-dimensional geometry, associated molecular gas from the near- and far-side PDRs of an expanding H II region should be blue- and red-shifted, respectively. Their observations placed a limit on the bubble shell thickness of generally of the bubble radius (their Figure 2). Furthermore, for some bubbles in their sample even a thin three-dimensional shell does not agree with their data. Because of these non-detections, Beaumont & Williams (2010) concluded that bubbles are two-dimensional rings formed in flat (pc thick) parental molecular clouds.
Using Herschel observations, however, Anderson et al. (2012) found that 20% of the total far-infrared emission of bubble H II regions comes from the direction of bubble “interiors,” the locations inside the PDRs, which suggests a three-dimensional morphology. They found that the percentage of far-infrared (FIR) emission coming from the bubble interiors decreases with wavelength, from at 100 µm to at 500 µm. Anderson et al. (2011) found that the radio recombination line width is no greater for bubbles than for the H II region population at large. If bubbles were two-dimensional structures, we would expect their line widths to be greater because expansion out of the plane would not be restricted by dense molecular material (unless all H II regions are two-dimensional objects). That broader lines are not detected for bubbles argues for three-dimensional structures and/or low expansion velocities.
The geometry of bubbles is important for our understanding of triggered star formation. Numerous candidate triggered star formation regions have been identified along bubble borders, suggesting that triggering may be an important star formation process (e.g., Thompson et al., 2012; Simpson et al., 2012). Classical models of H II regions predict that, due to the pressure difference between the warm ( K) ionized gas and the surrounding cold neutral material (K), H II regions expand with characteristic velocities of a few (e.g., Kahn, 1954). During this expansion phase, neutral material accumulates between the ionization front and the shock front that precedes it on the neutral side. This massive shell of accumulated neutral material may fragment and give birth to a second generation of stars – a process known as the “collect & collapse” process (Elmegreen & Lada, 1977) of triggered star formation. Alternatively, the pressure of the ionized gas can compress pre-existing clumps and induce their collapse (“radiation-driven implosion”), again leading to induced star formation.
If bubbles are two-dimensional structures, star formation triggered by H II regions would be less prevalent because there would only be a ring of possible triggering sites instead of a spherical shell. Using the ATLASGAL survey at 870 µm (Schuller et al., 2009) and a sample of northern bubbles, Deharveng et al. (2010) found that 38% of bubbles are surrounded by collected material and an additional 31% are surrounded by several dust condensations. This suggests that bubble H II regions may frequently trigger the formation of second-generation stars, especially massive ones. Thompson et al. (2012) estimate that the formation of 14% to 30% of all massive stars in the Galaxy may be triggered by the expansion of bubbles.
There have been numerous studies of young stellar objects (YSOs) around bubble H II regions (e.g., Deharveng et al., 2009; Watson et al., 2009; Beaumont & Williams, 2010; Deharveng et al., 2012; Samal et al., 2014). These studies have for the most part identified more YSOs in the direction of the PDRs compared to the number found in the center of the bubbles. The statistics for individual bubble H II regions are sometimes poor, owing to the small number of YSOs detected per region, but the overall trend is secure. For RCW 120, Deharveng et al. (2009) found that just two of the Class I and Class I/Class II objects are in the direction of the bubble center. If bubble H II regions are three-dimensional objects, we would expect more YSOs in the direction of the bubble centers.
Here, we seek to understand the morphology of IR bubbles and to better understand their impact in triggering the second generation of stars by measuring the CO emission and expansion of the angularly large, nearby bubble RCW 120 (Rodgers et al., 1960). Many studies have found evidence for expansion of molecular material associated with H II regions (Patel et al., 1995; Heyer et al., 1996; Kirsanova et al., 2008). These studies have largely focused on regions more complicated than RCW120.
2 The RCW 120 HII Region
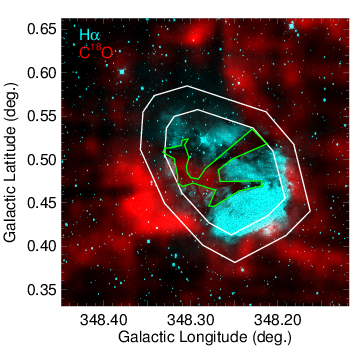
RCW 120 is among the closest H II regions to the Sun, just 1.3 kpc distant (see Zavagno et al., 2007, and references therein). The ionized gas is in diameter, for a physical diameter of pc. Optical absorption is seen across the ionized gas and coincident with weak sub-mm emission, indicating foreground material. As we show below, CO is detected for this material at the same velocity as that of the RCW 120 bubble, and the absorbing material is therefore local to RCW 120. Because of its nearly spherical appearance in the mid-infrared, RCW 120 was dubbed the “perfect bubble” by Deharveng et al. (2009). Herschel observations of the region (Anderson et al., 2010; Zavagno et al., 2010; Anderson et al., 2012) show that the PDR of RCW 120 emits strongly in the FIR as well. We show the H emission from RCW 120 from SuperCosmos (Parker et al., 2005) in Figure 1. The H emission from RCW 120 is dominated by the emission from the H II region itself, but also shows diffuse emission surrounding RCW 120.
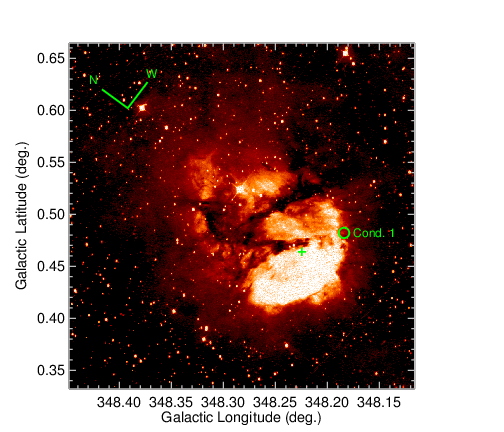
Star formation is observed everywhere around RCW 120. There are numerous massive condensations along the PDR. These condensations were studied in mm-continuum emission by Zavagno et al. (2007) and by Deharveng et al. (2009). Anderson et al. (2012) give masses derived from Herschel far-infrared data for condensations in the field. The most massive condensation, “Condensation 1” is and hosts a source unresolved by Herschel. Zavagno et al. (2010) find that the central source in Condensation 1 is a Class 0 YSO of mass 8–10 and an envelope mass of . Star formation in the fragments along the PDR may have been triggered by the expansion of the H II region. Active star formation is also observed in several condensations. There are numerous infrared dark clouds in the field, most of which are covered by the Mopra observations of this paper.
3 Data
The data were taken from 15 July 2011 to 18 July 2011 with the Australian National Telescope Facility (ATNF) Mopra 22-m radio telescope near Coonabarabran in New South Wales, Australia. During data acquisition the observing conditions were good, although we lost roughly five hours due to inclement weather.
We used the 3-mm Mopra receiver in wideband mode. This mode provides simultaneous spectral coverage of 8.3 GHz in four spectral windows of 2.2 GHz, with 8192 channels per spectral window, and dual linear polarizations. With these tunings we simultaneously observed the four ground-state () CO isotopologues 12CO, 13CO, C17O, and C18O at 115.2712 GHz, 110.2013 GHz, 112.3590 GHz, and 109.7822 GHz, respectively. (The 13CO and C17O lines were in the same spectral window.) We also tuned to the methanol, CH3OH, masing line at 108.8939 GHz111See NRAO’s Splatalogue for transition frequencies: www.splatalogue.net/. Each tuning provides of spectral range. The Mopra beam was for all tunings, which is pc at the distance of RCW 120. We corrected the pointing every hour, and based on the magnitude of these corrections we estimate the pointing accuracy to be better than . The spectral resolution was for all tunings.
We mapped a region square centered at = (348.282°, 0.498°) or (J2000 RA, Dec.) = (17:12:22, 38:25:26). To create this map we made 16 smaller maps, or “tiles”, each on a side, in “On-the-fly” mapping (OTF) mode. We picked one common “off” position and observed this position at the end of each scan row. The scan-speed was per second, and the spectra were read out every 2 s. We observed each tile twice, once in the Galactic longitude direction and once in the Galactic latitude direction, to create a complete map in each direction. This method helps greatly to mediate sky noise. Throughout this paper, the units of the molecular data are corrected antenna temperature, . We corrected for zenith opacity with hot and cold loads.
We reduced the data using the ATNF GRIDZILLA (Sault et al., 1995) and LIVEDATA (Barnes et al., 2001) packages222http://www.atnf.csiro.au/computing/software/livedata/. LIVEDATA takes the raw telescope data, fits baselines, and prepares the data for gridding into a data cube by creating SDFITS files. We fit a linear baseline in LIVEDATA to emission-free channels for all spectra. For each position we thus had four baseline-subtracted spectra: dual polarizations in two scan directions. GRIDZILLA takes the SDFITS files created by LIVEDATA and creates a data cube. We used GRIDZILLA with a FWHM Gaussian smoothing to grid the spectra into data cubes, after averaging the two polarizations. We set the pixel size to , which is of the FWHM beam size. Each data cube was restricted in velocity from to 100 for each spectral line. The average rms noise per pixel location is 0.010 K, 0.005 K, 0.006 K, 0.006 K, 0.005 K, respectively for the 12CO, 13CO, C17O, C18O, and CH3OH lines.
4 Results
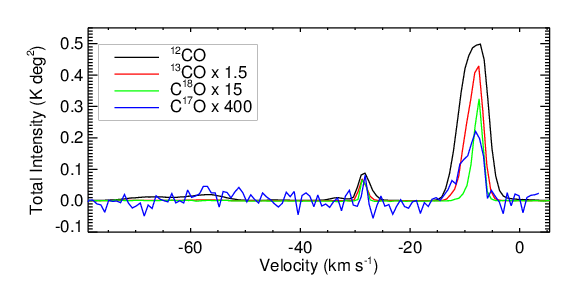
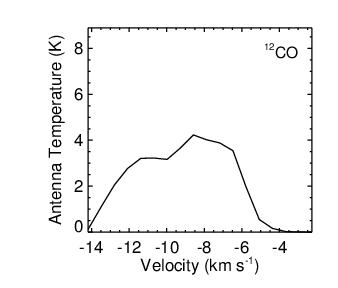
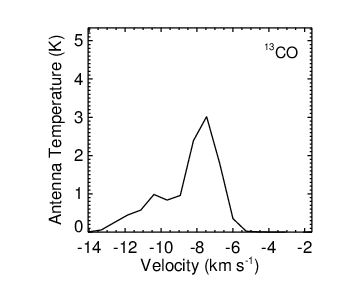
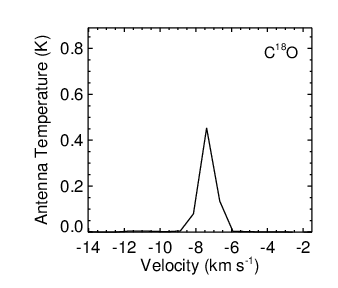
Figure 2 is the spectrum integrated over the entire map for 12CO, 13CO, C17O, and C18O. Strong molecular emission near associated with RCW 120 is evident from Figure 2. As expected, the signal from 12CO is the strongest, followed by 13CO, C18O, and C17O. The peak integrated signal intensity is approximately in the ratio for 12CO : 13CO : C18O : C17O. We did not detect CH3OH in these observations and do not analyze the CH3OH data further. While C17O was detected, the signal is so weak that we do not provide any additional analysis in the remainder of this paper.
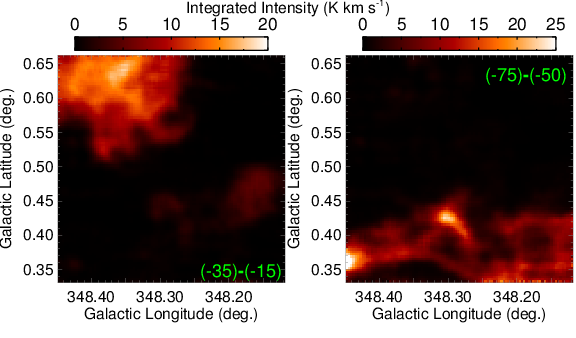
There are three velocity ranges seen in Figure 2 that have detected emission. The strongest emission is found near . Zavagno et al. (2007) found that the velocity of the ionized gas for RCW 120 is in the range to . The CO emission is therefore associated with RCW 120. There is also faint emission from to , and yet fainter emission from to . In Figure 3 we show 12CO integrated intensity maps for the to and to velocity intervals. The emission from the velocity ranges not associated with RCW 120 has lower intensity, and is also spatially distinct from the emission associated with RCW 120. The emission from to seen in Figure 3 is mainly located in the top-left of the observed region. This emission is detected in 12CO, 13CO, and C18O. The emission from to is filamentary and confined to the bottom of the observed field, but there are two bright compact sources. This component is only detected in 12CO and 13CO. One of these compact sources, near = (348.31, +0.42) is nearly spatially coincident with a sub-mm clump named “Condensation 4” in Zavagno et al. (2007). The other compact source near = (348.44, +0.36) has no obvious FIR or sub-mm counterpart. In the remainder of this work we restrict our analysis to the velocity range to .
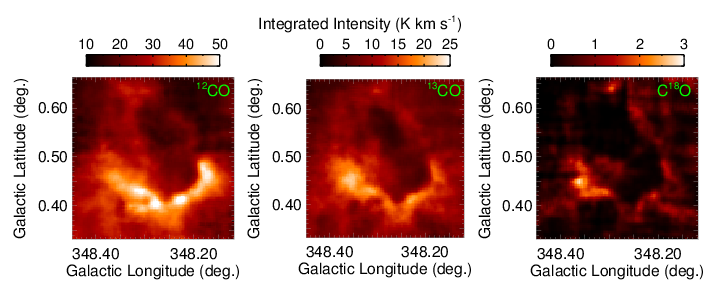
We show the 12CO, 13CO, and C18O integrated intensity images for the full map in Figure 4, integrated over the velocity range to +3 . The PDR of RCW 120 emits most of the CO emission, and the “interior” spatially coincident with the ionized gas is deficient in CO emission relative to the PDR. This same basic morphology is seen in the sub-mm (Deharveng et al., 2009), mm-wave (Zavagno et al., 2007) and Herschel far-infrared regimes (Zavagno et al., 2010; Anderson et al., 2010, 2012). The PDR along the bottom is especially bright in CO, although the PDR is well-traced over the entirety of the RCW 120 bubble.
The three isotopologues in Figure 4 show similar spatial distributions, but there are some notable exceptions. Most obvious is the large extended region of emission to the left of the field that is faint in 12CO, and bright in 13CO and C18O. It is also apparent that the PDR is much thinner in C18O compared to the other isotopologues. This in part is an optical depth effect. As the optical depth increases, we see self-absorption in 12CO and 13CO, but we do not see self-absorption in C18O. Self-absorption reduces the 12CO and 13CO intensity in the densest regions of the PDR. The massive young condensation (“Condensation 1”) along the right side of the PDR at = (), previously detected at mm-, sub-mm, and FIR wavelengths, is barely detected in any isotopologue, indicating strong CO depletion.
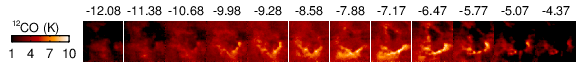
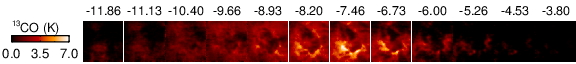
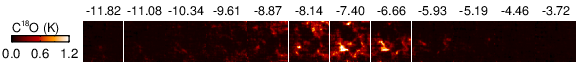
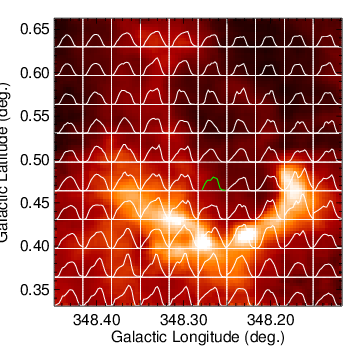
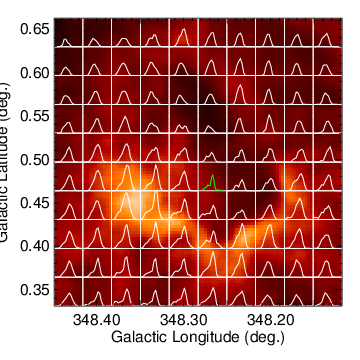
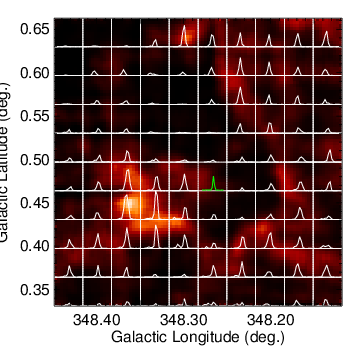
We show channel maps of the CO isotopologues in Figure 5. These channel maps illustrate the complicated velocity field of the CO gas, and also show the differences between the three isotopologues. In particular, the region to the left in the fields is very bright in 13CO and C18O, but not so in 12CO. In Figure 6 we show average spectra on top of the integrated intensity images of Figure 4. Each spectrum in Figure 6 is the average of all spectra within the pixel box. Multiple velocity components are evident for the 12CO and 13CO data, although for most positions C18O only has one detected velocity component. A close examination shows that dips in the spectra often occur at peaks in the and C18O spectra, which is indicative of self-absorption.
We test the optical depth of the data using the standard LTE analysis. In LTE, if the excitation temperatures () of and are the same, and if is optically thick (see Rohlfs & Wilson, 2000),
| (1) |
where is the main beam brightness temperature for , the 2.7 K cosmic microwave background (CMB) is assumed for the background radiation, and
| (2) |
We assume the CMB here for the background because we estimate the free-free emission at 110 GHz is only based on GB6 data (Condon et al., 1989, assuming optically thin emission), and the dust emission is only based on the Herschel 500 µm data (assuming grey-body emission).
To convert from corrected antenna temperature to main beam brightness temperature, we assume a main beam efficiency (see Ladd et al., 2005): . Using the channel with the greatest peak intensity ( for and for ), Equation 2 yields average excitation temperatures over the entire map of K. Using only the 50 pixels with the highest intensity at , the average value is K. We find that 64% of all map pixels at have optical depths less than unity. Nearly all of the 50 brightest pixels at , however, have optical depths greater than unity, with an average value . The average here is approximate because a fraction of pixels are quite optically thick, in which case Equation 1 breaks down. In the central pixels, the average optical depth is at .
We repeated the calculations to evaluate the C18O optical depth (the form and constants in Equation 1 are unchanged for C18O) and found that all pixels have optical depths of C18O less than unity for the channel. We conclude that is for the most part optically thin, although it is optically thick along the PDR for the highest intensity channel, while C18O is optically thin everywhere.
5 Tests for expansion of the molecular gas
The goal of these Mopra CO observations is to test for expansion of the RCW 120 bubble. For three-dimensional objects, expansion along the line of sight will result in blue-shifted emission from the near-side of the object, and red-shifted emission from the far side. These wavelength shifts are in relation to the bubble itself (i.e., the PDR), which will be at a velocity in between that of the near and far side material. If the red- and blue-shifted velocity components cannot be spectrally resolved, the line width will be broader where the expansion is toward and away from the observer.
The optical image of RCW 120 clearly shows absorption from foreground material, running across the face of RCW 120. If RCW 120 is carrying this material through its expansion, we would expect that its spectrum would be blue-shifted relative to the bulk of the emission in the region. This absorption feature provides an ideal near-side filament to test for blue-shifted emission. While it is possible that the absorbing filament is not part of the PDR, but rather is part of a quiescent molecular cloud foreground to the PDR, we regard this option as unlikely. The absorption caused by the filament, seen in Figure 1, stops at the ionized gas boundary. If the filament were part of a larger molecular envelope, we would expect its absorption to be spread over a larger angle, extending beyond the face-on PDR o RCW120.
In the following, we use only 13CO, and C18O data. We exclude the 12CO data because optical depth effects may confuse the analysis.
5.1 Spectra
The most obvious sign of expansion would be the detection of two velocity components in the center of the bubble, one blue-shifted and one red-shifted with respect to the velocity of the PDR gas. If the expansion speed is slower than the line width, the expansion signal may appear as enhancements in the line wings. A high optical depth will complicate the interpretation of the spectra.
Most 13CO spectra in Figure 6 toward the interior of RCW 120 have two velocity components. The situation is complicated by the fact that two components are also seen toward the PDR in many locations, and even outside the bubble in the bottom left of the maps. Therefore, it is difficult to draw firm conclusions from Figure 6.
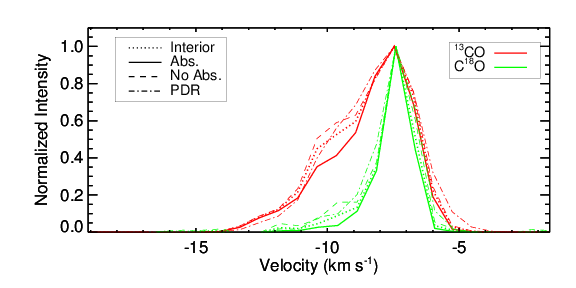
The dark absorption across the face of RCW 120 offers another way to test for expansion. We expect that this material is on the near-side of RCW 120, and that its associated molecular gas will be blue-shifted relative to the PDR of RCW 120. We test this hypothesis by extracting spectra averaged over an aperture defined visually to approximate the extent of the absorbing gas (hereafter the “Absorption” aperture). We also create average spectra from the entire interior of the bubble (“Interior” aperture), at locations of the interior of the bubble where the optical absorption is not seen (“No Absorption” aperture), and from the PDR (“PDR” aperture). These apertures are shown in Figure 7. If there is three-dimensional expansion, we expect that the spectrum from the Absorption aperture has blue-shifted emission, that the spectrum from the No Absorption aperture has red-shifted emission, that the spectrum from the Interior aperture has a mix of these two qualities, and that the velocity from the PDR aperture is in between that of any red- or blue-shifted gas.
We show the spectra created from the apertures defined above in Figure 8. All spectra are normalized by their peak. We find little difference between the four different apertures. For the 13CO data, all apertures can be modeled with two velocity components, one near and one near . Compared to the other apertures, the component of the Absorption aperture is fainter relative to the component. For C18O, again the Absorption aperture spectrum shows decreased intensity of the component relative to the component. We note that the component is quite weak for many of the C18O aperture spectra. If the Absorption aperture has more blue-shifted gas, we would expect the component to be brighter for this aperture, not fainter. Because of the similarity in the shape of the spectra from the four apertures, we conclude that these spectra show no discernible expansion relative to the PDR.
In contrast to the Trifid nebula, another bubble H II region, the material across the face of RCW 120 is not detected in emission at 8.0 µm. For Trifid, the dark dust lanes seen in optical images appear bright at 8.0 µm (Rho et al., 2006, their Figure 1). For RCW 120, the dust lane is not seen in either absorption or emission at 8.0 µm. Figure 8 clearly shows that the dust lane is associated with RCW 120 in velocity, and the fact that it is observed in absorption in H places it in front of the ionized gas. The filament is seen in emission at 870 µm (Deharveng et al., 2009, their Figure 2), indicating that it is cold. The 870 µm emission, however, is faint compared to the emission from the PDR, consistent with our CO observations. We hypothesize that the filaments in the Trifid are more deeply embedded in the H II region, causing the emission at 8.0 µm, and furthermore that they are denser than those of RCW 120. This may be why the filament in RCW 120 is not detected in emission at 8.0 µm (not embedded in the ionized gas) or absorption (too diffuse to cause mid-infrared emission).
5.2 Channel Maps
Something that is difficult to see in the average spectra can be easier to see in channel maps. Again, if expansion is detected, we expect to see blue- and red-shifted material in the interior of the bubble. In the channel maps of Figure 5, this would manifest itself as emission in the interior at low velocities (left side of figure), emission from the PDR at the source velocity (middle of figure), and emission from the interior again at high velocities (right side of figure). This trend is not seen. For C18O, in fact, we see that the “Absorption” aperture region is brightest in the same channel where the PDR emission is the brightest. This indicates that there is little if any expansion relative to the PDR.
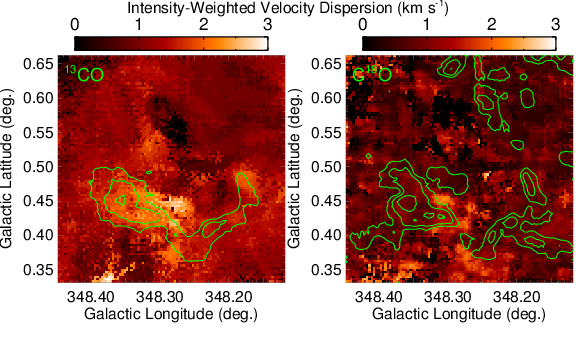
5.3 Second Moment Maps
It is possible that our spectral resolution is not sufficient to detect expansion in the above methods. We therefore create maps of the intensity-weighted velocity dispersion, known as second moment maps (Figure 9). For expanding three-dimensional bubbles, the velocity dispersion would increase in the bubble interior relative to that toward the PDR. The second moment maps for 13CO and C18O do not show such a trend, and in fact the velocity dispersion along the PDR is in many places larger than that of the bubble interior. The average intensity-weighed C18O velocity dispersion in the direction of the interior is , and it is for the PDR (measured in a exterior radius circular annulus that excludes the interior region).
These molecular data show a slightly different picture from the one of Zavagno et al. (2007, their Figure 10). Their H map of RCW 120 has a line width in the interior of , and a line width toward the ionization front of . Assuming a uniform electron temperature across the entire region of 7100 K (see Section 6), this would indicate that the thermal line width is . Adding the thermal and non-thermal line widths in quadrature, we find a non-thermal line width of 20 for the interior and 15 near the ionization front. Both turbulence and ordered expansion contribute to the non-thermal line width. The comparison between the molecular and ionized gas is not straightforward though. The H observations probe the entire volume of ionized gas while the CO observations mainly probe the shell of collected material. For larger scales (i.e., the line of sight in the direction of the bubble interior), we would expect increased line widths, as is seen for molecular clouds (e.g. Larson, 1981). We therefore cannot take the increased H line widths in Zavagno et al. (2007) as evidence for expansion.
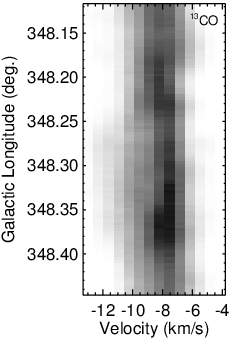
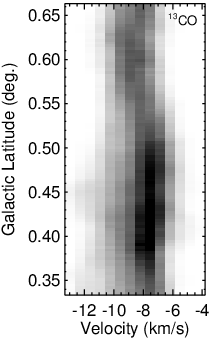
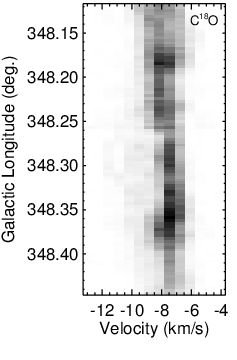
5.4 Position-Velocity Diagrams
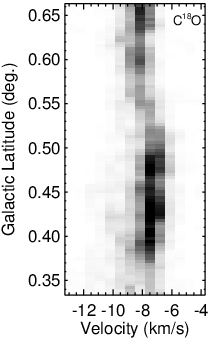
Finally, we make position-velocity diagrams (Figure 10) for and C18O by integrating the cube over one spatial direction. Expansion in a shell should create a circular structure in such a figure. There are a few interesting features in these diagrams, but nothing that can be directly atributed to expansion.
First, there is blue-shifted material near evident at = (), and = . This emission is evident in both isotopologues, although it is much more obvious in . This emission is from a cloud found toward the middle of the (leftmost) panels in the channel maps (Figure 11, see following discussion of this feature). This cloud extends toward the bottom of the maps, beyond the PDR, and therefore does not indicate expansion. It is largely the emission from this cloud that appears as the second component in the aperture photometry spectra (Figure 8). It is therefore not too surprising that the spectra from the various apertures do not show much difference.
The brightest emission in the position-velocity diagrams, and especially that of the C18O longitude-velocity diagram, has a curved shape. Because the PDR extends across the entire frame, this does not indicate that the interior gas is necessarily red-shifted with respect to that of the PDR. Rather, nearly all the emission in Figure 10 is from the PDR, because the interior emission is rather faint by comparison.
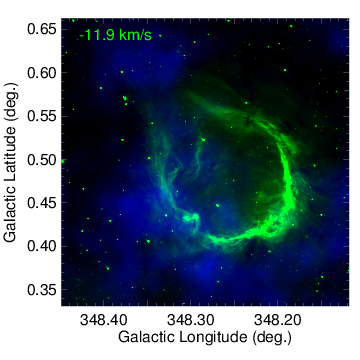
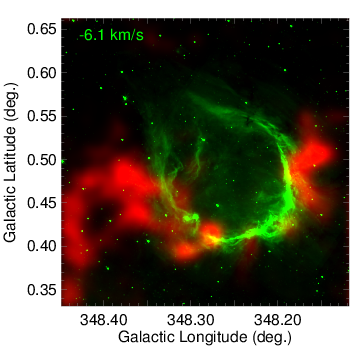
We illustrate these two features in Figure 11, which shows emission at (left panel), (right panel) on top of GLIMPSE 8.0 µm emission mainly from the PDR. The emission is seen toward the left of the field, and outside the PDR on the bottom of the field. The emission is strongest outside the PDR on the left and right sides of the field. It is this emission that is causing the curved shape in the longitude-velocity diagrams.
6 Discussion
We find no conclusive evidence of expansion in the Mopra molecular data. This suggests that RCW 120 is a two-dimensional structure, or that it is spherical but expanding at a rate lower than that detectable in our data. The presence of absorption across the face of RCW 120 from material associated with the region, however, implies that the two-dimensional geometry cannot be correct. It is also possible that RCW 120 is only half a bubble, which would reduce our estimated expansion by a factor of two. Below, we assess the theoretical expansion rate of RCW 120, assuming spherical symmetry.
Spitzer (1978) derived an expression for the time evolution of an H II region:
| (3) |
where is the H II region radius, is the initial Strömgren radius, is the sound speed in the ionized material, and is the elapsed time since the Strömgren radius formed, in seconds. Therefore,
| (4) |
The Strömgren radius, the initial equilibrium size between ionization and recombination, is:
| (5) |
where is the density of the ambient medium around the H II region, and is the recombination coefficient, in units of . Due to a pressure imbalance between the H II region plasma and the neutral material, the expansion of an H II region does not stop at the Strömgren radius.
The initial Strömgren radius depends on and . Martins et al. (2010) found that RCW 120 is ionized by a single star of spectral type O6-8V/III. These spectral types have a range of ionizing photon rates from s-1 for an O8V star to s-1 for an O6III star (Martins et al., 2005). Kuchar & Clark (1997) find an integrated radio flux of 5.5 Jy at 5 GHz for RCW 120, and therefore s-1 for K using the equation from Rubin (1968). Caswell & Haynes (1987) find 8.3 Jy at 5 GHz, which leads to s-1. Even if half the ionizing photons escape or are absorbed by dust within RCW 120, and for a decreased electron temperature of 5000 K, we still only find s-1. We therefore think the high end of the ionizing photon ranges quoted above is unrealistic, and use s-1 to s-1 in the following calculations, which corresponds to O7V-O8V stars (Martins et al., 2005).
The ambient density, is difficult to estimate. From Larson’s laws (Larson, 1981), for molecular clouds , where is the molecular hydrogen density in and the cloud size is in pc. For a radius of 1.9 pc, the density is . We are only concerned with the number of atoms that can be ionized, so this would imply that . Using Herschel data and a dust-to-gas mass of 100, Anderson et al. (2012) found 2000 for the entire RCW 120 bubble. Averaged over a sphere 1.9 pc in radius, the mean atomic density is 2200 . Assuming all this material was swept up during the expansion of RCW 120, 2200 is the mean density of the natal cloud. These are both lower limits to the true density. In both cases we do not know if the original cloud extended to the current radius of RCW 120. Furthermore, there must have been a density profile such that the center of the cloud would have had a higher density. We therefore take 2000 to 6000 to be a reasonable range for .
For the assumed range of ionization rates and ambient densities, we find to 0.32 pc. This calculation depends on the electron temperature of the plasma. Caswell & Haynes (1987) measured the radio recombination line emission and radio continuum emission from RCW 120 at 5 GHz. Using their measured line and continuum intensities, we find an electron temperature of 7100 K, assuming the helium to hydrogen abundance ratio of 0.08 (Quireza et al., 2006a), and using the equations in Balser (1995) and Quireza et al. (2006b). To calculate , we used (Dyson & Williams, 1997), which yeilds s-1. The current radius of RCW 120 is therefore 7–16 . From Equation 4, we expect RCW 120 to be expanding at 1.3 to 2.3 (see also the model in Zavagno et al., 2007). This assumes , which is appropriate for K.
Taking into account the ambient pressure surrounding the H II region, Raga et al. (2012) find for the expansion rate of H II regions:
| (6) |
where is the H II region radius, and , the squared ratio of the ionized to ambient sound speeds. This reduces to Equation 4 if the final term is removed. If to 1.1 (corresponding to molecular hydrogen at a temperature of 15 K and neutral hydrogen of 100 K), to . According to this model, RCW 120 should still be expanding at 1.2 to 2.3 (essentially unchanged from above calculations). These values are consistent with our lack of detected expansion (see below).
Tremblin et al. (2014, submitted) create models that take into account the turbulence of the ambient gas. For RCW 120, they find an expansion velocity of for the ionization front. This is again roughly consistent with our lack of detected expansion. Furthermore, they show that magnetic fields and gravity for a density profile , with , have a negligible effect compared to the turbulence. In a homogeneous medium, the expansion could be slowed further due to the gravity of the central cluster. For RCW 120, 200 to is required for to 6000. While such a cluster mass is possible for a normal initial mass function and a 30 ionizing source, no cluster has yet been detected in RCW 120. There is thus no evidence to suspect that self-gravity is important in slowing the expansion of the region.
How can we interpret these results? All models are able to reproduce the lack of detected expansion. Detecting the expansion of a classical H II region is difficult with such molecular data. This unfortunately implies that we cannot test for the three-dimensional nature of RCW 120 using these data.
6.1 Simulated C18O Spectra
To better understand our data, we model the expansion of a 1.9 pc radius molecular shell of thickness 0.4 pc (20% of the radius), using the three-dimensional line radiative transfer code MOLLIE (Keto et al., 2004; Rawlings et al., 2004; Redman et al., 2006; Carolan et al., 2008; Lo et al., 2011). MOLLIE has been benchmarked against a suite of test problems as per van Zadelhoff et al. (2002), and the models were found to reproduce the test observations to within a few per cent. In order to calculate the level populations, the statistical equilibrium equations are solved using an accelerated lambda iteration (Rybicki & Hummer, 1991), which reduces the radiative transfer equations to a series of linear problems that are solved quickly even in optically thick conditions. For an arbitrary viewing angle to the model cube, ray-tracing is then used to calculate the molecular line intensity as a function of velocity, for a set of positions that matches in number the fixed gridding of the model.
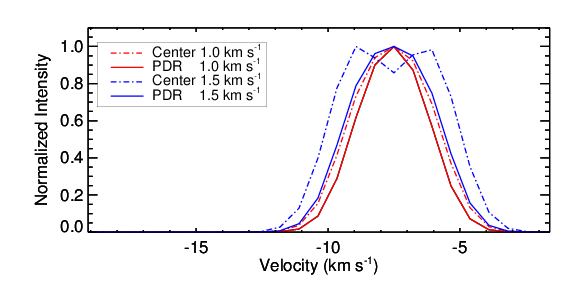
The input to MOLLIE is divided into voxels and there are five input parameters that need to be defined for each voxel: the gas bulk velocity, the gas turbulent velocity, the relative abundance of the molecular species of interest, the gas temperature, and the number density of H2. We create two models, with expansion velocities of 1.0 and 1.5 . We use a value of 1.5 for the magnitude of the turbulent velocity (approximated by inspection of individual spectra), an abundance n()/n(H2) (from Stahl et al., 2008; Lee et al., 1996), a temperature of 30, and a H2 density of . The temperature and H2 density are derived from the dust temperature and column density values from Anderson et al. (2012), for our assumed geometry (the temperature is also broadly consistent with the intensity, with an assumed main beam efficiency of 0.4). Our model grid has spatial locations.
From our model, we create synthetic spectra, shown in Figure 12. The “central” spectrum is from a single pixel at the center of the grid, while the “PDR” spectrum is from a single pixel along the expanding shell boundary. We see that there is no double-peaked expansion profile detectable for 1 , but there is for 1.5 . Compared with the data in Figure 7, we see that our data are more consistent with an expansion speed of 1.0 . A turbulent velocity that exceeds the bulk velocity significantly will always mask an expansion signature, but this turbulent velocity is fairly well-constrained by our data. Our model suggests that RCW 120 is expanding slower than 1.5 .
7 Holes in the perfect bubble
Deficits in the CO emission along the PDR of RCW 120 are apparent in Figure 5. Assuming these emission deficits are true holes in the PDR, they will allow radiation from the central star(s) to escape, ionizing and heating the ISM. Anderson et al. (2010) noted numerous places beyond the ionization front of RCW 120 where the dust temperature, calculated from Herschel data, was enhanced, most notably along the bottom PDR. This indicated that photons from RCW were leaking into the ISM. Because the PDR of RCW 120 appears relatively uniform in the Herschel far-infrared data, it was slightly unclear if this interpretation was correct.
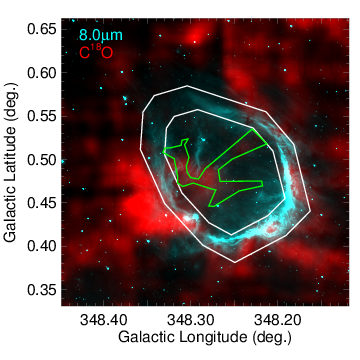
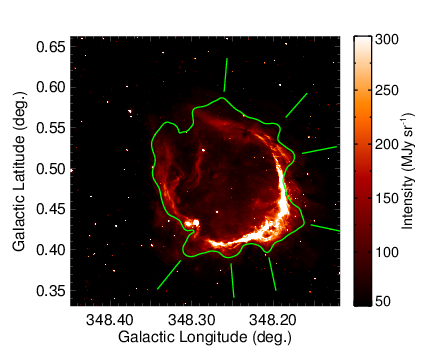
In Figure 13 we attempt to identify these temperature enhancements outside the PDR more clearly. Here we show the GLIMPSE 8.0 µm data with a single contour of Herschel dust temperature from Anderson et al. (2012), at 22 K. This temperature is an average of that found interior to the PDR (for which Anderson et al. (2012) found 24.9 K) and the background interstellar medium (for which Anderson et al. (2012) found K). We mark significant dust temperature enhancements outside the PDR with lines. These enhancements are located along the southern and western edges of the bubble, and coincide with discontinuities in the PDR seen at 8.0 µm (noted previously in Zavagno et al., 2007). The magnitude of the enhancements is . The temperature map did not include 8.0 µm data, and therefore the fact that the temperature enhancements outside the PDR correlate with locations where the PDR is less well-defined at 8.0 µm is not a coincidence.
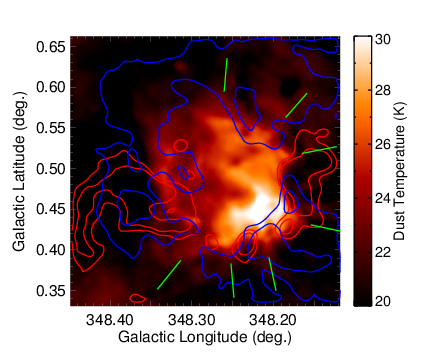
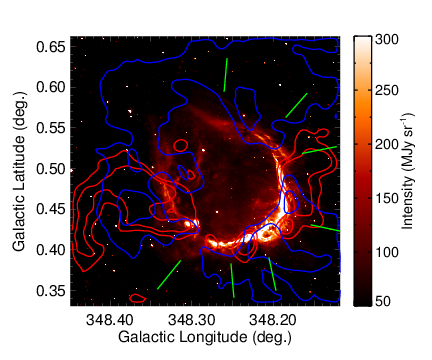
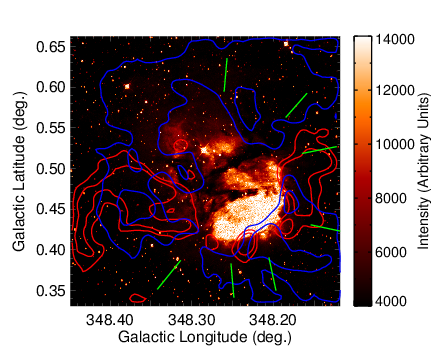
We see in Figure 14 that the enhanced dust temperatures are spatially correlated with the deficits in CO emission, and that the CO deficits are also correlated with discontinuities in the PDR observed at 8.0 µm, and H emission outside the PDR. The green lines indicate positions outside the PDR that have enhanced dust temperatures, from Figure 13 (cf. Anderson et al., 2010). The dust temperature enhancements to the west and east coincide with a lack of CO in the channel, while those to the south are between CO clumps seen in the channel. All evidence suggests that these temperature enhancements are real, caused by the porous PDR of RCW 120, and that the holes in the PDR can be associated with particular CO velocities.
H emission beyond the ionization front of RCW 120 was noted by Zavagno et al. (2007) and Deharveng et al. (2009), who attributed it to the porous PDR. This emission can be clearly seen in Figure 1. There are two components of this emission: bright discrete regions just beyond the ionzation front (most evident for the bottom PDR) and a low intensity “halo” surrounding RCW 120 on all sides. This halo is not perfectly symmetric, but rather is more extended toward the top of the observed field. The bubble itself appears open toward the top of the field in the channel seen in Figure 14. The increased diffuse H intensity toward the top of the field is likely due to the fact that the PDR is weak or absent in this direction at some velocities. The locations of the bright discrete regions outside the PDR coincides with the temperature enhancements in Figure 14, and with a lack of CO emission.
We estimate the amount of flux leaving RCW 120 through these holes using the SuperCosmos H data of Figure 1. Because of the absorption across the face of this region, the H emission underestimates the true H flux. We crudely account for this by assuming that the emission in the absorbing zones across the face of RCW 120 is of the same intensity as that of nearby zones that appear to lack absorption. We perform aperture photometry on the entire region within the PDR (including the absorbing zones “filled in” with nearby average values), and individually on each of the zones outside the PDR identified with green lines in Figure 14, with a local background that is representative of the diffuse H field just outside the PDR. About of the total intensity is emitted in the zones outside the nominal ionization front, identified with green lines in Figure 14. We stress that because of the absorption across RCW 120, this number is rather uncertain.
RCW 120 has a diffuse H “halo,” most likely due to photons leaking from smaller holes in its PDR. Performing aperture photometry over the larger RCW 120 region with an aperture in diameter, we find that % of the intensity associated with RCW 120 is from outside of its PDR. The uncertainties come from different background choices in the aperture photometry. This figure includes the 5% for the discrete zones.
8 Conclusions
We observed the bubble H II region RCW 120 with the Mopra radio telescope in the transitions of , , C18O, and C17O. We also observed, but did not detect emission from the 108.8939 GHz methanol maser transition. The goal of these observations was to search for expansion of the molecular material in the foreground and background PDRs of RCW 120. Such expansion would indicate that RCW 120 is a three-dimensional structure. We do not find conclusive evidence for expansion. This result is in rough agreement with models for the time-evolution of the RCW 120 H II region, and we therefore can make no claims on the three-dimensional nature of this H II region.
We note that CO observations from a single-pointing would not necessarily reach this same conclusion. Many spectra toward RCW 120, have multiple velocity components in optically thin tracers, and this could be taken as evidence for expansion. This should be accounted for in future, similar studies.
Although the strongest CO emission is along the PDR, there are numerous “holes” in the PDR CO emission. The locations of these holes correspond to dust temperature enhancements seen in Herschel data (Anderson et al., 2010, 2012). This indicates that photons are leaving the nearly complete PDR of RCW 120 in discrete locations. An H map of the region confirms this interpretation. We find that of the H flux is found outside the PDR of RCW 120, with found at the locations of these discrete holes.
References
- Anderson et al. (2014) Anderson, L. D., Bania, T. M., Balser, D. S., Cunningham, V., Wenger, T. V., Johnstone, B. M., & Armentrout, W. P. 2014, ApJS, 212, 1
- Anderson et al. (2011) Anderson, L. D., Bania, T. M., Balser, D. S., & Rood, R. T. 2011, ApJS, 194, 32
- Anderson et al. (2010) Anderson, L. D., et al. 2010, A&A, 518, L99+
- Anderson et al. (2012) —. 2012, A&A, 542, A10
- Balser (1995) Balser, D. S. 1995, PhD thesis, Boston University
- Barnes et al. (2001) Barnes, D. G., et al. 2001, MNRAS, 322, 486
- Beaumont & Williams (2010) Beaumont, C. N., & Williams, J. P. 2010, ApJ, 709, 791
- Benjamin et al. (2003) Benjamin, R. A., et al. 2003, PASP, 115, 953
- Carolan et al. (2008) Carolan, P. B., Redman, M. P., Keto, E., & Rawlings, J. M. C. 2008, MNRAS, 383, 705
- Caswell & Haynes (1987) Caswell, J. L., & Haynes, R. F. 1987, A&A, 171, 261
- Churchwell et al. (2006) Churchwell, E., et al. 2006, ApJ, 649, 759
- Churchwell et al. (2007) —. 2007, ApJ, 670, 428
- Condon et al. (1989) Condon, J. J., Broderick, J. J., & Seielstad, G. A. 1989, AJ, 97, 1064
- Deharveng et al. (2009) Deharveng, L., Zavagno, A., Schuller, F., Caplan, J., Pomarès, M., & De Breuck, C. 2009, A&A, 496, 177
- Deharveng et al. (2010) Deharveng, L., et al. 2010, A&A, 523, A6+
- Deharveng et al. (2012) —. 2012, A&A, 546, A74
- Dyson & Williams (1997) Dyson, J. E., & Williams, D. A. 1997, The physics of the interstellar medium (The physics of the interstellar medium. Edition: 2nd ed. Publisher: Bristol: Institute of Physics Publishing, 1997. Edited by J. E. Dyson and D. A. Williams. Series: The graduate series in astronomy. ISBN: 0750303069)
- Elmegreen & Lada (1977) Elmegreen, B. G., & Lada, C. J. 1977, ApJ, 214, 725
- Heyer et al. (1996) Heyer, M. H., Carpenter, J. M., & Ladd, E. F. 1996, ApJ, 463, 630
- Kahn (1954) Kahn, F. D. 1954, Bull. Astron. Inst. Netherlands, 12, 187
- Keto et al. (2004) Keto, E., Rybicki, G. B., Bergin, E. A., & Plume, R. 2004, ApJ, 613, 355
- Kirsanova et al. (2008) Kirsanova, M. S., Sobolev, A. M., Thomasson, M., Wiebe, D. S., Johansson, L. E. B., & Seleznev, A. F. 2008, MNRAS, 388, 729
- Kuchar & Clark (1997) Kuchar, T. A., & Clark, F. O. 1997, ApJ, 488, 224
- Ladd et al. (2005) Ladd, N., Purcell, C., Wong, T., & Robertson, S. 2005, PASA, 22, 62
- Larson (1981) Larson, R. B. 1981, MNRAS, 194, 809
- Lee et al. (1996) Lee, H.-H., Bettens, R. P. A., & Herbst, E. 1996, A&AS, 119, 111
- Lo et al. (2011) Lo, N., Redman, M. P., Jones, P. A., Cunningham, M. R., Chhetri, R., Bains, I., & Burton, M. G. 2011, MNRAS, 415, 525
- Martins et al. (2010) Martins, F., Pomarès, M., Deharveng, L., Zavagno, A., & Bouret, J. C. 2010, A&A, 510, A32+
- Martins et al. (2005) Martins, F., Schaerer, D., & Hillier, D. J. 2005, A&A, 436, 1049
- Parker et al. (2005) Parker, Q. A., et al. 2005, MNRAS, 362, 689
- Patel et al. (1995) Patel, N. A., Goldsmith, P. F., Snell, R. L., Hezel, T., & Xie, T. 1995, ApJ, 447, 721
- Pavlyuchenkov et al. (2013) Pavlyuchenkov, Y. N., Kirsanova, M. S., & Wiebe, D. S. 2013, Astronomy Reports, 57, 573
- Povich et al. (2007) Povich, M. S., et al. 2007, ApJ, 660, 346
- Quireza et al. (2006a) Quireza, C., Rood, R. T., Balser, D. S., & Bania, T. M. 2006a, ApJS, 165, 338
- Quireza et al. (2006b) Quireza, C., Rood, R. T., Bania, T. M., Balser, D. S., & Maciel, W. J. 2006b, ApJ, 653, 1226
- Raga et al. (2012) Raga, A. C., Cantó, J., & Rodríguez, L. F. 2012, MNRAS, 419, L39
- Rawlings et al. (2004) Rawlings, J. M. C., Redman, M. P., Keto, E., & Williams, D. A. 2004, MNRAS, 351, 1054
- Redman et al. (2006) Redman, M. P., Keto, E., & Rawlings, J. M. C. 2006, MNRAS, 370, L1
- Rho et al. (2006) Rho, J., Reach, W. T., Lefloch, B., & Fazio, G. G. 2006, ApJ, 643, 965
- Rodgers et al. (1960) Rodgers, A. W., Campbell, C. T., & Whiteoak, J. B. 1960, MNRAS, 121, 103
- Rohlfs & Wilson (2000) Rohlfs, K., & Wilson, T. L. 2000, Tools of radio astronomy (Tools of radio astronomy / K. Rohlfs, T.L. Wilson. New York : Springer, 2000. (Astronomy and astrophysics library, ISSN0941-7834))
- Rubin (1968) Rubin, R. H. 1968, ApJ, 154, 391
- Rybicki & Hummer (1991) Rybicki, G. B., & Hummer, D. G. 1991, A&A, 245, 171
- Samal et al. (2014) Samal, M. R., et al. 2014, ArXiv e-prints
- Sault et al. (1995) Sault, R. J., Teuben, P. J., & Wright, M. C. H. 1995, in Astronomical Society of the Pacific Conference Series, Vol. 77, Astronomical Data Analysis Software and Systems IV, ed. R. A. Shaw, H. E. Payne, & J. J. E. Hayes, 433
- Schuller et al. (2009) Schuller, F., et al. 2009, A&A, 504, 415
- Simpson et al. (2012) Simpson, R. J., et al. 2012, MNRAS, 424, 2442
- Spitzer (1978) Spitzer, L. 1978, Physical processes in the interstellar medium, ed. Spitzer, L.
- Stahl et al. (2008) Stahl, O., Casassus, S., & Wilson, T. 2008, A&A, 477, 865
- Thompson et al. (2012) Thompson, M. A., Urquhart, J. S., Moore, T. J. T., & Morgan, L. K. 2012, MNRAS, 421, 408
- van Zadelhoff et al. (2002) van Zadelhoff, G.-J., et al. 2002, A&A, 395, 373
- Watson et al. (2009) Watson, C., Corn, T., Churchwell, E. B., Babler, B. L., Povich, M. S., Meade, M. R., & Whitney, B. A. 2009, ApJ, 694, 546
- Wright et al. (2010) Wright, E. L., et al. 2010, AJ, 140, 1868
- Zavagno et al. (2007) Zavagno, A., Pomarès, M., Deharveng, L., Hosokawa, T., Russeil, D., & Caplan, J. 2007, A&A, 472, 835
- Zavagno et al. (2010) Zavagno, A., et al. 2010, A&A, 518, L81+