Numerical simulation of liver perfusion: from CT scans to FE model
Abstract
We use a collection of Python programs for numerical simulation of liver perfusion. We have an application for semi-automatic generation of a finite element mesh of the human liver from computed tomography scans and for reconstruction of the liver vascular structure. When the real vascular trees can not be obtained from the CT data we generate artificial trees using the constructive optimization method. The generated FE mesh and vascular trees are imported into SfePy (Simple Finite Elements in Python) and numerical simulations are performed in order to get the pressure distribution and perfusion flows in the liver tissue. In the post-processing steps we calculate transport of a contrast fluid through the liver parenchyma.
Index Terms:
segmentation, liver perfusion, multicompartment model, finite element method, finite volume method1 Introduction
A patient specific numerical modelling of liver perfusion requires cooperation of people with different specializations. Our research group consists of cyberneticians, informaticians, mechanicians and physicians who formulate problems to be solved and who are able to judge the outcomes of mathematical models and simulations from the point of view of medicine. The research is motivated by the needs of surgeons, they would like to have efficient tools for better planning of liver surgeries and who would also appreciate to be able to predict changes of liver perfusion caused by diseases or after surgical resections.
The task of numerical modelling of a human liver can be divided into two sub-problems. First of all, the geometry of larger vascular structures and hepatic parenchyma must be identified from data obtained by computed tomography (CT) or magnetic resonance imaging (MRI) examinations. With the knowledge of liver shape and vascular structures, the numerical simulations of liver perfusion can be performed using different mathematical models of blood flow at different spatial scales. The question, how to obtain all the necessary parameters of our models (permeabilities, etc.) is out of the scope of this paper. More information can be found in [Roh12b] or [Coo12].
The mathematical model of tissue perfusion presented in this paper has been already used for similar problems, e.g. for cardiac perfusion [Mic13]. With this in mind, our modelling approach seems to be reasonable in the context of current computational biomechanics.
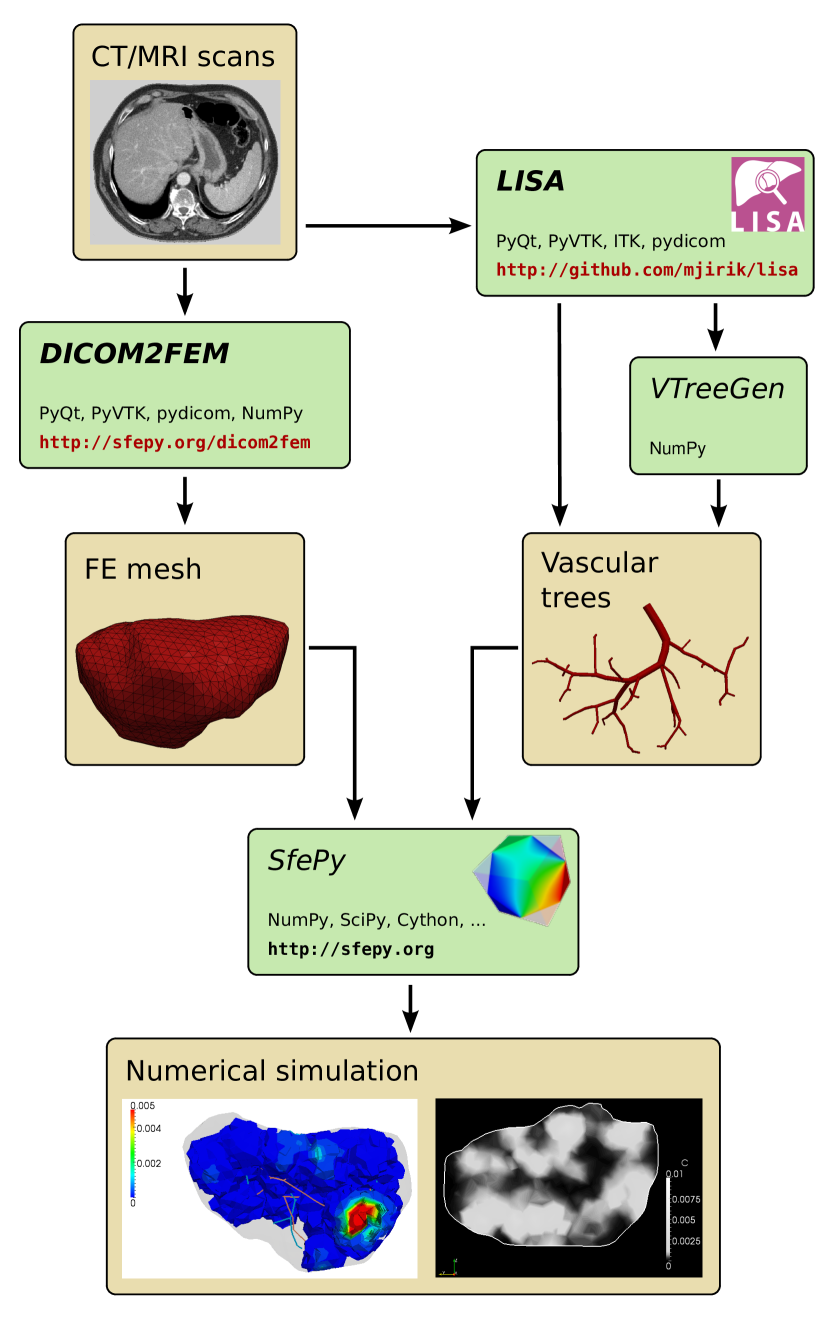
The main part of computation is performed in SfePy, which is an open source Python framework for solving various problems described by partial differential equations, see [Cim14], [Cim14b]. Because we participate in the development of the code, we have a full control over the computational process and we are able to easily modify the code or extend it to solve specific tasks. To extract geometrical data of the liver and vascular structures from CT/MRI scans, we had to develop own tools (DICOM2FEM, LISA, VTreeGen) due to unavailability of any suitable open source applications that would meet our demands on reliability, efficiency, portability and simplicity of use. The processing toolchain for the numerical simulation of liver perfusion is depicted in Fig. 1.
2 Volumetric model of liver parenchyma
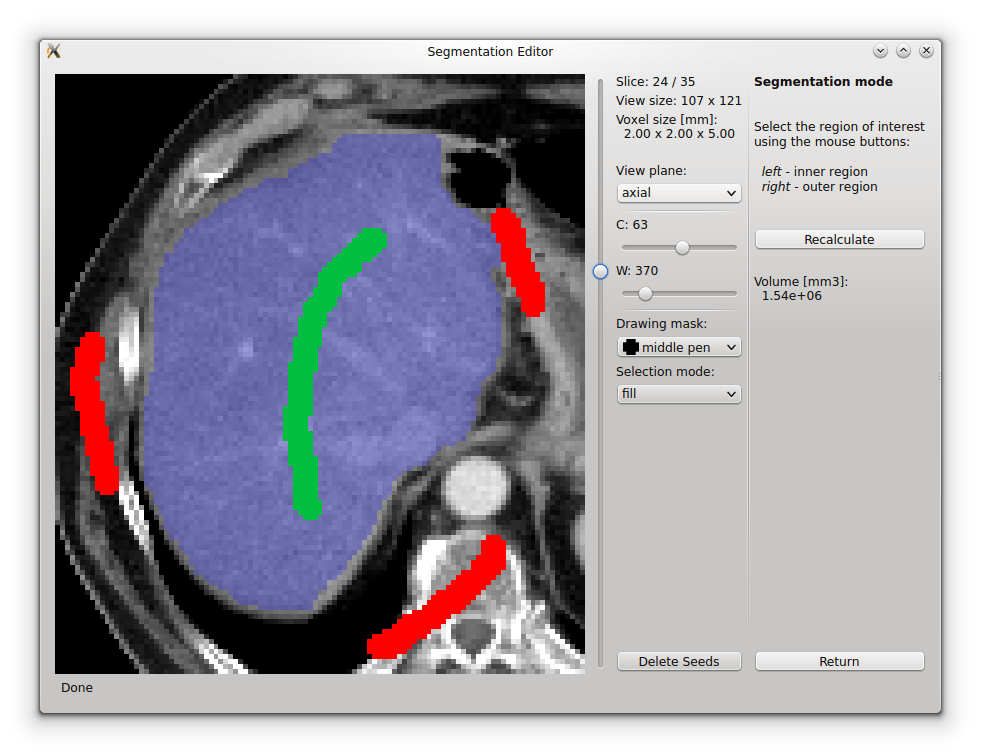
We developed an application called DICOM2FEM [Luk14] for semi-automatic segmentation and generation of finite element meshes from CT scans stored in the DICOM file format. Because it is a standard format for storing information in medical imaging we are able to process data from a wide range of sources (Magnetic Resonance Imaging, Positron Emission Tomography, etc.). A series of the DICOM files is handled by the pydicom library [Mas14]. The graphical user interface of DICOM2FEM (Fig. 2) is build up using PyQt library and the resulting data structures are stored to the VTK (Visualization Toolkit) file by the help of PyVTK. Segmented bodies can be visualized using a simple VTK viewer implemented in the application.
2.1 Segmentation
Segmentation of the liver parenchyma from computed tomography or magnetic resonance data is hard to solve because of low density (intensity) contrast to adjacent organs like stomach or hearth. Moreover, large individual anatomy differences should be taken into account. Various methods for segmentation are compared in [Mha12] and [Hei09].
Our segmentation approach is based on the Graph-Cut method described in [Boy01] and [Boy06]. We use the original implementation of max-flow/min-cut algorithm [Kol14] and the Python wrapper by Andreas Müller [Mül14]. Known weakness of the algorithm is great memory demand, memory usage is quickly increasing as the data size grows. In our case we define a region of interest and downsampling to suppress this disadvantage. The Graph-Cut method combines advantages of region and edge based segmentation methods. It minimizes cost function :
| (1) |
where is the image segmentation, is connected to region properties of the image and comprises boundary properties of the segmentation. The coefficient specifies weight of the region and the boundary term .
For our purpose, the main benefit of this algorithm is a precise control of the segmentation process. As it is shown in Fig. 2, the user (experienced in human anatomy) interactively selects the liver tissue with the left mouse button (green seeds) and the regions out of the liver with the right mouse button (red seeds). Based on the seeds the density three component Gaussian mixture model is estimated for the liver and the outer region. Using the Gaussian model a graph representing input data and seeds is constructed. By minimizing the cost function using the max-flow/min-cut algorithm, the segmentation of the CT scans is computed.
2.2 Mesh generation
The result of the segmentation process is a 3-dimensional binary array (voxel array) together with information about the real size of the voxels. The marching cubes algorithm [Lor87] is used to generate polygonal mesh of the organ surface. To improve the quality of surface mesh, we apply the Taubin smoothing procedure [Tau95] that is able to preserve the total volume of the segmented organ. The smoothing approach is based on signal processing on meshes, see Ref. [Tau00], and provides meshes of good quality.
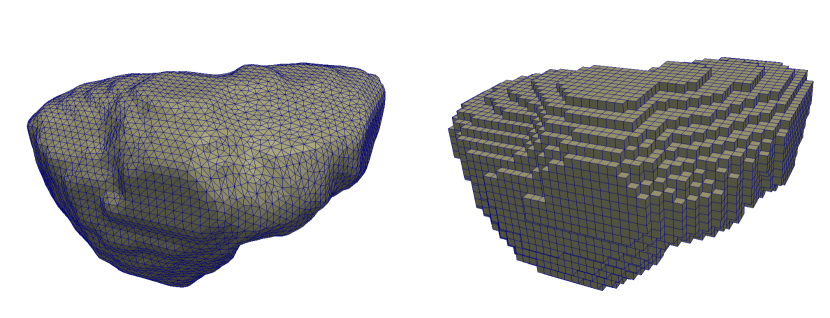
The smoothed surface mesh is consequently processed by a tetrahedral meshing function to get the volumetric FE model of the organ. The marching cubes algorithm is computationally expensive so we implemented the fast mesh generator (volumetric or surface), but it produces a mesh with stair-step surface which can not be easily smoothed. The fast generator is mainly used for testing purposes or for quick preview of the FE model of body parts, for comparison of both approaches see Fig. 3.
3 Geometric model of vascular structures
1D models (trees) of the portal and hepatic vessels are crucial for the numerical modelling of liver perfusion. We use them in computation of fluxes and pressures in tree branches and in calculation of transport times of contrast fluid within the vascular trees.
3.1 Reconstruction of vascular structures
We obtain real vascular trees from CT scans using LISA (LIver Surgery Analyser) [Jir14]. It was developed as a tool for surgeons to help them in a preoperative planning of liver resections. To be able to analyze and detect the vascular structure, we need data form perfusion CT examinations, when a contrast fluid is injected into the blood system of a patient and the CT examinations are synchronized to capture the filling period of the portal and hepatic systems in the liver. Due to physiological conditions, automated detection of the liver portal tree is an easier task then in the case of the hepatic tree.
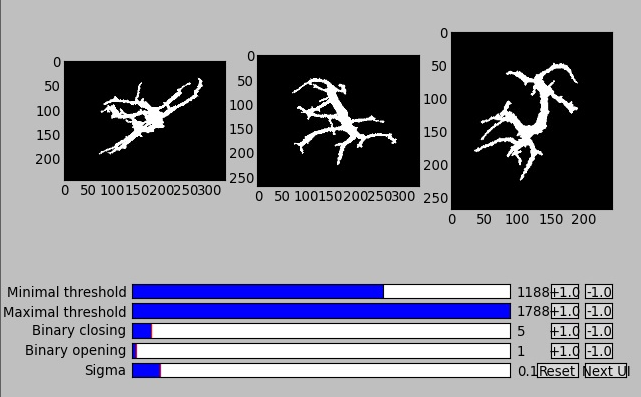
Segmentation of a vessel tree is based on the algorithm described in [Sel02] with several modifications. In order to improve the quality of CT data, we use the Gaussian blur denoising filter during the preprocessing steps. We have automatic threshold selection based on a histogram of the image, but the user is able to control this operation by setting seed points. User interactivity is essential when segmenting the vena cava, where the blood with a dissolved contrast fluid is mixed with the blood from the rest of the body. The segmented 3D data are smoothed using a set of morphological operations - opening and closing.
A voxel-based representation of the vascular structures is transformed into a graph representation preserving all important geometric information (lengths, diameters, orientations, etc.) of the vessel trees. ITK implementation of the 3D thinning algorithm [Hom07] is employed.
3.2 Generation of artificial vascular trees
Unfortunately, the detection of vascular structures is a very complicated task with uncertain results. The input data are often fuzzy or the vessels are not completely filled by the contrast fluid, so the automated algorithm generates disconnected trees or trees with various non-physiological artifacts. To avoid problems in further simulation steps, we propose to take just a part of the reconstructed tree and to generate the rest artificially using the constructive optimization method [Geo10]. This method is based on minimization of intravascular blood volume and energy lost to friction. For global optimization, a multilevel strategy with topological changes is used.
The whole optimization process consists of several steps: smoothing, pruning and reconnecting. The smoothing step includes relaxation of branching nodes which leads to a local minimum of the cost function in a neighbourhood of a given node. When the relaxation places two neighbour points at the same location, they are joined together. During the smoothing operation, the branching points are tested for splitting, this operation splits single branching into two smaller to minimize the global cost. The splitting operation is crucial step in the optimization process but also very computationally expensive. In [Geo10], an efficient algorithm reducing this complexity is proposed. The smoothing loop is repeated until the global cost is minimized and further minimization can be achieved only by changing the tree topology. Branches in a certain hierarchy, see Fig. 5, (based on the Horton-Strahler order) are discarded (pruned) and terminal nodes are reconnected to the nearest nodes in the pruned tree. This procedure increases the freedom for the optimization process and allows to find the better minimum of a cost function. The smoothing-pruning-reconnecting loop is repeated several times according to the number of hierarchies in the tree.
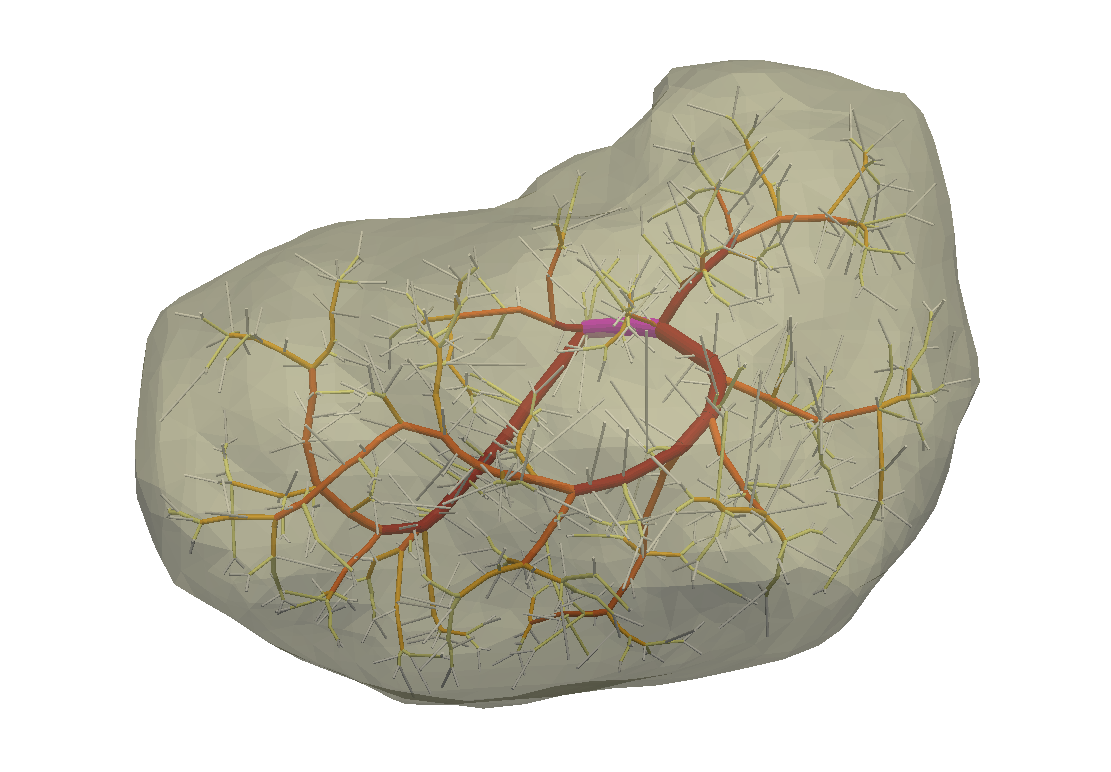
We take the main branching part up to a certain diameter of the vessels and generate randomly hundreds or thousands points inside the liver volume. These points are considered as terminal points of the vascular tree and are connected to the nearest branching points of the reconstructed part. After the optimization, the artificial trees based on real data with well defined hierarchy are obtained (Fig. 6).
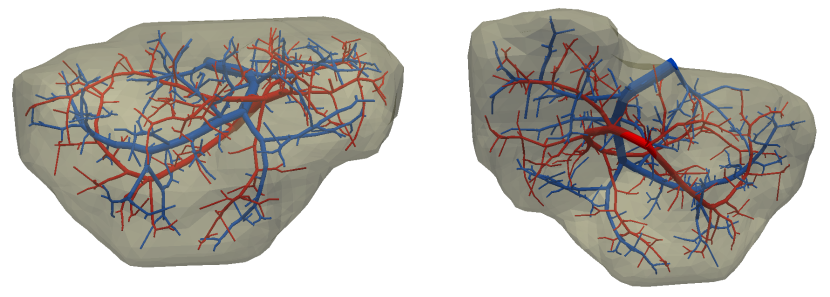
Our Python code for generating artificial vascular trees is called VTreeGen, see Fig. 1. It is not yet publicly available as other tools presented in this paper.
4 Mathematical model of liver perfusion
Numerical modelling of blood flow through the human liver presents a complex task due to a wide range of scales involved in the problem making it necessary to use different mathematical models for each group of scales. The flow in branching vessels with diameters above 2 mm is described by a simple 1D model based on the Bernoulli equation while the blood flow at lower hierarchies is modelled as parallel flows in a 3D porous media governed by the Darcy’s equation. Spatially co-existing domains are referred as compartments, each of them reflects a certain hierarchy of the tissue vascularity. The compartments are coupled together and communicate with the 1D flow model through sources and sinks, see Refs. [Roh12], [Roh12b], [Mic13], [Joa14].
The multicompartment approach allows to respect the different characteristic features of perfusion hierarchies present in the tissue parenchyma. Each compartment is associated with a permeability tensor that reflects the vascular structure (vessel size and orientation) at a given hierarchy level. The fluid exchange between different compartments is driven by a coupling coefficient.
4.1 Blood flow in vascular trees
We assume that the simple 1D flow model gives sufficient accuracy in the context of our simulations. The main advantage of the 1D model is the minimal computational cost compared to a full 3D flow simulation which obviously would give more realistic results. A detailed study of 3D and 1D flow models can be found in [Joa14b].
The mathematical model of the flow in the branching tree can be described by the mass conservation and Bernoulli equations:
| (2) |
| (3) |
where is the cross-section of branches and is the number of terminal nodes (sources/sinks) connected to the liver parenchyma.
The terms represent the friction loss in inelastic tubes and are defined as:
| (4) |
where is the fluid density, and are the length and diameter of the branch and is the Reynolds number.
4.2 Darcy flow in parenchyma
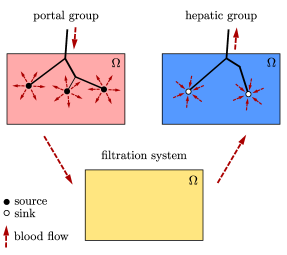
We assume a simple idealized model of liver perfusion comprising of three co-existing compartments. The first one is attached to the 1D portal venous tree such that the terminal branches of the tree are local sources for the Darcy model. The second (middle) compartment represents the filtration system of liver lobules. The last compartment is connected to the hepatic vessel tree and the connecting points play a role of sinks of the perfusion system, see Fig. 7
The multicompartment Darcy system of compartments can be written as:
| (5) |
| (6) |
for , where is the local permeability of the -th compartment network and is the perfusion coefficient related to compartments , , so that describes the amount of fluid going from to ( is symmetric, i.e. = ). In our case, when only three compartments are considered, as shown in Fig. 7, we take coupling parameters , (and also , ) , otherwise .
The discretized perfusion model is based on the weak formulation of (5) and (6): Find such that for all :
| (7) |
for all compartments , where , are admissible sets, for more details see Ref. [Roh12].
The multicompartment Darcy flow model is implemented in SfePy (Simple Finite Elements in Python), see [Cim14], [Cim14b]. SfePy is a framework for solving various kinds of problems (mechanics, physics, biology, …) described by partial differential equations in two or three space dimensions by the finite element method. The code is written mostly in Python (C and Cython are used in some places due to speed). Solvers and algorithms from SciPy [Jon14] are used as well.
4.3 Transport of contrast fluid
To assess the computed liver perfusion and possibly to compare the numerical results with real perfusion data in the future, a dynamic perfusion test is simulated. This test involves the modelling of contrast fluid (tracer) transport through the hepatic tissue using the perfusion velocities computed by the Darcy flow model for each of the parenchyma compartments. The equations governing not only the transport of the contrast fluid within one compartment, but also its exchange between several compartments are numerically solved using an upwind cell-centered finite volume scheme formulated for unstructured grids in combination with the second-order accurate two-stage Runge-Kutta method [Joa14].
4.4 Numerical results
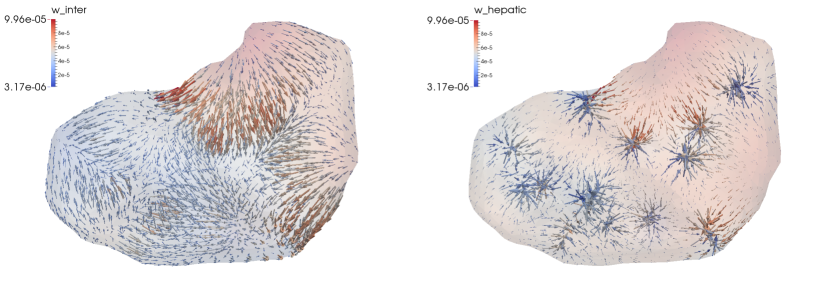
The results of numerical simulations of tissue perfusion in the three compartment model are shown in Fig. 8, where the computed perfusion velocities in the filtration (inter) and hepatic compartments are depicted.
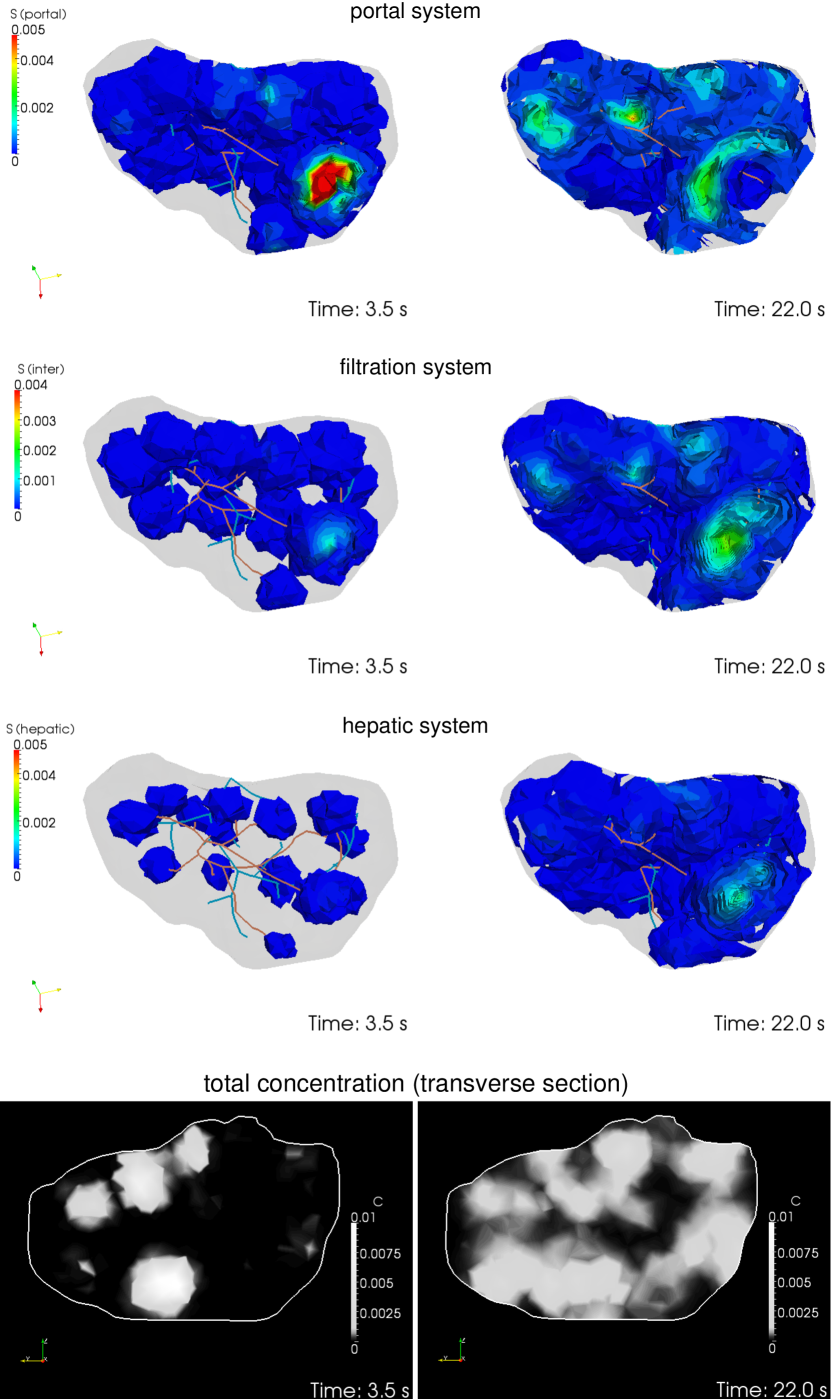
For illustration, Fig. 9 shows the tracer distribution in an image-based model of human liver at selected time instants including the corresponding total concentration as would be seen in a CT scan. Here, the content of the tracer dissolved in the blood in each compartment (portal, filtration and hepatic) is expressed by the saturation .
5 Conclusion
Using Python with standard modules for scientific computing and image processing together with the Python based finite element solver SfePy and a collection of developed supporting applications, we are able to produce a simplified patient specific liver model and numerically simulate hepatic blood perfusion.
CT data are processed by the semi-automatic segmentation algorithms generating 1D structures representing the vascular trees and a 3D volumetric model of the liver tissue. In case of incomplete or unreliable results of the vascular trees reconstruction, we fabricate artificial trees using constructive optimization approach. The reconstructed or fabricated 1D trees and the volumetric liver model are employed in numerical simulations of liver blood perfusion using the finite element method. The model of contrast fluid propagation provides time-dependent concentration of the tracer, that can be compared with the standard medical measurements. It will allow us to solve the inverse problem in order to identify some of the perfusion parameters of our models. This is a crucial point for further development.
Despite the fact that there is still a wide gap between our current research and clinical practice, the LISA application was successfully tested by radiologists and surgeons for volumetric analyses of livers prior to surgeries and is now actively used.
5.1 Acknowledgment
This research is partially supported by the Ministry of Health of the Czech Republic, project NT 13326, and by the European Regional Development Fund (ERDF), project "NTIS - New Technologies for the Information Society", European Centre of Excellence, CZ.1.05/1.1.00/02.0090.
References
- [Boy01] Y. Boykov, O. Veksler, R. Zabih. Fast approximate energy minimization via graph cuts. In Pattern Analysis and Machine Intelligence, 23(11):1222-1239, 2001.
- [Boy06] Y. Boykov, G. Funka-Lea. Graph Cuts and Efficient N-D Image Segmentation. In International Journal of Computer Vision, 70:109–131, 2006.
- [Cim14] R. Cimrman, et al. SfePy, finite element code and applications. Home page: http://sfepy.org [Accessed 2014-08-20].
- [Cim14b] R. Cimrman. SfePy - Write Your Own {FE} Application. In Proceedings of the 6th European Conference on Python in Science (EuroSciPy 2013), pages 65-70, 2014. http://arxiv.org/abs/1404.6391.
- [Coo12] A. N. Cookson, J. Lee, C. Michler, R. Chabiniok, E. Hyde, D. A. Nordsletten, M. Sinclair, M. Siebes, N. P. Smith. A novel porous mechanical framework for modelling the interaction between coronary perfusion and myocardial mechanics. In Journal of Biomechanics, 45(5):850-855, 2012.
- [Geo10] M. Georg, T. Preusser, H. K. Hahn. Global Constructive Optimization of Vascular Systems. Technical Report: Washington University in St. Louis. http://cse.wustl.edu/Research/Lists/TechnicalReports/Attachments/910/idealvessel_1.pdf.
- [Hei09] Heimann et al. Comparison and evaluation of methods for liver segmentation from CT datasets. In IEEE Transactions on Medical Imaging, 28(8):1251-1265, 2009.
- [Hom07] H. Homann. Implementation of a 3D thinning algorithm. In Insight Journal, July - December, 2007.
- [Jir14] M. Jiřík. LISA - LIver Surgery Analyser. Home page: https://github.com/mjirik/lisa [Accessed 2014-08-20].
- [Joa14] A. Jonášová, E. Rohan, V. Lukeš, O. Bublík. Complex hierarchical modeling of the dynamic perfusion test: application to liver. In Proceedings of 11th World Congres of Computational Mechanics, 2014.
- [Joa14b] A. Jonášová, O. Bublík, E. Rohan, J. Vimmr. Simulation of contrast medium propagation based on 1D and 3D portal hemodynamics. In: Proc. of the 20th International Conference Engineering Mechanics, Svratka, Czech Republic, 2014.
- [Jon14] E. Jones, T. E. Oliphant, P. Peterson, et al. SciPy: Open source scientific tools for Python. Home page: http://www.scipy.org [Accessed 2014-08-20].
- [Kol14] V. Kolmogorov. Max-flow/min-cut. Home page: http://vision.csd.uwo.ca/code/ [Accessed 2014-08-20].
- [Lor87] W. E. Lorensen, H. E. Cline. Marching Cubes: A high resolution 3D surface construction algorithm. Computer Graphics, Vol. 21, Nr. 4, 1987.
- [Luk14] V. Lukeš. DICOM2FEM - application for semi-automatic generation of finite element meshes. Home page: http://sfepy.org/dicom2fem [Accessed 2014-08-20].
- [Mas14] D. Mason. pydicom, available at https://code.google.com/p/pydicom/ [Accessed 2014-08-20].
- [Mha12] A. M. Mharib, A. R. Ramli, S. Mashohor, R. B. Mahmood. Survey on liver CT image segmentation methods. In Artificial Intelligence Review, 37(2):83-95, 2012.
- [Mic13] C. Michler, A. Cookson, R. Chabiniok, E. Hyde, J. Lee, M. Sinclair, T. Sochi, A. Goyal, G. Vigueras, D. Nordsletten, N. Smith. A computationally efficient framework for the simulation of cardiac perfusion using a multi-compartment Darcy porous-media flow model. Int. Journal for Numerical Methods in Biomedical Engineering, 29(2):217-32, 2013.
- [Mül14] A. Müller. Python wrappers for GCO alpha-expansion and alpha-beta-swaps. Home page: https://github.com/amueller/gco_python [Accessed 2014-08-20].
- [Oli07] T. E. Oliphant. Python for scientific computing. In Computing in Science & Engineering, 9(3):10-20, 2007. Home page: http://www.numpy.org.
- [Tau95] G. Taubin. A signal processing approach to fair surface design. In Siggraph’95 Conference Proceedings, pages 351–358, 1995.
- [Tau00] G. Taubin. Geometric Signal Processing on Polygonal Meshes., In EUROGRAPHICS 2000, 2000.
- [Roh12] E. Rohan, V. Lukeš, A. Jonášová, O. Bublík. Towards microstructure based tissue perfusion reconstruction from CT using multiscale modeling. In Proc. of the 10th World Congress on Computational Mechanics, Sao Paulo, Brasil, 2012.
- [Roh12b] E. Rohan, V. Lukeš. Modeling tissue perfusion using a homogenized model with layer-wise decomposition. In Preprints MATHMOD 2012, Vienna University of Technology, Austria, (2012).
- [Sel02] D. Selle, B. Preim, A. Schenk, H. O. Peitgen. Analysis of vasculature for liver surgical planning. In IEEE Transactions on Medical Imaging, 21(11):1344-1357, 2002.