Multiwaveband photometry of the irradiated brown dwarf WD0137-349B
Abstract
WD0137-349 is a white dwarf-brown dwarf binary system in a 116 minute orbit. We present radial velocity observations and multiwaveband photometry from , and in the optical, to , and in the near-IR and [3.6], [4.5], [5.8] and [8.0] m in the mid-IR. The photometry and lightcurves show variability in all wavebands, with the amplitude peaking at [4.5] microns, where the system is also brightest. Fluxes and brightness temperatures were computed for the heated and unheated atmosphere of the brown dwarf (WD0137-349B) using synthetic spectra of the white dwarf using model atmosphere simulations. We show that the flux from the brown dwarf dayside is brighter than expected in the and [4.5] m bands when compared to models of irradiated brown dwarfs with full energy circulation and suggest this over-luminosity may be attributed to H2 fluorescence or H being generated in the atmosphere by the UV irradiation.
keywords:
stars: brown dwarfs, white dwarfs, binaries: close1 Introduction
WD0137-349 is one of only 4 known detached post-common envelope binaries containing a white dwarf and a brown dwarf companion. The other three are: GD1400, (WD+L6, P=9.98hrs Farihi & Christopher 2004; Dobbie et al. 2005; Burleigh et al. 2011), WD0837+185 (WD+T8, P=4.2hrs Casewell et al. 2012) and NLTT5306 (WD+L4-L7, P=101.88 min Steele et al. 2013). Another eclipsing, candidate system has recently been reported (CSS21055, Beuermann et al. 2013) but is yet to be confirmed via radial velocity or spectroscopy.
WD0137-349 was discovered in 2006 by Maxted et al. (2006) and better characterised by Burleigh et al. (2006) using spectra from the Gemini telescope and the Gemini Near-InfraRed Spectrograph (GNIRS). The system is composed of a 0.4M⊙ DA white dwarf (Teff=16500 K) and a secondary of mass 53 MJup. The period of the system is 116 minutes and the estimated separation is 0.65R⊙ (Maxted et al., 2006). Burleigh et al. (2006) determined from the GNIRS spectra that an L8 is the most likely spectral type for the brown dwarf, and that it has not likely been affected by common envelope evolution. Such systems are not only important from an evolutionary point of view, giving us insight into the common envelope parameters (e.g. Casewell et al. 2012), but also provide insight into the properties of irritated atmospheres. WD0137-349B is a brown dwarf that intercepts 1 per cent of the light from its white dwarf companion. Due to the high effective temperature (16500 K) of the white dwarf, this light is primarily in the ultraviolet regime. As the system is likely tidally locked, this means one side of the brown dwarf is continually irradiated by the white dwarf. This situation is similar to that in many exoplanets such as Wasp-12 b (Hebb et al., 2009) and HD189733b (Knutson et al., 2012). Observing white dwarf+brown dwarf binaries have two advantages over similar exoplanet systems. The first is that brown dwarf atmospheres are well characterised (e.g. Cushing et al. 2005), and that brown dwarf atmosphere modelling is more advanced than that of exoplanets. The second is that brown dwarfs are relatively bright so we can directly observe the brown dwarf in the band and at longer wavelengths where the brown dwarf is brighter than its white dwarf companion (Maxted et al. 2006; Burleigh et al. 2006; Casewell et al. 2013).
2 Observations and Data Reduction
2.1 UVES spectra
We obtained 50 spectra of WD0137-349 through service mode observations made with the uves echelle spectrograph (Dekker et al., 2000) mounted on UT2 (‘Kueyen’) of the Very Large Telescope (VLT) at the European Southern Observatory, Paranal, Chile (ESO program ID 079.C-0683). We used a 1.4 arcsec wide slit for these observations so the resolution of the spectra is set by the seeing. The ambient seeing during the exposures varied from 0.7 to 3.5 arcsec with a median value of 1.3 arcsec, corresponding to a resolution of 9.5. We used the CD4 cross-dispersing grating to observe the wavelength range 5655 – 9460Å on the red arm. We do not use the blue arm data in this analysis. The exposure time was 240 seconds per spectrum. Spectra were reduced using the uves pipeline version 4.3.0 provided by the observatory. The dispersion near the H line is 0.072Å-per-pixel and typical signal-to-noise per pixel is about 20.
We also re-analysed the 20 UVES spectra reduced automatically at the observatory described in Maxted et al. (2006) (ESO program ID 276.D-5014). These spectra have an exposure time of 290 seconds and were obtained with the CD2 cross-dispersing grating, but are otherwise similar to the spectra described above.
We used the program molly111deneb.astro.warwick.ac.uk/phsaap/software to measure the radial velocities of the stars by fitting multiple Gaussian profiles to the H line. We used three Gaussian profiles with the same mean but independent widths to model the white dwarf absorption line and a single Gaussian profile for the emission line from the brown dwarf. Free parameters in the fit were the coefficients of a low-order polynomial used to model the continuum level, the depths of the two widest Gaussian profiles, the height of the Gaussian profile used to model the emission line from the brown dwarf and the positions of the emission and absorption lines. Other parameters for the Gaussian profiles were fixed at values determined from an preliminary least-squares fit. The least-squares fit to a typical spectrum is shown in Fig. 1. The radial velocities for the white dwarf and the emission line from the brown dwarf derived from these least-squares fits are given in Table 1.
We fitted a sine function of the form to the measured radial velocities of the white dwarf to determine the orbital period, , and a reference time when the brown dwarf is at the furthest point in its orbit from the observer, . We added 1 km/s in quadrature to the standard errors given in Table 1 in order to achieve a reduced chi-squared value for the fit . The parameters of this fit are given in Table 2. Also given in this table is a fit to the radial velocities measured for the emission line from the brown dwarf with the values of and fixed to the values determined from the fit to the measured radial velocities of the white dwarf. We excluded measurements with large standard errors from this fit – these measurements come from spectra obtained at orbital phases where the emission line is very weak. To obtain for the least-squares fit to the emission line radial velocities we had to add 5.5 in quadrature to the standard errors given in Table 1. This much larger “systematic error” is mostly the result of the variations in the shape of the line profile during the orbit that are not accounted for by fitting the line with a Gaussian profile. The fit to both sets of radial velocities are shown in Fig. 2.
| HJD | HJD | |||||
|---|---|---|---|---|---|---|
| [km s-1] | [km s-1] | [km s-1] | [km s-1] | |||
| 3686.5258 | 4366.7203 | |||||
| 3686.5299 | 4366.7238 | |||||
| 3686.5339 | 4366.7273 | |||||
| 3686.5379 | 4366.7308 | |||||
| 3686.5420 | 4366.7343 | |||||
| 3686.5460 | 4378.7497 | |||||
| 3686.5500 | 4378.7532 | |||||
| 3686.5540 | 4378.7566 | |||||
| 3686.5580 | 4378.7600 | |||||
| 3686.5621 | 4378.7634 | |||||
| 3686.5661 | 4378.7668 | |||||
| 3686.5701 | 4378.7702 | |||||
| 3686.5741 | 4378.7736 | |||||
| 3686.5782 | 4378.7771 | |||||
| 3686.5822 | 4378.7805 | |||||
| 3686.5862 | 4387.6494 | |||||
| 3686.5903 | 4387.6528 | |||||
| 3686.5943 | 4387.6563 | |||||
| 3686.5983 | 4387.6597 | |||||
| 3686.6023 | 4387.6631 | |||||
| 4343.8265 | 4387.6665 | |||||
| 4343.8299 | 4387.6700 | |||||
| 4343.8333 | 4387.6734 | |||||
| 4343.8367 | 4387.6768 | |||||
| 4343.8401 | 4387.6802 | |||||
| 4343.8436 | 4400.5867 | |||||
| 4343.8470 | 4400.5901 | |||||
| 4343.8504 | 4400.5935 | |||||
| 4343.8538 | 4400.5969 | |||||
| 4343.8572 | 4400.6004 | |||||
| 4366.7030 | 4400.6038 | |||||
| 4366.7064 | 4400.6072 | |||||
| 4366.7099 | 4400.6106 | |||||
| 4366.7134 | 4400.6140 | |||||
| 4366.7168 | 4400.6174 |

| Parameter | White dwarf | Brown dwarf |
|---|---|---|
| (HJD) | 2454178.6762(1) | – |
| [days] | 0.07943002(3) | – |
| [] | 17.9(2) | 3(1) |
| [] | 27.7(3) |

2.2 The optical imaging and its reduction
The optical data was observed using the South African Astronomical Observatory (SAAO) 1.0m telescope and the SAAO CCD (STE3) instrument which has a CCD size of 512 512 pixels and a pixel scale of 0.31 arcsec/pixel. The observations are detailed in Table 3.
| Date | Filter | Number of points | Exposure time (s) | S/N |
|---|---|---|---|---|
| 2007-11-28 | 29 | 200 | 100 | |
| 2007-12-04 | 79 | 90 | 104 | |
| 2008-11-08 | 322 | 42 | 70 | |
| 2008-11-09 | 238 | 42 | 118 | |
| 2008-11-10 | 137 | 42 | 79 |
The data were reduced using the SAAO CCD pipeline which subtracted the bias and normalised the science frames with the master flat field frame. We used the starlink package autophotom to perform the photometry of the target and comparison stars. The aperture was fixed for the data and was set to be 2 times the mean seeing (full width, half maximum: Naylor 1998). This aperture size limited the impact of the background noise in the aperture. The sky background level was determined using the clipped mean of the pixel value in an annulus around the stars and the measurement errors were estimated from the sky variance. To remove atmospheric fluctuations, the light curve was divided by the light curve of one of the comparison stars.
2.3 The near-IR imaging and its reduction
Photometry was obtained using Son OF Isaac (SOFI: Moorwood et al. 1998) on the New Technology Telescope at La Silla on the nights of 2007-10-02 to 2007-10-04 and 2007-10-24 to 2007-10-26 . The seeing was typically 1.5”-2.0”, and the data were obtained in the , and bands. The exposure times were 2s in , 4s in and 8s in , in a 5 point jitter pattern which was then combined into mosaics to remove the sky background. The data were reduced using the starlink package orac_dr with the SOFI specific routines to perform the flat fielding, sky subtraction and mosaic combining. Object extraction was performed using aperture photometry routines within SExtractor and an aperture equivalent to the seeing.
To combine the data from each night each frame was calibrated using stars within the field from the 2 Micron All Sky Survey (Cutri et al., 2003). The and lightcurves are all from the same night. There are 130 points in the band lightcurve, and 14 in the and lightcurves.
2.4 The Spitzer imaging and its reduction
We have also obtained IRAC (Fazio et al., 2004) photometry from Cycle 7 (Programme ID:40325, PI: Burleigh) in all four bands ([3.6], [4.5], [5.8] and [8.0] microns). Each waveband was observed for one 116 minute orbit. The data were observed using 30s integrations, the full array and no dithering, as time series photometry was required.
For the [3.6] and [4.5] micron data no additional processing was required and aperture photometry was performed on each individual image using the apex software and an aperture of 3 pixels with a background aperture of 12-20 pixels. Pixel phase, array location dependence, and aperture corrections were applied to the data and the IRAC zero magnitude flux densities as found on the website were then used to convert the flux into magnitudes on the Vega magnitude scale. The photometric errors were estimated using the Poisson noise given by the apex software which was then combined with the errors on the zeropoints. The 3 per cent absolute calibration was added in quadrature to these photometric errors. The S/N of these data is typically 40.
For the [5.8] and [8.0] micron bands, the S/N was not high enough to perform aperture photometry on the individual images so the recommended mopex pipeline (v18.3.6 final) was used to perform overlap corrections and to create final and array correction mosaics of the images, combining 20 images at a time resulting in a total exposure time of 600s and S/N of 10-20. Aperture photometry was performed as for the [3.6] and [4.5] micron images. In total, we have 240 data points in the [3.6] and [4.5] micron bands, and 12 in the [5.8] and [8.0] micron bands.
3 Results
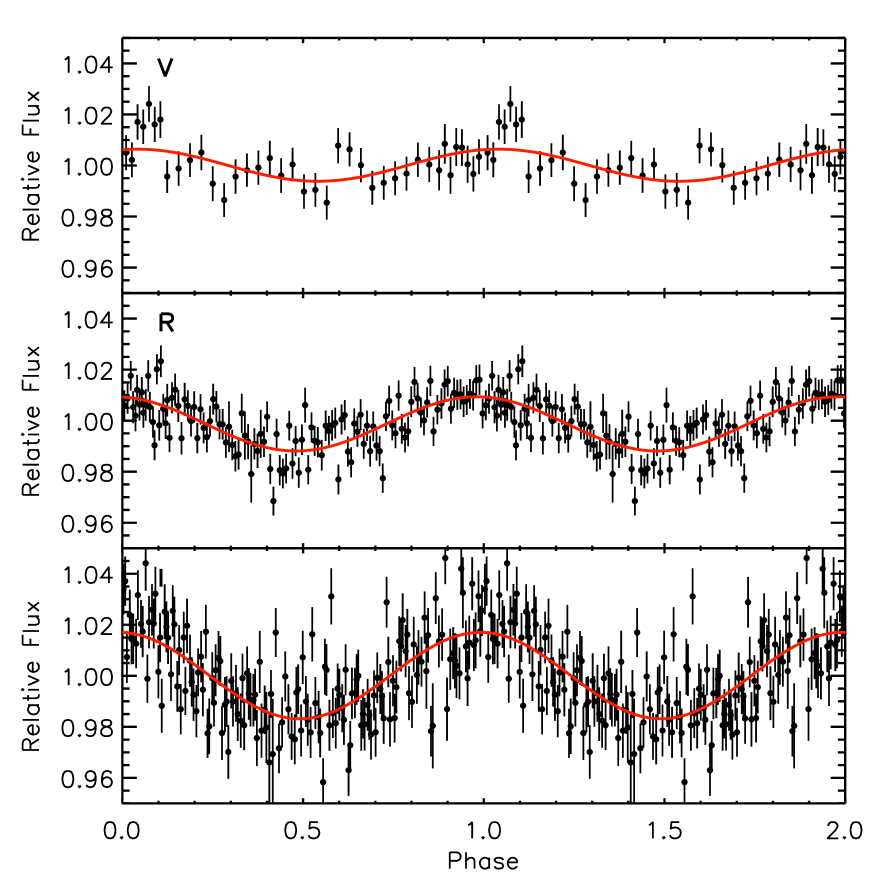
We converted all of the UTC Julian dates in the image headers to BJD and fitted the , and lightcurves to the ephemeris derived from the radial velocity measurements of the hydrogen absorption lines in the white dwarf. These are seen in Figure 3. We fitted each night of data separately. The variability was determined by fitting a sine curve to the data. The peak-to-peak amplitude was measured to be 1.220.3 per cent in , 3.390.23 per cent in and 2.110.15 per cent in (Figure 3). The light curve in the band from 10-11-2008 has a peak-to-peak amplitude of 3.310.33 per cent which is consistent with the data from 08-11-2008. The band light curve from 28-11-07 has a variability of 4.050.51 per cent which is slightly larger than the other two nights of band data, but is still just within the errors. This lightcurve only has very few points (29) which do not cover a whole orbit of the system and a longer exposure time which means the cadence of the data is not as good as for the other band data.
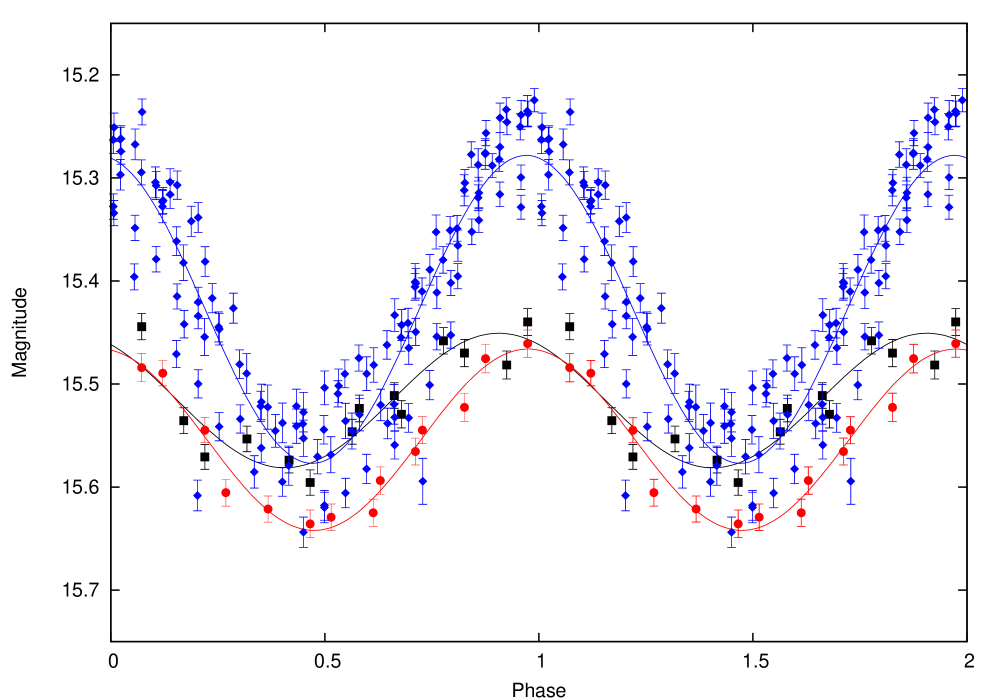
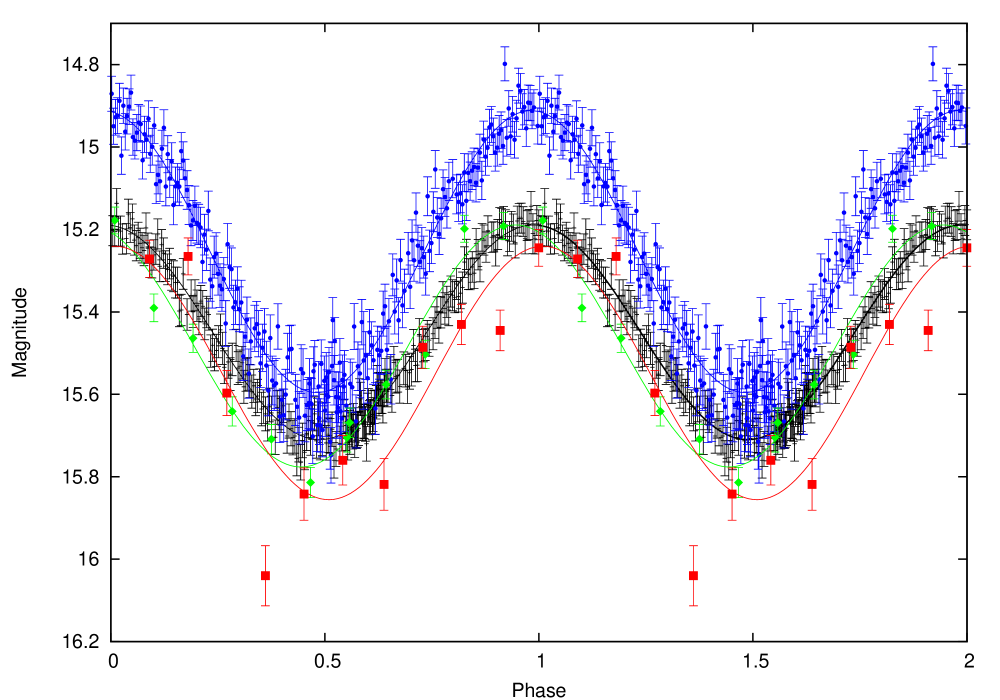
We fitted all of the near-infrared (Figure 4) and mid-infrared (Figure 5) data as above. All the photometry is in phase, and shows no statistically significant lag as is seen in Table 4. These data show that the irradiation is inducing a day/night contrast in the atmosphere of the brown dwarf. This is supported by the H detection.
| Filter | semi-amplitude | |
|---|---|---|
| 0.06 | 0.0640.020 | |
| 0.08 | 0.0160.009 | |
| 0.15 | 0.0040.008 | |
| [3.6] | 0.26 | 0.0030.002 |
| [4.5] | 0.34 | 0.0090.002 |
| [5.8] | 0.29 | 0.0460.010 |
| [8.0] | 0.31 | 0.0760.087 |
To determine the brown dwarf flux we generated a pure hydrogen white dwarf model using the plane-parallel, hydrostatic, non-local thermodynamic equilibrium atmosphere and spectral synthesis codes tlusty (Hubeny, 1988; Hubeny & Lanz, 1995) and synspec (Hubeny & Lanz, 2001) for an effective temperature of 16500 K and log g of 7.49 (Maxted et al., 2006). We then convolved this spectum with the filter profiles from 2MASS and IRAC, to get the total white dwarf flux per filter. These flux measurements, including a 12 per cent error to take into account the error in the effective temperature (500 K) and log g (0.08) as in Maxted et al. (2006), were then compared to the theoretical colour tables for white dwarfs (Holberg & Bergeron, 2006; Kowalski & Saumon, 2006; Tremblay et al., 2011) which have been extended into the bandpasses (P. Bergeron, private comm) and was also found to be consistent. The total white dwarf flux per filter was then subtracted from the observed flux (white dwarf + brown dwarf combined) at the maximum and minimum values. This flux value was then converted back into magnitudes (Table 5).
| Waveband | Magnitude (WD+BD) | Magnitude (WD) | Magnitude (BD) | Brightness Temperature (K) | |||
|---|---|---|---|---|---|---|---|
| Dayside | Nightside | Dayside | Nightside | Dayside | Nightside | ||
| 15.450.01 | 15.590.01 | 15.720.12 | 17.14 | 17.97 | 2418 | 2085 | |
| 15.470.01 | 15.650.01 | 15.520.12 | 18.330.80 | 18.33 | 1585329 | 1585 | |
| 15.280.01 | 15.570.01 | 15.770.12 | 16.370.29 | 17.49 | 2015 | 1537 | |
| [3.6] | 15.190.04 | 15.710.04 | 15.82 | 16.03 | 18.04 | 1668 | 958 |
| [4.5] | 14.910.04 | 15.600.06 | 15.850.12 | 15.50 | 17.31 | 1808 | 974 |
| [5.8] | 15.190.03 | 15.780.04 | 15.760.12 | 16.12 | 16.12 | 1254 | 1254 |
| [8.0] | 15.850.06 | 15.240.05 | 15.820.12 | 16.06 | 19.882.2 | 1102 | 364249 |
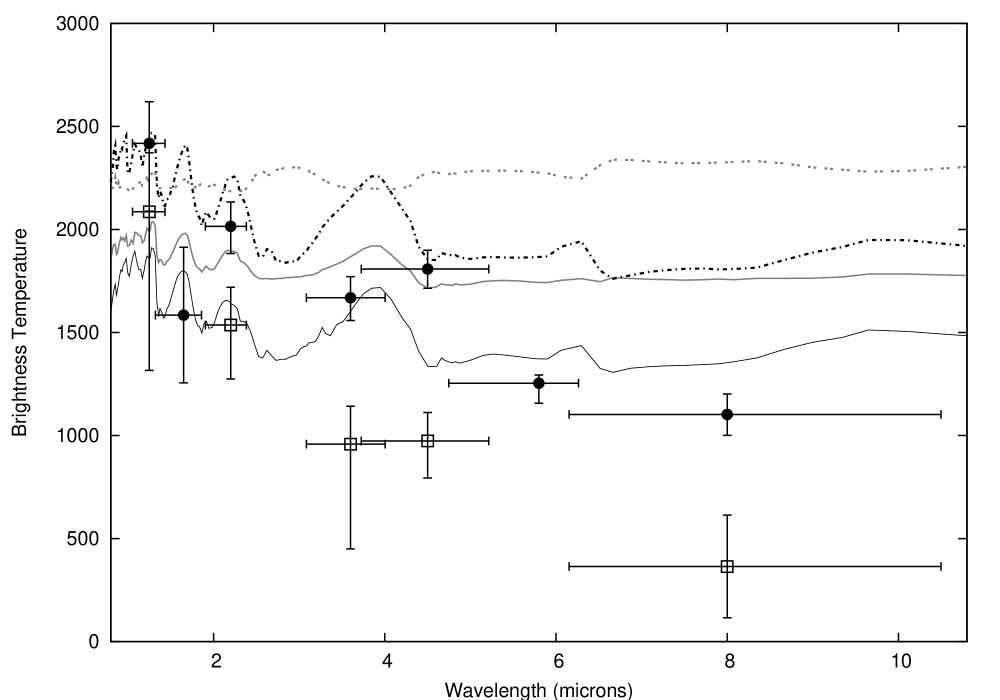
It is evident from this calculation that we do not detect any flux from the nightside side of the brown dwarf in the or [5.8] micron wavebands, and the values for the dayside of the brown dwarf have been used as upper limits. This is based on the assumption that the nightside cannot be brighter than the dayside. Using the magnitudes from Table 5 we calculated the brightness temperature at each wavelength from the band to [8.0] microns on the heated and unheated side of WD0137-349B and they can also be seen in Table 5 and Figure 7. These temperatures seem to imply that there is a weak dayside temperature inversion between the scale heights probed in the and [4.5] micron bands. This is not uncommon in hot Jupiter atmospheres and is normally attributed to the presence of TiO/VO opacity (Fortney et al., 2008; Hubeny et al., 2003).
In Burleigh et al. (2006) we estimated the equilibrium temperature of the irradiated side of WD0137-349B. The equilibrium temperature is the temperature of the heated side if the white dwarf and brown dwarf are perfect black bodies and is calculated to be 2000 K. This is too hot for an L6 dwarf, but this estimate is broadly consistent with our brightness temperature calculations. While Figure 2 of Casewell et al. (2013) shows that photometry of the heated face of the brown dwarf is consistent with a L6 dwarf, it is likely that there are other mechanisms occurring within the brown dwarf atmosphere, particularly considering that while one hemisphere is being irradiated, energy is being redistributed around the object as has been suggested for some exoplanets (e.g. Cooper & Showman 2005).
4 Modelling the data
The likely atmospheric circulation and irradiation of WD0137-349B make it unreasonable to compare the photometry of WD0137-349B with that of unirradiated brown dwarfs, as had been done in the past (Burleigh et al., 2006). Therefore we have used models that take into account the high level of UV irradiation in this system and use them to explore the heat transport and potential temperature inversion as well as the effects of some photochemistry.
4.1 The irradiated hemisphere
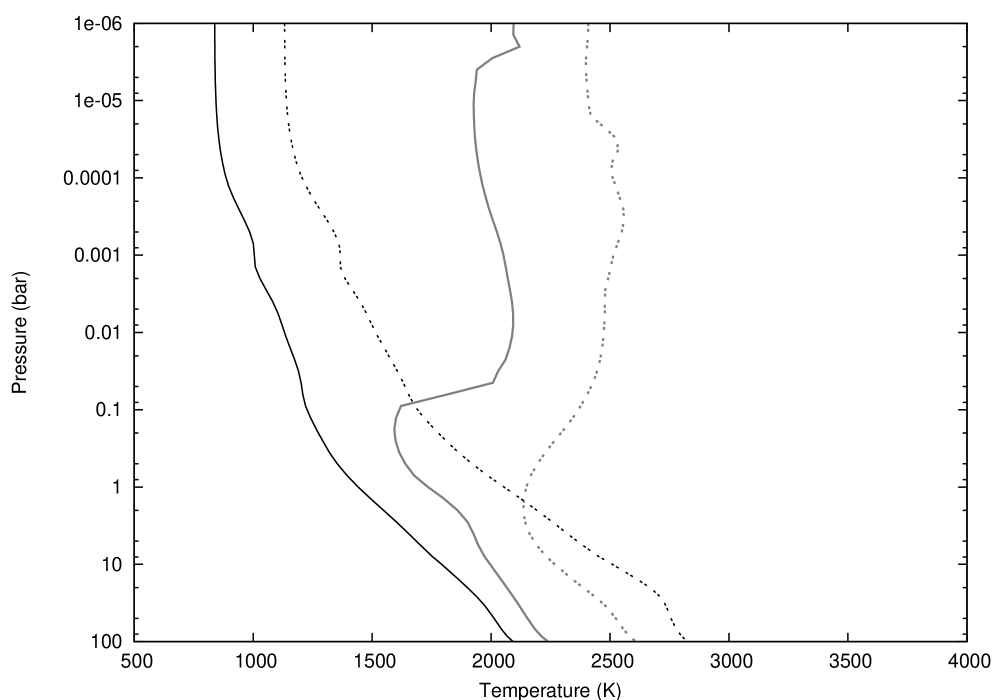
To explore the response of a brown dwarf atmosphere to the intense irradiation environment and to explore the possibility of a temperature inversion we computed a few exploratory models using the atmospheric structure model of Marley et al. (1999), Marley et al. (2002) and Fortney et al. (2005) with a log g=5.32 surface gravity, and intrinsic effective temperatures ranging from 600 to 1000 K. The choice of intrinsic effective temperature does not affect the results as in all models the incident flux dominates the energy budget and is far larger than the intrinsic flux. The white dwarf parent star has a T16,500 K, placing the peak of its Planck function well into the UV. The model atmosphere code we use for the brown dwarf, which was generally developed for Sun-like stars, lacks opacities at such short wavelengths. To model the incident flux we instead used a cooler 10,000 K blackbody with a larger white dwarf radius such that same total incident flux, but peaking at a longer wavelength, was maintained for the brown dwarf at 0.003 AU. The temperature-pressure profiles are shown in Figure 6. As is common for hot Jupiters (e.g., Fortney et al. 2006) we explored two cases for re-radiation of the absorbed flux on the irradiated atmosphere. In some models, the incident flux is cut by one-half, to simulate energy being efficiently lost to the un-modelled night side (full circulation models). In others, the full incident flux is used, to simulate no energy lost to the night side, which leads to a hotter day side model. Our aim was not to reproduce the observed photometry but rather to understand the type of response that would be expected in radiative-convective and thermochemical equilibrium. As is also customary for irradiated hot Jupiter models we considered cases in which the brown dwarf’s atmosphere both contained and lacked gaseous TiO. Since TiO absorbs strongly at optical wavelengths, it has been suggested as the absorber responsible for creating atmospheric thermal inversions in some hot Jupiters (Fortney et al., 2008; Hubeny et al., 2003). Model brightness temperature spectra for these cases are shown in Figure 7.
It is clear that the models with the full circulation, where energy is being lost to the night side, produce brightness temperatures closer to those observed. The data also show a larger dayside brightness temperature for band than for [4.5] m. Since the opacity is larger in the former bandpass than the latter, this implies a temperature profile that increases with altitude above a minimum. The difference is relatively small, 200 K, but is similar to that seen in exoplanets (e.g. Madhusudhan et al. 2011). Surprisingly, however, the overall flux levels are better matched by the models lacking in TiO, which raises a question as to which absorber would then be responsible for the inversion. Furthermore the condensation temperature of TiO is 1670 K, therefore in WD0137-349B, TiO (and the similar VO) should be present in the atmosphere.
Two explanations for this unexpected behaviour seem likely. First, it is possible that when WD0137-349B orbited the white dwarf progenitor that the TiO and VO condensed out of the upper atmosphere. The night side photometry indicates that it may have had an effective temperature of 1000 K, cool enough for condensation to occur. It is also possible that the temperature inversion is not real, and that the greater brightness temperature at Ks is in fact due to over luminosity caused by photochemistry which is not included in these models.
The band also appears anomalously high, but it can be seen from the spectra in Casewell et al. (2013); Burleigh et al. (2006) that the brown dwarf is contributing very little of the flux at these wavelengths, and what we are likely detecting is scattered light off the brown dwarf atmosphere. Despite the majority of the incident light from the white dwarf being emitted in the UV, it is unlikely that we will see some sort of photochemical haze as predicted by Zahnle et al. (2009) as these should dissipate at effective temperatures greater than 1000 K. Is is possible, however that we are seeing some form of airglow such as the H seen at Jupiter (Drossart et al., 1989), Saturn (Trafton et al., 1993) and Uranus (Geballe et al., 1993) which emits at wavelengths between 2 and 6 microns, and is strongest between 3 and 5 microns (Neale et al. 1996, calculated as part of the exomol project Tennyson & Yurchenko 2012) at the temperature and pressure of a mid-L dwarf. Another possibility for the over-luminosity is that we see H2 fluorescence as was recently detected in the UV active M dwarf exoplanet hosts (France et al., 2013). However, it has not been determined whether the fluorescence is due to the M dwarf activity, or the irradiation of the planet.
4.2 Photochemistry
We utilise the temperature-pressure profile for the dayside of the irradiated brown dwarf model without TiO, using full convection and energy transport (the solid black line in Figure 6). The ion-neutral chemistry of Rimmer et al. (2014) is applied on top of this temperature-pressure profile non-self-consistently, with the photochemistry from Yelle (2004, and references within). Rate coefficients for photolysis due to the the irradiating white dwarf are calculated by assuming that the white dwarf produces a UV field as a black body with K. The UV field is attenuated by H2 self-shielding, using shielding coefficients given by Lee et al. (1996). The number densities of H, H2 and H are shown on top of the pressure-temperature profile in Figure 8.
The molecular hydrogen in the upper atmosphere of a brown dwarf in the presence of a strong UV field produced by a nearby white dwarf may become excited by absorbing photons in the lines of the and bands. These molecules will rapidly transition into either the continuum ground-state, resulting in dissociation (Field et al., 1966), or will find themselves within the rovibrationally excited ground state. Molecular hydrogen in these excited states will be spontaneously de-excited into states progressively closer to the ground state. We determine the line intensity for IR fluorescence lines for rovibrationally excited H2 within its electronic ground state, using Sternberg & Dalgarno (1989):
| (1) |
where [Hz] is the transition frequency, [cm-2] is the column density of the excited species, [s-1] is the rate of the transition from and is the line-shape, which we assume to be susceptible to Doppler broadening only. The value of can be determined
as in Eq. 2 from Sternberg & Dalgarno (1989), using H2 formation via three-body reactions (Baulch et al., 1994). A unitless scaling parameter in this set of equations, , represents the strength of the UV field at nm, and is given in Draine units (Draine, 1978). The value of is parameterised by Sternberg & Dalgarno (1989) (their Eq. A7):
| (2) |
where is the temperature of the white dwarf in units of K, is the radius of the white dwarf in units of solar radii and is the distance between the white dwarf and brown dwarf in units of parsecs. For WD0137, K, and pc. This yields an enormous value of . A strong UV flux means that the rovibrational states of the molecular hydrogen will be highly populated, however if the field is very high, the dissociation rates will also be large, and most of the hydrogen will be atomic. Because of the self-shielding of molecular hydrogen, the UV pumping will nevertheless become efficient. When is large, H2 fluorescence will become significant deeper in the brown dwarf atmosphere. For , self-shielding does not become effective at protecting the molecular hydrogen until mbar for our model atmosphere. The number density of UV-pumped H2, [cm-3], is shown in Figure 8.
4.2.1 H emission
The molecular hydrogen can also be ionised by energetic particles and UV photons, forming H, which then reacts with molecular hydrogen to form H. In the presence of strong external radiation, the gas in the upper atmosphere of the brown dwarf will become weakly ionised, and we assume that free electrons will dominate the destruction of H. The H abundance is solved using the chemical kinetics network, albeit not self-consistently. Most importantly, the atmospheric dynamics from the model brown dwarf atmosphere are not coupled to the chemistry, and the effect of H radiative cooling is not coupled to the thermal balance of the model atmosphere. Within these limitations, the chemistry calculations predict that the majority of H is between bar (the low pressure limit of the model atmosphere), and bar, with a peak abundance of cm-3 (about 100 times the peak abundance observed on Jupiter; see Melin et al. 2005, their Fig. 1). When we calculate the line profile, we assume all the emitting energy levels are in local thermodynamic equilibrium (LTE), for simplicity; we take for our H cross-sections the Exomol database values (Neale et al., 1996; Hill et al., 2013). Eventually, non-LTE models should be used, but LTE models are commonly used to model H in Jupiter (Miller et al., 2000) and non-LTE models suggest that, at least for Jupiter, the assumption of LTE for emitting energy levels accurately reproduces the overall emission rate of H (Melin et al., 2005). This assumption is sufficient for our purposes here.
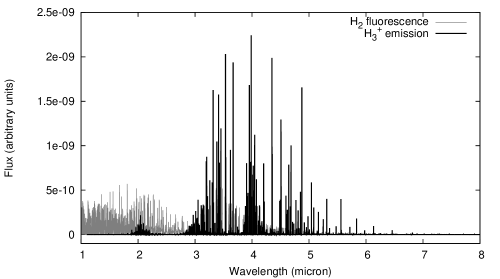
Both the modelled H and H2 emission spectra are shown in Figure 9.

.
5 Discussion
WD0137-349B clearly has a large temperature difference between the irradiated and non-irradiated hemispheres. This difference is largest in the [4.5] micron band at 834 K, and is 710 K at [3.6] microns and 478 K in , and the errors on these measurements are 89 K, 400 K, and 143 K, although as these errors are strongly correlated with the errors on the white dwarf Teff and log g, they may be an overestimate. The error on the [3.6] micron band is large, due to the uncertainty associated with the minimum nightside flux. In contrast, the exoplanet HD189733b has brightness temperatures of 1328 K in [3.6] and 1192 K in [4.5] microns, and a difference in day and night-side temperatures of 503 K at [3.6] microns, and 264 K at [4.5] microns (Knutson et al., 2012). Wasp-12b is one of the most highly irradiated exoplanets and is estimated to have a 3000 K dayside and 1100 K nightside (Sing et al., 2013). While the temperature differences are not as extreme as for Wasp-12b, WD0137-349B is hotter than HD189773b on the dayside and colder on the nightside.
Despite searches, there have been no detections of H in either exoplanets or brown dwarfs to date (e.g. Goto et al. 2005). However, France et al. (2013) have reported detections of H2 fluorescence in planets around M dwarfs. This H2 is detected in the Lyman line in the UV. However, despite detecting the emission in four of the six M dwarf planetary systems studied, they are unable to confirm whether the H2 has a chromospheric origin or is being emitted from the planet itself. It is evident that more detailed modelling is required, particularly in the UV wavelengths to predict whether H2 is detectable within Lyman in a white dwarf spectrum.
Lammer et al. (2003) argue that while is a common molecule that cools the thermosphere of planets such as Jupiter (Miller et al., 2000), it may not have the same effect in exoplanets as those orbiting within 0.1 AU of their host star will reach temperatures high enough to dissociate H2 ( 10 000 K), preventing its formation. This dissociation is also caused by the high UV irradiation at these close separations. Koskinen et al. (2007) claim that this is not entirely correct, as Lammer et al. (2003) neglected the cooling effect that H produces, arguing instead that the presence of can cool the atmospheres enough to generate more H. Yelle (2004) produced similar calculations and using 1D models determined that in some hot Jupiters the thermosphere can reach 10 000-15 000 K and still have cooling provided by H at lower altitudes in the thermosphere, even though the H2 is rapidly lost via thermal dissociation. Indeed, these models show that H cooling has a significant impact on the temperature profiles of close-in exoplanets in spite of the low density of H in the thermospheres of these exoplanets, compared to the H densities in Jupiter’s ionosphere.
Koskinen et al. (2007) get a slightly different result and also include radiative cooling and atmospheric circulation in their models. They note that dissociation occurs at a much lower 3000 K on a planet around a solar type star at 0.1 AU. While WD0137-349B has a separation of 0.003 AU, the brightness and equilibrium temperatures are much lower than 3000 K, because the white dwarf luminosity is lower than that of a solar-type star.
There are a handful of brown dwarfs known to be irradiated by stellar companions (e.g. Wasp-30B Anderson et al. 2011, Kelt-1b Beatty et al. 2014), however their equilibrium temperatures are in general too high to harbour H. For example, Kelt-1b (Beatty et al., 2014). It is estimated to have an brightness temperature of 3000 K at [3.6] and [4.5] microns on the dayside, with a tentative detection of a temperature inversion suggesting a nightside cold trap indicating temperatures of 2000K. It orbits within 0.1 AU making H formation unlikely. This is supported by the [3.6]-[4.5] colour, which they note is identical to that of an isolated brown dwarf of similar temperature.
While Burleigh et al. (2006) compared their nightside spectrum of WD0137-349B with a combined model of a white dwarf and an L8 dwarf in the near-IR, the band flux is much lower than this. This inconstancy seems to indicate that in the mid-IR, a significant departure from a canonical brown dwarf spectrum is seen. This change is possibly due to energy transport around the brown dwarf from the heated to the unheated hemisphere. The measurements of the heated side however, do not seem to indicate a temperature inversion due to TiO as is seen in some exoplanets, but instead suggests a possible brightening in the and [4.5] micron bands, possibly due to H and H2 fluorescence.
Phase resolved spectra of WD0137-349B in the band will allow some determination of how the spectrum alters with phase and whether species such as H and effects such as H2 fluorescence are occurring. L and M band spectroscopy from METIS on E-ELT or NIRSPEC from JWST could also be used confirm this effect. It is also clear that models of irradiated brown dwarfs and exoplanets need to be extended to include photochemistry and fluorescent effects.
6 Summary
We have observed the detached post-common envelope white dwarf+brown dwarf binary WD0137-349 in all four IRAC bands, obtaining an orbit at each wavelength as well as in the optical , and optical wavebands. Variability on the 116 minute orbit is seen at all wavelengths. The trend presented in Casewell et al. (2013) in which the aptitude of the peak-to-peak variability increases with wavelength is continued until 4.5 microns, after which the variability drops and remains constant. We calculate brightness temperatures and magnitudes for the brown dwarf alone and suggest that the tentative detection of a temperature inversion (based on brightness temperatures) is possibly not real and may be due to some other effect such as the UV irradiation of WD0137-349B creating photochemical effects in the atmosphere. These species are most luminous in the and [4.5] micron bands, thus potentially giving the appearance of a temperature inversion.
7 Acknowledgements
We thank Derek Homier for his useful comments at the refereeing stage. SLC acknowledges support from the College of Science and Engineering at the University of Leicester. PBR and ChH highlight financial support of the European Community under the FP7 by an ERC starting grant. SPL is supported by STFC grant ST/J001589/1. This work is based [in part] on observations made with the Spitzer Space Telescope, which is operated by the Jet Propulsion Laboratory, California Institute of Technology under a contract with NASA. Also based on observations made with ESO Telescopes at the La Silla Paranal Observatory under programme IDs 080.C-0587(A), 276.D-5014(A), 079.C-0683(B) and 080.C-0587(B). This research has made use of NASA’s Astrophysics Data System Bibliographic Services and the models hosted by Pierre Bergeron here: http://www.astro.umontreal.ca/bergeron/CoolingModels.
References
- Anderson et al. (2011) Anderson D. R., et al., 2011, ApJL , 726, L19
- Baulch et al. (1994) Baulch D., et al., 1994, Journal of Physical and Chemical Reference Data, 23, 847
- Beatty et al. (2014) Beatty T. G., et al., 2014, ApJ , 783, 112
- Beuermann et al. (2013) Beuermann K., et al., 2013, A&A , 558, A96
- Burleigh et al. (2011) Burleigh M. R., et al., 2011, in Schuh S., Drechsel H., Heber U., eds, American Institute of Physics Conference Series Vol. 1331 of American Institute of Physics Conference Series, Brown Dwarf Companions to White Dwarfs. pp 262–270
- Burleigh et al. (2006) Burleigh M. R., Hogan E., Dobbie P. D., Napiwotzki R., Maxted P. F. L., 2006, MNRAS , 373, L55
- Casewell et al. (2013) Casewell S. L., Burleigh M. R., Lawrie K. A., Maxted P. F. L., Dobbie P. D., Napiwotzki R., 2013, Mem. Societa Astronomica Italiana, 84, 1022
- Casewell et al. (2012) Casewell S. L., et al., 2012, ApJL , 759, L34
- Cooper & Showman (2005) Cooper C. S., Showman A. P., 2005, ApJL , 629, L45
- Cushing et al. (2005) Cushing M. C., Rayner J. T., Vacca W. D., 2005, ApJ , 623, 1115
- Cutri et al. (2003) Cutri R. M., et al., 2003, 2MASS All Sky Catalog of point sources.
- Dekker et al. (2000) Dekker H., D’Odorico S., Kaufer A., Delabre B., Kotzlowski H., 2000, in Iye M., Moorwood A. F., eds, Society of Photo-Optical Instrumentation Engineers (SPIE) Conference Series Vol. 4008 of Society of Photo-Optical Instrumentation Engineers (SPIE) Conference Series, Design, construction, and performance of UVES, the echelle spectrograph for the UT2 Kueyen Telescope at the ESO Paranal Observatory. pp 534–545
- Dobbie et al. (2005) Dobbie P. D., Burleigh M. R., Levan A. J., Barstow M. A., Napiwotzki R., Hubeny I., 2005, A&A , 439, 1159
- Draine (1978) Draine B. T., 1978, ApJS , 36, 595
- Drossart et al. (1989) Drossart P., et al., 1989, Nature , 340, 539
- Farihi & Christopher (2004) Farihi J., Christopher M., 2004, AJ , 128, 1868
- Fazio et al. (2004) Fazio G. G., et al., 2004, ApJS , 154, 10
- Field et al. (1966) Field G. B., Somerville W. B., Dressler K., 1966, ARA&A , 4, 207
- Fortney et al. (2006) Fortney J. J., Cooper C. S., Showman A. P., Marley M. S., Freedman R. S., 2006, ApJ , 652, 746
- Fortney et al. (2008) Fortney J. J., Lodders K., Marley M. S., Freedman R. S., 2008, ApJ , 678, 1419
- Fortney et al. (2005) Fortney J. J., Marley M. S., Lodders K., Saumon D., Freedman R., 2005, ApJL , 627, L69
- France et al. (2013) France K., et al., 2013, ApJ , 763, 149
- Geballe et al. (1993) Geballe T. R., Jagod M.-F., Oka T., 1993, ApJL , 408, L109
- Goto et al. (2005) Goto M., Geballe T. R., McCall B. J., Usuda T., Suto H., Terada H., Kobayashi N., Oka T., 2005, ApJ , 629, 865
- Hebb et al. (2009) Hebb L., et al., 2009, ApJ , 693, 1920
- Hill et al. (2013) Hill C., Yurchenko S. N., Tennyson J., 2013, IIcarus, 226, 1673
- Holberg & Bergeron (2006) Holberg J. B., Bergeron P., 2006, AJ , 132, 1221
- Hubeny (1988) Hubeny I., 1988, Computer Physics Communications, 52, 103
- Hubeny et al. (2003) Hubeny I., Burrows A., Sudarsky D., 2003, ApJ , 594, 1011
- Hubeny & Lanz (1995) Hubeny I., Lanz T., 1995, ApJ , 439, 875
- Hubeny & Lanz (2001) Hubeny I., Lanz T., , 2001, http://nova.astro.umd.edu/
- Knutson et al. (2012) Knutson H. A., et al., 2012, ApJ , 754, 22
- Koskinen et al. (2007) Koskinen T. T., Aylward A. D., Smith C. G. A., Miller S., 2007, ApJ , 661, 515
- Kowalski & Saumon (2006) Kowalski P. M., Saumon D., 2006, ApJL , 651, L137
- Lammer et al. (2003) Lammer H., Selsis F., Ribas I., Guinan E. F., Bauer S. J., Weiss W. W., 2003, ApJL , 598, L121
- Lee et al. (1996) Lee H.-H., Herbst E., Pineau des Forets G., Roueff E., Le Bourlot J., 1996, A&A , 311, 690
- Madhusudhan et al. (2011) Madhusudhan N., et al., 2011, Nature , 469, 64
- Marley et al. (1999) Marley M. S., Gelino C., Stephens D., Lunine J. I., Freedman R., 1999, ApJ , 513, 879
- Marley et al. (2002) Marley M. S., Seager S., Saumon D., Lodders K., Ackerman A. S., Freedman R. S., Fan X., 2002, ApJ , 568, 335
- Maxted et al. (2006) Maxted P. F. L., Napiwotzki R., Dobbie P. D., Burleigh M. R., 2006, Nature , 442, 543
- Melin et al. (2005) Melin H., Miller S., Stallard T., Grodent D., 2005, Icarus, 178, 97
- Miller et al. (2000) Miller S., et al., 2000, in Astronomy, physics and chemistry of H+3 Vol. 358 of Royal Society of London Philosophical Transactions Series A, The role of H+3 in planetary atmospheres. p. 2485
- Moorwood et al. (1998) Moorwood A., Cuby J.-G., Lidman C., 1998, The Messenger, 91, 9
- Naylor (1998) Naylor T., 1998, MNRAS , 296, 339
- Neale et al. (1996) Neale L., Miller S., Tennyson J., 1996, ApJ , 464, 516
- Rimmer et al. (2014) Rimmer P. B., Helling C., Bilger C., 2014, International Journal of Astrobiology, 13, 173
- Sing et al. (2013) Sing D. K., et al., 2013, MNRAS , 436, 2956
- Steele et al. (2013) Steele P. R., et al., 2013, MNRAS , 429, 3492
- Sternberg & Dalgarno (1989) Sternberg A., Dalgarno A., 1989, ApJ , 338, 197
- Tennyson & Yurchenko (2012) Tennyson J., Yurchenko S. N., 2012, MNRAS , 425, 21
- Trafton et al. (1993) Trafton L. M., Geballe T. R., Miller S., Tennyson J., Ballester G. E., 1993, ApJ , 405, 761
- Tremblay et al. (2011) Tremblay P.-E., Bergeron P., Gianninas A., 2011, ApJ , 730, 128
- Yelle (2004) Yelle R. V., 2004, Icarus, 170, 167
- Zahnle et al. (2009) Zahnle K., Marley M. S., Fortney J. J., 2009, ArXiv e-prints: ArXiv:0911.0728