Summary of the 2014 IACHEC Meeting
Abstract
We present the main results of the 9th meeting of the International Astronomical Consortium for High Energy Calibration (IACHEC), held in Warrenton (Virginia) in May 2014.
Over 50 scientists
directly involved in the calibration of operational and
future high-energy missions gathered during 3.5 days to discuss the status of the X-ray payloads inter-calibration, as well as possible ways to improve it.
Sect. 2 of this Report summarises our current understanding of the energy-dependent inter-calibration status.
The International Astronomical Consortium for High Energy Calibration (IACHEC)111http://web.mit.edu/iachec/ is a group dedicated to supporting the cross-calibration environment of high energy astrophysics missions with the ultimate goal of maximising their scientific return. Its members are drawn from instrument teams, international and national space agencies and other scientists with an interest in calibration in this area. Representatives of over a dozen current and future missions regularly contribute to the IACHEC activities. Support for the IACHEC in the form of travel costs for the participating members is generously provided by the relevant funding agencies. In addition, the 2014 IACHEC meeting was financially supported by the Chandra mission, the Swift mission, and NASA/Goddard Space Flight Center.
IACHEC members cooperate within working groups to define calibration standards and procedures. The scope of these groups is primarily a practical one: a set of data and results (eventually published in refereed journals) will be the outcome of a coordinated and standardised analysis of reference sources (“high-energy standard candles”). Past, present and future high-energy missions can use these results as a calibration reference.
The IACHEC meets yearly to report on the progress of the working groups and define the next year’s activities. The inaugural IACHEC meeting was held in 2006 on neutral ground in Iceland, but since then has been hosted by local IACHEC members in Europe, the United States or Asia. In 2014 the 9th IACHEC meeting was hosted by the Swift XRT team at Penn State and was held at the Airlie Centre in Warrenton, Virginia. It was attended by 51 scientists from the US, UK, Germany, the Netherlands, Italy, Finland, Denmark, China, India, and Japan, as well as by officials from NASA and ESA.
The format of the IACHEC meetings includes both plenary sessions where instrument calibration status, working group summaries and other topics of interest are presented and parallel splinter sessions where working groups meet to discuss results and use the opportunity for face-to-face data analysis sessions.
This Report summarises the main results of the 9th meeting. It is organised as follows: Sect. 1 describes the main results discussed by each of the Working Groups. Sect. 2 summarises the cross-calibration status. For more details, readers are referred to the presentations collected at the IACHEC meeting web page222http://web.mit.edu/iachec/meetings/2014/index.html.
1 Working Group reports
1.1 CCD
The CCD Working Group met in conjunction with the Backgrounds Working Group due to substantial overlap in interested participants. As always, the CCD Working Group provided a forum for cross-mission discussion and comparison of CCD-specific modelling and calibration issues. For future meetings we are considering broadening the scope to include related devices such as Active Pixel Sensors and CdZTe detectors which share at least some of the physical principles and event processing schemes with CCD-based detectors. At IACHEC 2014, we heard from Chandra/ACIS, XMM-Newton/EPIC, and ATHENA.
We started the session with three presentations on non-X-ray backgrounds. Terry Gaetz described efforts to characterise the spatial structure of the particle background on Chandra/ACIS. Both front- and back-illuminated devices have energy-dependent spatial features, at least some of which are likely due to charge transfer inefficiency. Applying the very faint (VF) mode filter, found in acis_process_events, reduces both the total background and the non-uniformity. More details on this work can be found on the Chandra web site333http://cxc.harvard.edu/cal/Acis/Cal_prods/bkgrnd/nonuniformity/acisbg.html.
K. D. Kuntz described his research comparing soft proton flares on XMM-Newton and Chandra. XMM-Newton/EPIC-pn sees substantially more soft proton flaring than Chandra/ACIS-S3, and the flares seen by XMM-Newton are stronger than those seen by Chandra. Part of the reason is that Chandra does not observe as much in the region just inside the magnetosheath which has the highest incidence of flares. It is not obvious, though, why the response of Chandra is lower than XMM-Newton to soft protons.
Lorenzo Natalucci presented work by Simone Lotti of GEANT4 simulations of the particle background for an X-ray micro-calorimeter at L2 like the proposed X-IFU on ATHENA. The simulations were validated by comparison to Suzaku XRS data. A number of background reduction techniques were evaluated, such as an anti-coincidence detector and changes to the design geometry and shielding. A related paper will appear in SPIE proceedings shortly (Lotti, et al. 2014).
The second half of the session was devoted to particular calibration and modelling efforts for Chandra and XMM-Newton. Nick Durham summarised work evaluating the temperature-dependent CTI correction in the Chandra data processing pipeline which has become increasingly important as the spacecraft ages and temperature deviations become more common. Terry Gaetz discussed his work on improving the low-energy gain calibration for Chandra/ACIS-S1.
Steve Sembay described the evolution of deep traps in the XMM-Newton/EPIC-MOS CCDs. These types of traps have also been detected on Swift XRT, which uses the same CCDs as MOS run at warmer temperatures, but some of the trap characteristics appear to be different. The rate of generation of these traps varies between MOS1 and MOS2. There was interest from the attendees in applying the same kind of search to Suzaku/XIS or Chandra ACIS, where these types of traps have not yet been reported.
Finally, Norbert Schulz reported on his study of bright X-ray sources observed with the Chandra HETG, and the spectral differences found between the standard timed-event mode and continuous clocking (CC) mode. He has found that problems in bright HETG spectra are not due to problems with the calibration of CC-mode, but the effects of dispersed secondary images, such as the X-ray halo, which in CC-mode cannot be spatially filtered. These data require intensive additional modelling and data reduction depending on the chosen configuration. His description of the problem and recommendations for planning future observations are found on the Chandra web pages444http://cxc.harvard.edu/cal/Acis/Cal_prods/ccmode/ccmode_final_doc03.pdf.
1.2 Contamination
Despite the best efforts in instrument design and construction, several recent missions have suffered molecular contamination after launch (Marshall et al., 2004, Koyama et al. 2007, O’Dell et al. 2013). The introduction of unknown absorbing material into the light path of an X-ray instrument not only reduces the effective area at soft energies ( 1 keV), but it greatly complicates the calibration since the amount, composition, and spatial distribution of this contaminant must be determined on orbit. During previous IACHEC workshops, molecular contamination arose as a serious calibration issue in several standard candle working groups (e.g., Plucinsky et al., 2012, Kettula et al. 2013), and so at the 2013 meeting a new contamination working group was established to address three broad topics:
-
1.
comparison of contamination among instruments and missions, including chemical composition, time dependence, spatial dependence, temperature dependence, and environmental dependence;
-
2.
mitigation for current instruments, including celestial monitoring targets, effects on calibration and science results, and “bake-out” procedures; and
-
3.
mitigation for future instruments, including design, procurement, ground procedures, testing and calibration, and on-orbit monitoring.
With these topics in mind, the contamination working group held its inaugural meeting at the 2014 IACHEC workshop, gathering 12 of 19 members for two sessions. Representatives from operating missions presented the history and current status of contamination in their soft X-ray CCD instruments. Herman Marshall presented details about Chandra ACIS, using the LETG gratings to probe absorption edges with more accuracy than CCD resolution allows. The accumulation rate of the ACIS contaminant had decreased from 2000 to 2009 but has increased from 2009 until the present. The chemical composition of the contaminant has varied during the mission, possibly indicating that there is more than one source of the contaminant. Doug Swartz presented models of the spatial migration of ACIS contaminant, comparing low- and high-volatility components to explain the spatial distribution observed. Steven Sembay presented XMM-Newton, which shows varying contamination among the instruments from the apparently uncontaminated EPIC-pn, through EPIC-MOS1, EPIC-MOS2 and the RGS which show increasing (although still modest) levels respectively. Eric Miller showed similar variation among the four Suzaku/XIS detectors, which became contaminated very rapidly at the beginning of the mission but appear to be recovering, with low-energy effective area increasing at recent times. Andy Beardmore showed that the Swift XRT has little evidence for contamination, although line ratios from recent observations of SNR 1E 0102.27219 are consistent with a contamination absorption profile. The differences between these instruments, even among nearly identical instruments on the same spacecraft, will be investigated as the working group moves forward.
Two upcoming missions were represented as well. Maurice Leutenegger presented plans for contamination mitigation on the Astro-H SXS, which has a multi-stage thermal and optical blocking filter system with integrated heaters to reduce the probability of contamination in the light path of the very cold micro-calorimeter. Vadim Burwitz presented the design of the eROSITA CCD instrument, with filters and cold traps to reduce contamination, and summarised the mitigation strategies to reduce build-up on the ground.
The large attendance at these sessions gave testimony to the concerns about contamination in current and future mission. Going forward, the three topics above will continue to be addressed, culminating in publication of a legacy white paper to detail shared lessons learned for instrument design, ground mitigation, first light targets, and monitoring strategies.
1.3 Galaxy Clusters
Since clusters of galaxies are stable on human time-scales, they are useful for building up large cross-calibration data bases of different X-ray missions using non-simultaneous observations. This is the main rationale of the activities of the Galaxy Cluster Working Group.
At the 9th IACHEC meeting, we discussed an extension of our previous work on the XMM-Newton/EPIC and Chandra/ACIS effective area cross-calibration (Nevalainen et al. 2010) by using a much larger sample (HIFLUGCS), and a new tool, the stack residuals method. In a nutshell, this method consists of calculating an energy-dependent ratio between fluxes measured by pairs of instruments, by dividing the model calculated on the spectrum of one against the spectrum (data) of the other. If the method is applied to an homogeneous class of sources, the ratios are stacked together to increase the reliability of results, minimising the impact of the scatter of individual data sets from the mean. Readers are referred to Kettula et al (2013), and Read et al. (2014) for a description of the algorithm, and of its limitations.
The results of applying the stack residuals method on the HIFLUGCS sample are shown in Fig. 1 (Schellenberger et al. 2014).
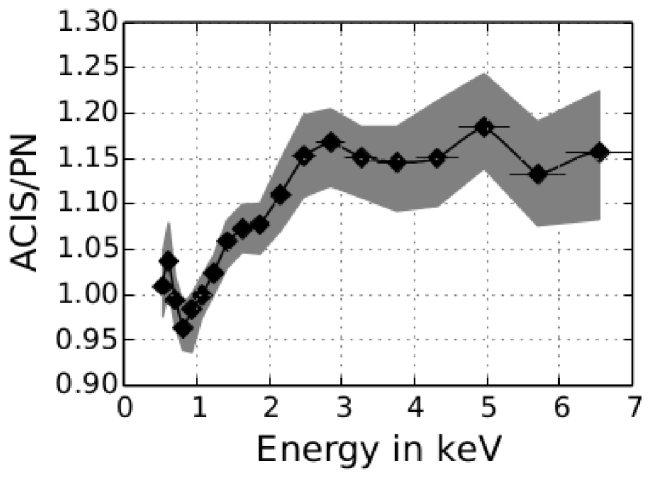
We confirmed the previously published (Nevalainen et al., 2010) good agreement of the effective area shape calibration above 2 keV. At lower energies the previously reported problems remain. The relative uncertainties in the calibration of the effective area yield that ACIS measures systematically lower temperatures in the 0.5–7 keV energy band with respect to the EPIC cameras. The better statistics of the HIFLUGCS sample allows a deeper study than in the original Nevalainen et al. (2010) paper, and thus to derive the temperature dependence of the ACIS/EPIC temperature differences. Schellenberger et al. (2014) discuss the modification to the effective area calibration that would be required to align the ACIS and EPIC spectral results555A tool implementing this correction is provided at https://wikis.mit.edu/confluence/display/iachec/Data3. A similar approach is discussed by Guainazzi et al. (2014), and implemented in SASv14..
Another activity discussed at the WG meeting is the ”Multi Mission Study” aiming at comparing X-ray spectroscopic results in the 0.5–10 keV band from 6 on-going and past X-ray missions (XMM-Newton, Chandra, Swift, Suzaku, NuSTAR and ROSAT) and 12 instruments. Preliminary results for a sample of four clusters (A1795, A2029, Coma and PKS0745-19) indicate that, when compared to EPIC-pn, all other instruments yield higher flux above 2 keV; and that all missions other than XMM-Newton yield lower flux below 2 keV (see Fig. 2). The data are not consistent with the hypothesis whereby a single instrument has a significant bias in the calibration of the effective area while all the others are very accurately calibrated. The flux differences between different instruments vary up to 10%,
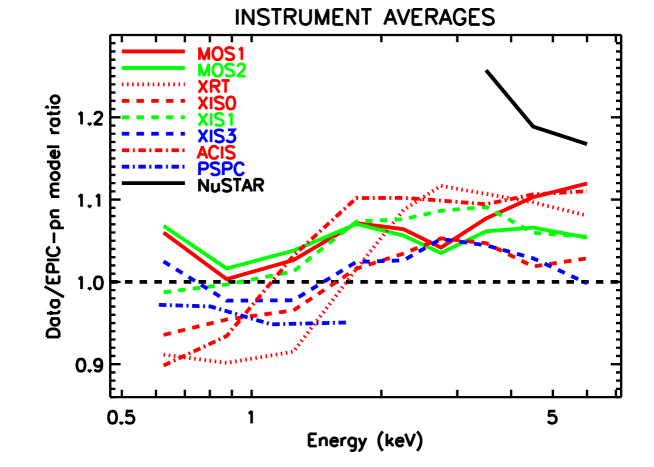
except in the case of NuSTAR, which yields 20% higher flux than EPIC-pn in the overlapping 4–7 keV band. The higher NuSTAR cross-normalisation, based on a single observation at the center of Coma, has to do with aperture stop and single bounce reflection corrections that are not implemented in the extended ARF mode of the current version of the NuSTAR analysis software. We expect the cross-normalisation to be dependent on the extraction region size and azimuthal location on the detector with respect the optical axis, with smaller areas close to the optical axis having better responses. These corrections are, however, fully taken into account for point sources, and the cross-normalisation factors for point sources are typically only on the order of a few percent. The extended ARF cross-normalisation numbers should therefore not be taken as a measure of the actual NuSTAR effective area and vignetting functions for point sources, which apply to the vast majority of observations.
An alternative avenue for addressing the accuracy of effective area calibration is based on cluster physics. We studied the results for cluster total masses derived via the hydrostatic X-ray method and gravitational lensing published by other teams. While the X-ray masses derived with Chandra/ACIS are consistent with the masses derived via gravitational lensing (Israel et al., 2014), the XMM-Newton/EPIC X-ray masses for another cluster sample are 30% lower than the gravitational lensing masses (von den Linden et al., 2014). In principle, such a comparison could be used as an absolute calibrator of the effective area, overcoming the shortcomings inherent in the lack of X-ray ”standard candles” (Sembay et al., 2010). However, hydrostatic biases could lead to an overestimate in measurements of the cluster masses based on X-ray spectroscopy (Liu et al. 2009). For this reason, the still existing astrophysical uncertainties prevents galaxy clusters from being used as absolute flux calibrators.
1.4 Heritage
A principal part of the scope of the IACHEC is the transmission of expertise, good practice, and calibration-related methods from operational missions to missions under development. While the path to instrument calibration, as any other scientific undertaking, cannot be entirely foreseen, there are significant gains for future missions in being able to avoid any errors and inefficiencies made in the past. These gains can be critical for missions on tight budgets, or with shorter (predicted) operational lives. Calibration plans are inevitably success-oriented due to the limited time devoted to calibration, and time pressure during the development phase may lead to losing the overall vision of long-term sustainable mission operations. These shortcomings can be dearly paid for in the later phases of mission operations. It is therefore crucially important to avoid following knowingly wrong paths.
In order to systematise the IACHEC legacy, a new ”IACHEC Heritage Working Group” was founded at the 9th IACHEC meeting with the following scopes:
-
•
provide a platform for the discussion of experiences coming from operational missions
-
•
facilitate the usage of good practices for the management of pre- and post-flight calibration data and procedures, and the maintenance and propagation of systematic uncertainties (the latter task in strict collaboration with the ”Systematic uncertainties” IACHEC Working Group)
-
•
document the best practices in analysing high-energy astronomical data as a reference for the whole scientific community
-
•
ensure the usage of homogeneous data analysis procedures across the IACHEC calibration and cross-calibration activities
-
•
consolidate and disseminate the experience of operational missions on the optimal calibration sources for each specific calibration goal
The first tasks of this Working Group will be: a) to submit a synoptic paper on in-flight calibration plans, that could inform the definition of the calibration program for forthcoming X-ray missions; b) organise a workshop on photoelectric absorption models and associated abundances and cross-section conventions with external experts.
1.5 Thermal SNRs
The Thermal SNR Working Group met with the following attendees contributing in person: Steve Sembay (XMM-Newton/EPIC-MOS), Andy Beardmore (Swift/XRT), Paul Plucinsky (Chandra/ACIS), Matteo Guainazzi and Martin Stuhlinger (XMM-Newton/EPIC), and Eric Miller (Suzaku/XIS), and the following contributing remotely: Frank Haberl (XMM-Newton/EPIC-pn) and Adam Foster (APEC). The group has used the standard IACHEC model for the Small Magellanic Cloud supernova remnant (SNR) 1E 0102.2-7219 (hereafter E0102) to understand time-dependent changes in their respective instrument responses (Plucinsky et al. 2008, 2012). The E0102 model has been used to identify issues with the ACIS contamination model and to verify revised contamination models. The Chandra X-ray Center released a new ACIS contamination model on 9 July 2014 in CALDB release version 4.6.2, which was verified against E0102 observations from 2003 to 2014. The E0102 model was also used to test the low-energy response files for the MOS instruments. Partially based on the E0102 results, the MOS team released a contamination correction for the MOS instruments in SAS 13.5 released on 9 December 2013. The Swift/XRT team has used E0102 to update the response matrices for both windowed timing (WT) mode and photon counting (PC) mode data, resulting in significant improvements at low energy over the course of the mission. The EPIC-pn instrument appears to be the most stable instrument, based on the consistency of the observed E0102 count rates over the course of the XMM-Newton mission. Although there are differences at the few percent level between E0102 observations acquired at different positions on the EPIC-pn that are under investigation. The XIS team on Suzaku has continued to use E0102 to verify the XIS contamination model and make revisions as necessary, with an updated CALDB file released on 16 September 2013. The bright emission lines of E0102 are also used to measure and verify the XIS gain and charge-transfer inefficiency (CTI) parameters at low energies.
Every year at the IACHEC, the various instrument teams present the line normalisations for the four major line complexes in the E0102 spectrum, specifically the OVII triplet ( eV), the OVIII Ly line ( eV), the NeIX triplet ( eV), and the NeX Ly) ( eV). These normalisation are derived from representative observations in the best-calibrated instrument modes and are based on the latest calibrations for the instrument. The objective of this exercise is to estimate the current agreement in the absolute effective area of the instruments at these energies which are particularly challenging to calibrate. Fig. 3 plots the values of
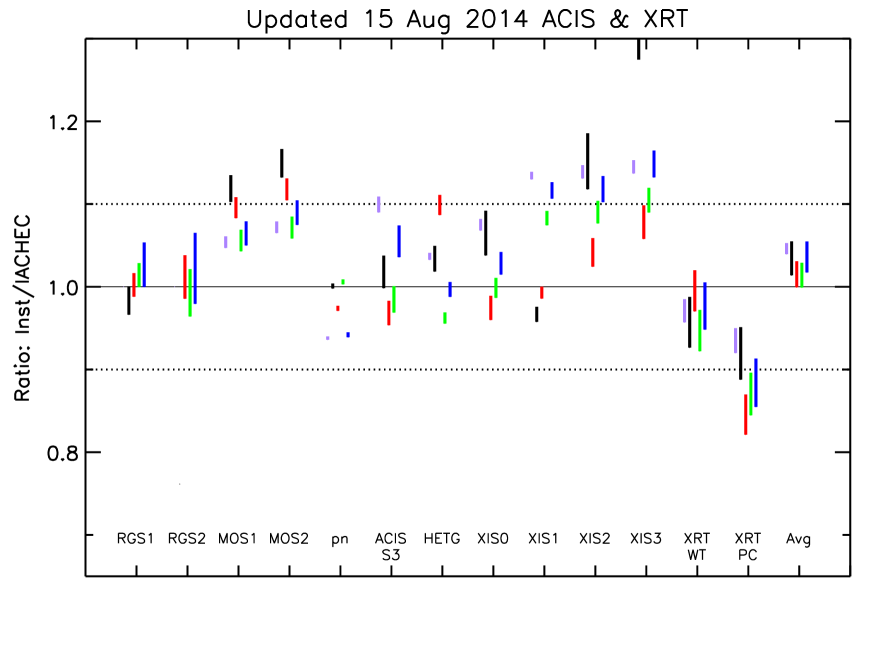
these normalisations with respect to the values in the standard IACHEC model. We do not claim that the values in the IACHEC model are correct, we simply are using them as a convenient reference to compare against. 41 of the 52 normalisations agree to within , indicating the general level of agreement. The RGS values agree well with the standard values since the RGS data were relied upon to develop the standard model. The MOS1 and MOS2 data appear to be about 10% high. The EPIC-pn values range from 0–5% below the standard model. The ACIS normalisations range from to compared to the standard model, with no clear energy dependence. The XISs exhibit different agreement for the different detectors. The XIS0 and XIS1 agree to within 10% but the XIS2 and XIS3 appear to be high by . The XRT WT mode data agree to better than 10% but the XRT PC mode data appear to be low by about 10%. The MOS and EPIC-pn normalisations disagree by about 10% for E0102, whereas they agree to within 5% for point sources on-axis (Read, Guainazzi, & Sembay 2014). This apparent discrepancy is under investigation.
The group also continued work on the development of a standard model for the Large Magellanic Cloud (LMC) SNR N132D, the brightest SNR in the LMC. The standard model was developed based on the EPIC-pn and RGS data. The other instrument teams compared this standard model to their data and suggested additions of some weaker lines. After these changes have been made, the goal will be to use the N132D standard model to compare the absolute effective areas in the band pass from 1.5 to 3.5 keV. Pileup is unfortunately an issue since N132D has such a high surface brightness. Only the EPIC-pn data in small window mode can be used for this analysis since data in other modes with longer readout times have significant pileup. The ACIS data in full-frame mode cannot be used for this analysis since pileup is significant. We are exploring the use of the 0th order data from an ACIS/HETG observation of N132D to use for this analysis. The existing XIS data should not suffer pile-up and should be suitable for this analysis.
2 Summary of the cross-calibration status
Fig. 4 represents a synopsis of cross-calibration measurements in the 0.1–10 keV energy band
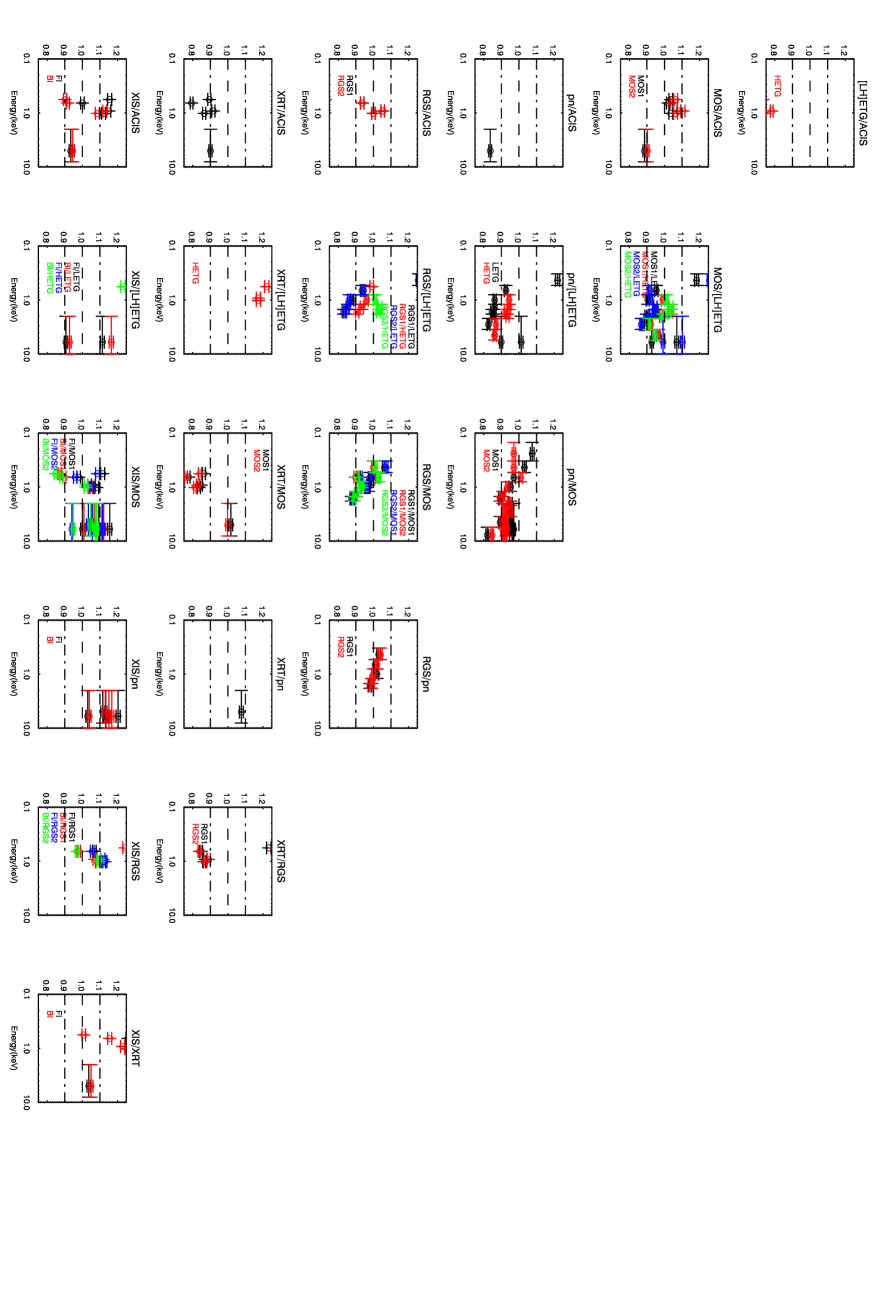
recently published by the IACHEC (Tsujimoto et al., 2011, Ishida et al. 2011, Plucinsky et al. 2012; Smith & Marshall in preparation). It must be stressed that these results were published at different times, and therefore do not correspond to a homogeneous set of calibrations. Readers are warmly encouraged to refer to the aforementioned papers for a discussion of the calibration sets used to reduce and analyse the data.
Fluxes measured by different instruments typically differ within a dynamical range of 15%. In some cases where multiple measurements in the same energy bands are available a large scatter is observed (see, e.g., the MOS/LETG, and the ratios involving the XIS). This indicates that time-dependent calibration effects may still significantly affect the cross-calibration status.
For a discussion of the cross-calibration status above 10 keV, interested readers are referred to the seminal paper by Tsujimoto et al. (2011).
References666see http://web.mit.edu/iachec/papers/index.html for a complete list of IACHEC papers
Guainazzi M., et al., 2014, XMM-CAL-SRN-0321777http://xmm2.esac.esa.int/docs/documents/CAL-SRN-0321-1-2.pdf
Kettula L., et al., 2013, A&A, 552, A47
Koyama K., et al., 2007, PASJ, 59, 23
Ishida M., et al., 2011, PASJ, 63, 657
Israel et al., 2014, A&A, 564, 129
Lau et al., 2009, ApJ, 705, 1129
Lotti et al., 2014, Proc. SPIE, 9144
Marshall H., et al., 2004, SPIE, 5165, 497
Nevalainen J., et al., 2010, A&A, 523, 22
O’Dell S. L., et al., 2013, SPIE, 8859
Plucinsky P., et al., 2008, SPIE, 7011, 68
Plucinsky P., et al., 2012, SPIE, 8443, 12
Read A., et al., 2014, A&A,
Schellenberger et al., 2014, A&A
Sembay S., et al., 2010, AIPC, 1248, 593
Tsujimoto M., et al., 2011, A&A, 525, 25
von den Linden et al., 2014, A&A, submitted, (arXiv:1402.2670)