The star-formation history of the Universe with the SKA
Abstract:
Radio wavelengths offer the unique possibility of tracing the total star-formation rate in galaxies, both obscured and unobscured. As such, they may provide the most robust measurement of the star-formation history of the Universe. In this chapter we highlight the constraints that the SKA can place on the evolution of the star-formation history of the Universe, the survey area required to overcome sample variance, the spatial resolution requirements, along with the multi-wavelength ancillary data that will play a major role in maximising the scientific promise of the SKA. The required combination of depth and resolution means that a survey to trace the star formation in the Universe should be carried out with a facility that has a resolution of at least arcsec, with high sensitivity at GHz. We also suggest a strategy that will enable new parameter space to be explored as the SKA expands over the coming decade.
1 Introduction
Gaining a full understanding of the formation and evolution of galaxies relies on our ability to trace the build-up of stellar mass over the history of the Universe. Therefore we are required to obtain observations that allow us to measure both ongoing star-formation activity and the stellar populations that are already in place. The older stars, which contain the bulk of the stellar mass, emit the majority of their radiation towards the near-infrared part of the electromagnetic spectrum. Ongoing surveys with the Visible-Infrared Survey Telescope for Astronomy (VISTA), the Spitzer Space Telescope and the Hubble Space Telescope (HST) are adept at tracing such emission to very high redshifts. However, tracing the current star-formation activity in distant galaxies is a much more difficult problem. This is because the hot young stars are very blue and consequently are much more susceptible to obscuration by dust, making ultra-violet and optical surveys incomplete (for a review see Madau & Dickinson 2014). Indeed, from measurements of the integrated optical and infrared background radiation we know that around 50 per cent of the light from stellar processes is obscured by dust (e.g. Takeuchi et al. 2005; Dole et al. 2006).
This property has motivated a long line of telescopes with the aim of detecting the reprocessed dust emission from these young stars at far-infrared wavelengths. The most recent of these, the Herschel Space Observatory, has provided a wealth of new information on the total star-formation rate (SFR) density in the Universe and how this evolves (e.g. Vaccari et al. 2010; Dye et al. 2010; Lapi et al. 2011; Burgarella et al. 2013; Gruppioni et al. 2013; Magnelli et al. 2013). However, even Herschel does not have the ability to track the star formation in galaxies to faint levels at high redshift, and the differences in dust temperature may also lead to systematic biases (e.g. Smith et al. 2014). The relatively poor spatial resolution means that imaging surveys with Herschel are confusion-noise dominated, rather than instrumental or sky-background dominated. Other types of survey such as those targeting galaxies with emission-lines excited by the young stars have also been successful, but are generally limited to either expensive follow-up spectroscopy of known galaxies (e.g. Erb et al. 2003; Gilbank et al. 2010), or narrow-band imaging campaigns that are limited in the volume that they can survey, due to the width of the specific filter (e.g. Sobral et al. 2012; Drake et al. 2013). Both of these methods are also affected by dust obscuration, and multiple lines of the same atomic species are required to obtain an estimate of the dust extinction, and thus obtain an accurate star-formation rate (SFR). Therefore, we are currently unable to obtain a clear view of the total star formation occurring over cosmic time, what galaxies this occurs in and when, and also in what environments such activity is stimulated or truncated.
As we move towards the next generation of deep radio continuum surveys, the dominant radio source population will no longer be active galactic nuclei (AGN), but star-forming galaxies (e.g. Cram et al. 1998; Haarsma et al. 2000; Afonso et al. 2005; Seymour et al. 2008; Padovani et al. 2009; McAlpine et al. 2013), although radio-quiet AGN may still make a significant contribution (e.g. Jarvis & Rawlings 2004; Simpson et al. 2006; Smolčić et al. 2009b; Bonzini et al. 2013; White et al. 2014). The radio emission from these star-forming galaxies is predominantly in the form of synchrotron emission from relativistic electrons accelerated in supernova remnants, and free-free emission from Hii regions (for a review see Condon 1992). Both of these emission processes are linked to stars of masses 8 M⊙ that end in core-collapse supernovae, and dominate the ionisation of Hii regions. Thus, it is not surprising that radio continuum emission, where dust obscuration is no longer an issue, has been used to infer the SFRs of galaxies. However, current observations at high redshift are limited to stacking experiments, where only average properties of galaxies selected at other wavelengths are determined (e.g. Karim et al. 2011; Zwart et al. 2014). This constraint will be overcome with the vast sensitivity of the SKA.
Therefore, as we move into the SKA era, using the radio continuum emission to trace the star-formation history of the Universe will potentially provide us with the first unbiased view of star formation using a single waveband. Such surveys will happen on the same time frame as other major imaging facilities and multi-object spectrographs on 8-m class telescopes (see Section 7). The combination of these major facilities will enable us to investigate galaxy evolution from the perspective of both massive statistical studies, coupled with detailed studies of well-selected samples, focusing on the role of redshift, galaxy mass, environment and feedback from both supernovae and active galactic nuclei. The SKA will contribute to all of these types of study. In this chapter we provide an overview of the statistical power of the SKA in determining the history of star formation in the Universe and how this may depend on galaxy mass and environment.
2 Assumptions
In what follows we will assume that we have both the ability to disentangle star-formation from AGN emission, and photometric redshifts with an uncertainty of up to , based on current optical and near-infrared surveys (e.g. Jarvis et al. 2013). We note that such a precision for emission-line objects is difficult but feasible over the coming decade.
We also base our estimates of the star-formation history on the luminosity functions that underpin the semi-empirical extragalactic sky simulations of Wilman et al. (2008, 2010). These simulations continue to provide a very good description of the latest source counts from various deep field surveys with the JVLA (e.g. Condon et al. 2012; Vernstrom et al. 2014). Although modifications may be required to accurately reproduce the most recent results from e.g. Herschel, the general trends and evolution prescribed are relatively well-matched to our current understanding, and the extrapolations to flux-density levels yet to be reached in the radio band are constrained by observations at a range of other wavelengths. For full details see Wilman et al. (2010).
The receivers being considered for both SKA1-SUR and SKA1-MID means that any observations will cover a large bandwidth of around GHz, however, for ease of comparison with previous work, we adopt a single frequency. However, see Section 8 for a discussion of the impact of this assumption.
SFRs derived from radio observations have predominantly been calibrated to the integrated far-infrared emission, which is one of the most accurate and unbiased tracers of star-formation in galaxies, due to the optically thin nature of the dust to far-infrared emission (de Jong et al. 1985; Appleton et al. 2004; Ivison et al. 2010; Jarvis et al. 2010; Bourne et al. 2011). In this chapter we use the relation between star-formation rate and radio luminosity as provided by Yun et al. (2001), although we note that similar results are obtained if we use the relation of Bell (2003), to investigate how the SKA can contribute to this field.
3 The evolution of radio luminosity function of star-forming galaxies
The most straightforward experiment to trace the star-formation history of the Universe is to measure the evolution of the radio luminosity function of star-forming galaxies (e.g. Hopkins 2004; Smolčić et al. 2009a). We can then use the relation between radio luminosity and star-formation rate derived by several authors (e.g. Condon 1992; Yun et al. 2001; Bell 2003) to estimate the total star-formation rate in the galaxy.
This requires several key measurements: 1) the radio flux density, 2) the redshift of the source, 3) the fraction of radio emission that is due to star formation, rather than from an AGN. The first of these is obviously measured directly from the radio continuum emission, however 2) and 3) are more problematic. We discuss 2) in Section 7 and defer details of 3) to separate chapters (see McAlpine et al. 2015; Makhatini et al. 2015). We note that the large bandwidth will also allow in-band spectral index measurements (see e.g. Rau et al. 2014), thus removing a source of uncertainty in measuring a monochromatic rest-frame luminosity.
To address the evolution of star-forming galaxies from radio surveys, one also needs a tiered survey strategy whereby enough volume is sampled at each cosmic epoch of interest in order to overcome sample variance and gain a representative view of the Universe, from the sparsest voids through to the densest clusters. We therefore consider three tiers that we believe to be representative of the survey strategy that could be conducted with the SKA in phase 1.
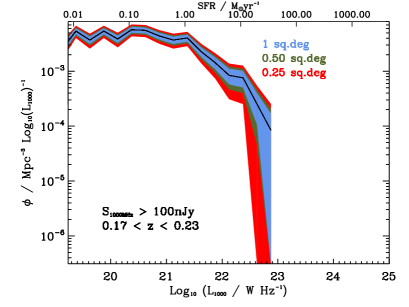
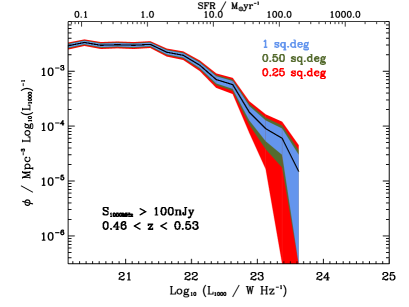
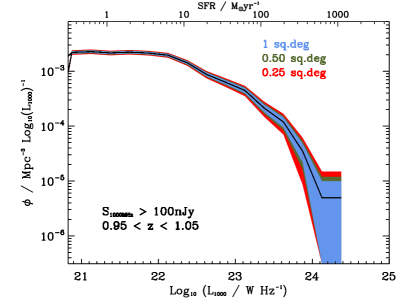
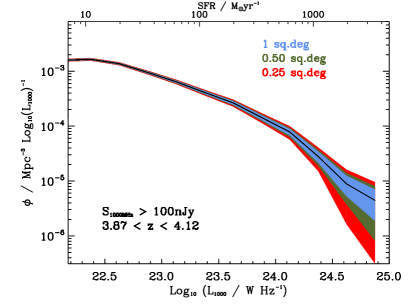
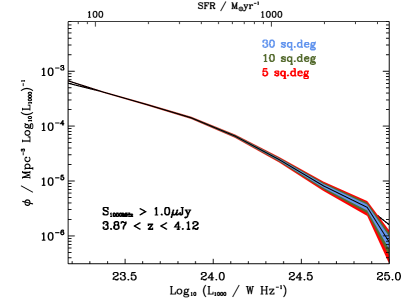
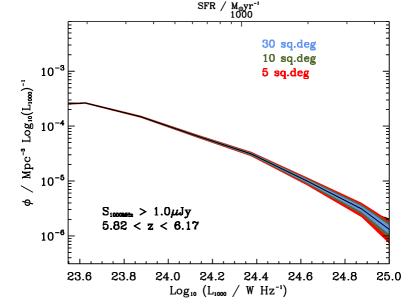
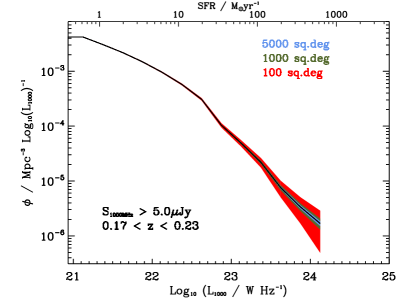
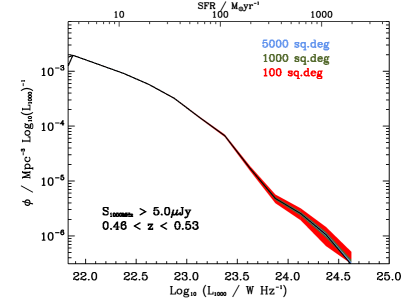
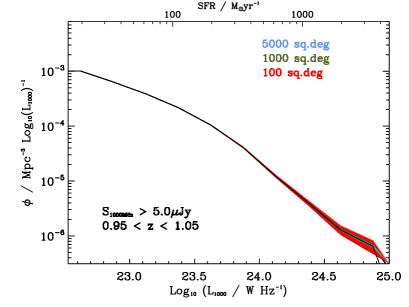
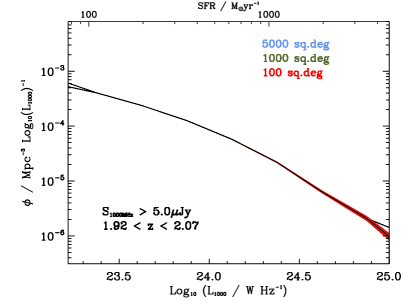
In the following sections and in Figures 1, 2 and 3, we show the predicted measured radio luminosity function of star-forming galaxies for three surveys. These are based on the simulations of Wilman et al. (2008, 2010), assuming a moderate decline in the star-formation rate density at . Together they cover enough cosmic volume from to minimise the Poisson uncertainty, and in the case of the wide and deep surveys, sample variance (see Section 4). We note that the uncertainties on the luminosity function as presented are entirely Poissonian and therefore depend on the volume surveyed, which is why the uncertainties in Figure 1 generally exceed those on the shallower tiers in Figures 2 and 3.
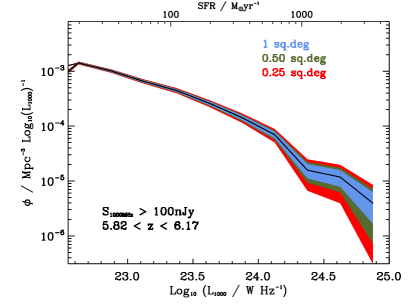
3.1 Ultra Deep
A single deep pointing with the SKA1-MID will be comparable in size to the deepest fields currently surveyed at other wavelengths, although the SKA1-MID deep field would be over a somewhat wider area (1-2 deg2) than the bulk of the ancillary data, which will come from HST, JWST and ALMA, covering optical through to far-infrared wavelengths. This may also warrant a multi-frequency approach with SKA1-MID, where we sample from the synchrotron dominant regime at low frequencies through to the free-free emission that is detectable at higher frequencies, and where the limited primary beam is not a significant problem (e.g. Murphy et al. 2015).
The key science for this tier would be to probe the extremely faint star-forming populations to the highest redshifts (well into the Epoch of Reionisation). For example, to detect a galaxy with a SFR=20 M⊙ yr-1at would require a 100 nJy detection threshold (or an rms of nJy). Such a limit would also allow detection of the star-formation occurring in dwarf galaxies (M M⊙) to cosmologically significant distances (e.g. for a galaxy forming stars at 0.01 M⊙ yr-1).
Figure 1 shows the constraints that would be achieved for the radio luminosity function from such a survey for three survey areas. We note that the primary beam of SKA1-MID at 1000 MHz and 700 MHz are around 0.4 deg2 and 1.5 deg2 respectively, but utilising the full bandwidth increases the effective sensitivity substantially, at the cost of a reduced field-of-view at the top end of the frequency band. Therefore, for the ultra-deep tier we only consider a very small “single-pointing” strategy, which means that the central, highest-sensitivity part of the primary beam can be considered separately to a strategy that utilises the full area of the primary beam, which naturally has a fall off in sensitivity aligned with the beam shape. In practice alternative strategies, which involve some level of mosaicking, should be considered to ensure a more uniform sensitivity across the preferred survey area.
Figure 1 shows that sample-variance limited constraints can be made on the evolution of the star-formation in galaxies with SFR M⊙ yr-1 out to , and that we can determine the evolution of galaxies with SFR M⊙ yr-1to . Furthermore, such surveys are feasible over deg2, and as such provide an interesting complement to surveys that will be carried out with the JWST, which will have the sensitivity to detect similar galaxies at near-infrared wavelengths.
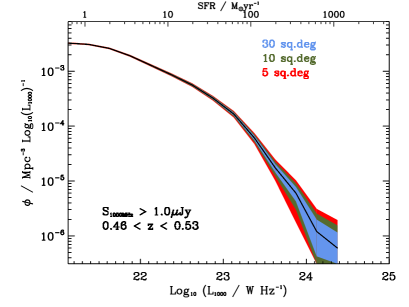
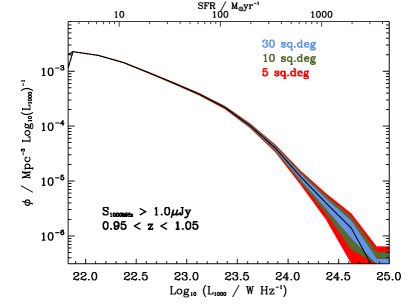
3.2 Deep
The role of the deep survey is to provide a census of the Universe since the epoch of reionisation () through to . In order to probe all environments at these redshifts a survey area of 15-30 deg2 is required, and there are trade-offs in depth versus area that can be made within this specification. However, given that the key multi-wavelength data will come from LSST (see e.g. Bacon et al. 2015) and complementary near-infrared surveys, then it would be sensible to survey the LSST deep drilling fields, four of which are likely to be the COSMOS/UltraVISTA, XMM-LSS, CDFS and ELAIS-S1 fields. LSST will provide around 35 deg2 over these fields with contiguous coverage over 9 deg2 patches of sky in each.
A detection threshold sensitive to M⊙ yr-1at , suggests a flux-density limit of 0.2Jy rms over this area. In Figure 2 it is clear that a 30 deg2 survey to a 5 flux-density limit 1Jy will provide sample-variance limited constraints on the evolution of Milky Way-type galaxies to , whilst providing sufficient area to detect the rarest and more luminous starbursts out to the epoch of reionisation. There is evidence for the most massive galaxies at high redshifts to be more dusty than their lower-mass counterparts (e.g. Willott et al. 2013). This may give the SKA a unique niche in the study of the high-redshift Universe, because although such dusty objects could be detected by far-infrared/submm observatories, the resolution of such facilities is generally prohibitive to identifying their optical/near-infrared counterparts. Indeed, radio observations have been used to associate such sources in the past (e.g. Ivison et al. 2007; Heywood et al. 2013). Furthermore, ALMA may be very efficient at studying such galaxies in detail once they are found, but the small field-of-view of ALMA essentially precludes it from discovering the rarest and most extreme galaxies in the early Universe.
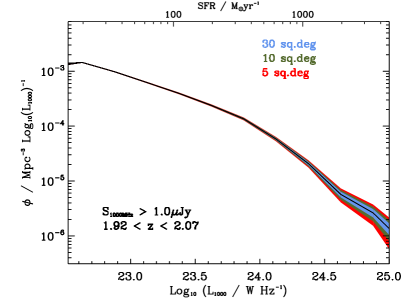
3.3 Wide
We also need to relate the findings on the high-redshift Universe from the deep tier to the lower redshift Universe, therefore we also support a wider, shallower tier that will provide a census of the Universe. To sample the full range of environments at requires a few thousand square degrees. We again use a 20 M⊙ yr-1galaxy at to determine the depth required. This dictates a depth of around 1Jy rms (see Fig. 3). Based on the existence of ancillary data over the KIDS/VIKING area (1500 deg2) and the Dark Energy Survey (5000 deg2) we suggest a combination of these will provide the necessary ancillary data for the science in this tier, at least until LSST and Euclid are well underway.


4 The star-formation main sequence and the build-up of galaxies
Up until now we have only considered how the evolution of star formation in the Universe evolves in a general sense, and have not considered how this may be linked to the evolutionary state of the galaxy, i.e. how much stellar mass is already in place, and also how star formation may be related to environmental effects.
The past decade has seen a marked increase in the study of the relation between the stellar mass and star-formation rate in galaxies, or when considered together, the specific star-formation rate (e.g. Erb et al. 2006; Daddi et al. 2007; Noeske et al. 2007).
The power of the Herschel Space Observatory has also opened up a new window on the star-formation history of the Universe, providing us with a census of obscured star formation from the low-redshift Universe through to . One of the key results to come out of these surveys is a reinforcement of the relation between star-formation and stellar mass, the so-called star-formation main sequence (e.g. Elbaz et al. 2011; Magnelli et al. 2014; Rodighiero et al. 2014). We can use this link to estimate how radio continuum surveys with the SKA will be able to provide an in-depth understanding of the link between the stellar mass build-up, and the current star formation rate. We assume that the measurement of the stellar mass in galaxies will come from a combination of optical (e.g. DES, KIDS, LSST) and near-infrared surveys (e.g. VIKING, VIDEO, UltraVISTA) and also Euclid) (e.g. Ciliegi & Bardelli 2015), i.e. the same data that are also used to determine the photometric redshifts.
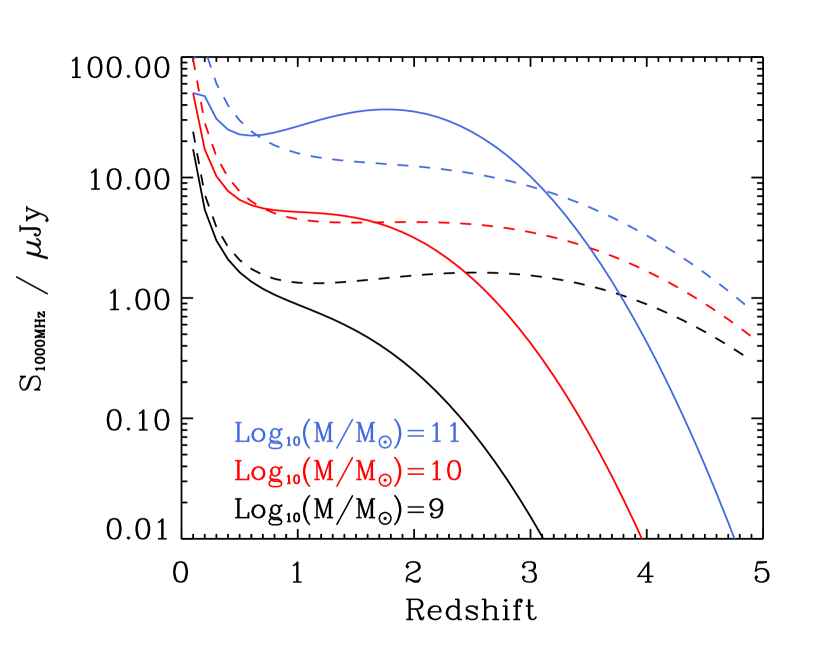
In Figure 4 we show the predicted average radio flux-density that would be detected from galaxies of a given mass as a function of redshift, if they lie on the star-formation main sequence, based on the work of Whitaker et al. (2012) and Johnston et al. (in prep.). This assumes an intrinsic relationship between the stellar mass of a galaxy and its star-formation rate, which evolves strongly with redshift. However, we note that the constraints beyond are very poor and thus the form of the curves at high redshift should be considered highly uncertain, and this is borne out by the divergence in the curves at using the two different studies. We note that many of the most massive galaxies do not exhibit such levels of star formation. On the other hand there is also a significant fraction of starburst galaxies that have higher star-formation rates than those galaxies on the star-formation main sequence.
Therefore, up to the redshift where the current data are constrained (), a survey flux density threshold of Jy is sufficient to determine the SFR of a M⊙ galaxy, if it lies on the star-formation main sequence. Given that such data is free from dust extinction (cf. ultra-violet/optical measurements) and does not suffer from confusion (cf. submm/far-infrared imaging), the SKA will provide the ideal way to push the study of the relation between stellar mass and star-formation to the highest redshifts.
However, when considering the relation between star-formation rate and stellar mass, one needs to consider whether the survey covers enough cosmic volume to not be severely limited by sample variance, in particular for the most massive and highly-clustered galaxies. Therefore, in Figure 5 we show the expected level of sample variance for a given survey area as a function of redshift [of bin width ], for two values of stellar mass, using the prescription of Moster et al. (2011).
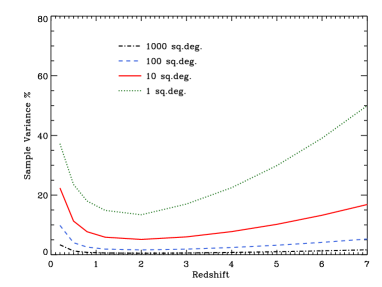
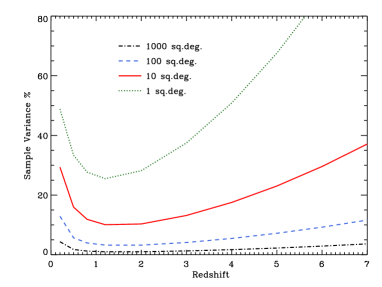
It is clear that in order to overcome significant sample variance for the most massive galaxies at then a minimum of 10 deg2 is needed. Such an area means that the sample variance is of the order of 10 per cent, but increases towards higher redshift. Thus, 30 deg2 is a more appropriate survey area, and having this area comprised of sub-areas helps further in overcoming sample variance. Thus targeting 3-4 distinct areas that are part of the LSST deep drilling fields, covering a total area of around 30 deg2, would provide the ideal balance between survey execution time and overcoming sample variance.
5 The role of environment
The specific star-formation rate has been shown to correlate with both mass and environment (e.g. Baldry et al. 2006; Scoville et al. 2013). This implies that an environmental mechanism is actively influencing galaxy evolution within the densest environments through the truncation of star formation. This raises an important consideration with respect to which correlations are actually dependent on environment and which reflect other correlations that are independent of environment. Recent studies investigating the relationship between mass and environment have concluded that the quenching effects of environment on the star-formation rate in galaxies are separable from the quenching processes traced by stellar mass. Peng et al. (2010) argue that the quenching of star formation in passive red galaxies is distinct from the general decline in the global specific star-formation rate of galaxies since . They showed that the specific SFRs of star-forming galaxies are, at most, a weak function of stellar mass and completely independent of environment. For passive galaxies however, they conclude that environment has little impact on the evolution of the most massive ( M⊙) galaxies, where stellar-mass related quenching dominates through feedback effects. However, for lower-mass passive galaxies ( M⊙), this quenching is the product of environmental interaction processes.
Therefore, surveys with the SKA, which are both sensitive enough to gain a full census of star formation in the high-redshift Universe, but also cover enough cosmic volume to sample the full range in environmental density, will provide the requisite data to significantly enhance our understanding of the evolution of galaxies. Therefore a tiered survey that samples enough cosmic volume at each epoch is required to address these issues.
6 Spatially resolving star-forming galaxies
Studies using MERLIN, Muxlow et al. (2005) have demonstrated that the typical size of high-redshift star-forming galaxies is around arcsec, similar to what is found at optical wavelengths. Adopting a spatial resolution at radio observations that is poorer than the complementary data at other wavelengths will weaken the impact of SKA radio continuum observations from a purely multi-wavelength perspective. However, there are extremely strong scientific reasons for requiring high resolution.
High resolution has been key for determining energetics through brightness temperature measurements of sources to distinguish between accretion and star formation (e.g. Condon et al. 1991), and to directly resolve the impact of jets on star formation in the host galaxy (e.g. McAlpine et al. 2015; Makhatini et al. 2015). To understand star formation we are required to account for the contribution from AGN, and we can only do this with a spatial resolution that allows us to resolve the global star formation activity in the host galaxy.
Furthermore, it is only by resolving such galaxies in the radio that we will be able to measure their disk-averaged star formation rates using a wavelength that is both not obscured by dust or can be confused with the underlying stellar population. When combined with observations of the molecular gas content of such systems (e.g., CO with ALMA), we are able to look for differences in gas depletion times for sources at high redshift, allowing us to investigate whether the modes of star formation in galaxy disks is actually different at high redshift relative to the local universe, for statistically significant samples of sources. The SKA will make a huge impact in this area with the requisite long baselines.
Finally, high resolution is key to understanding star formation in the low-redshift Universe. Although not discussed in this chapter, only with arcsec angular resolution continuum imaging capability, the SKA will be able study the individual components of star-formation and accretion within local ( Mpc) galaxies. Such a capability will allow the SKA to be transformational in this area, providing a complete census of star-formation and low to high luminosity accretion powered objects, thus allowing the study of physics of individual object and the characterisation of the role of these processes more widely within the context of galaxy evolution.
7 The multi-wavelength requirements
The key quantity that is critical for understanding the star-formation history of the Universe derived from radio continuum observations is the redshift of the sources. Radio continuum observations generally provide no indication of the redshift, therefore we require ancillary data from a range of other wavelengths. This could be achieved with broad-band photometry and/or more precise spectroscopic redshifts from future large-format multi-object spectrographs, or indeed using the SKA itself for measuring the Hi 21-cm line.
7.1 Spectroscopic redshifts
Even in 2020 it will not be possible to obtain spectroscopic redshifts for large areas of sky to the faint limits required to gain a census of star-forming galaxies. However, future spectrographs on 8-m class telescopes; e.g. Prime Focus Spectrograph (PFS) on Subaru (Takada et al. 2014), the Maunakea Spectroscopic Explorer111http://mse.cfht.hawaii.edu (MSE), and the Multi-Object Optical and Near-infrared Spectrograph (MOONS) on the VLT (Cirasuolo et al. 2012) may provide the survey power to gain a very good census of the radio sources in the deeper fields. In particular, at and , PFS and MSE will have the spectral coverage at visible wavelengths to obtain emission-line redshifts based on the usual star-formation tracers, e.g. [Oii], H etc. Both are situated in the northern hemisphere so will not be able to cover the whole of the SKA sky, however in terms of the deep fields suggested, only ELAIS-S1 at a declination of deg would be difficult to observe. Moreover, obscured systems that we detect at radio wavelengths but not at optical wavelengths will still be a problem. The proposed near-infrared multi-object spectrograph for the VLT (MOONS) could fill in some of this parameter space, with the redshift desert () difficult to access with optical spectrographs.
For wider and shallower surveys, the proposed 4MOST spectrograph, aiming to survey the entire southern sky in spectroscopy to would provide a basis for obtaining redshifts for the brighter star-forming galaxies, predominantly in the low-redshift Universe. If 4MOST adopted a tiered survey (e.g. WAVES) whereby the integration time was well-matched to the survey strategy for the SKA continuum survey, then it could fill the gap between the ultra-deep pointings one might expect to carry out with MOONS and PFS, and the wide-area tiers.
7.2 Photometric redshifts
The majority of the radio sources detected at these faint levels will be too faint at optical wavelengths to obtain spectroscopic redshifts. We are therefore reliant on photometric redshifts based on the deep imaging data that will be available on the same timescale as the SKA. In the early phases this will be from surveys that are currently underway, such as COSMOS/UltraVISTA (Scoville et al. 2007; McCracken et al. 2012), SXDF/UDS (Furusawa et al. 2008; Foucaud et al. 2007) and the VIDEO survey fields (Jarvis et al. 2013) for the deep surveys, and KIDS/VIKING (de Jong et al. 2013; Edge et al. 2013), DES/VHS (e.g. Banerji et al. 2014) and WISE (Wright et al. 2010) for the wider areas.
As we move to the full operation of SKA1 then we should also have LSST and Euclid imaging, which will provide very deep imaging from the -band through to -band across a large swathe of the southern sky. The expected photometric redshift accuracy from such surveys is and we have assumed this in our predictions for the luminosity function evolution based on the SKA continuum surveys. However, we note that it is impossible to quantify the accuracy of photometric redshifts of objects that are fainter than the limits possible with spectroscopy. Furthermore, emission-line galaxies are generally more difficult to estimate the photometric redshifts for, due to the uncertainty surrounding the strength of emission lines which pass through various filters.
In addition to the photometric redshifts, these surveys provide the necessary data from which to derive other properties of the galaxies, e.g. stellar mass, optical reddening and morphology.
8 The SKA
In this section we discuss the technical requirements of the science presented in this chapter.
The key argument revolves around the need to have high resolution, in order to avoid the confusion limit and allow the characterisation of the radio sources based on their morphology (Section 6), whilst also aiming to observe at relatively low frequency to maximise the observed flux density of the sources, due to the steep synchrotron-emission spectrum ( for star-forming galaxies). This is particularly pertinent at high redshift, where the synchrotron spectrum may steepen towards high-frequency due to synchrotron losses off CMB photons (e.g. Murphy 2009). The adopted central frequency of 1000 MHz, used in this chapter corresponds to a resolution of arcsec for SKA1-MID, whereas SKA1-SUR would provide a resolution of arcsec, i.e. much larger than the typical angular extent of galaxies at .
Furthermore, given a typical spectral index of 222., then sources that are detected at 20 at 700 MHz will be detected at at 1.4 GHz in the same receiver band, with a resolution of arcsec with SKA1-MID (compared to 1 arcsec for SKA1-SUR). This will allow detailed morphologies to be measured for a large fraction of the sources using SKA1-MID, and certainly to a better accuracy than non-AO assisted ground-based optical imaging, although obviously the primary beam is smaller at 1.4 GHz compared to 700 MHz so a different survey strategy would be required to obtain uniform coverage at the higher frequency (we note that this would apply to SKA1-SUR as well if the PAF was optimised towards the lower frequency end of the band using the maximum number of beams). If SKA1-SUR was to be used then we would lose all of our ability to obtain morphological measurements of star-forming galaxies at high redshift, where the typical size is of order arcsec, and therefore much of the unique science that can be achieved with the SKA.
We also note that SKA1-MID is a faster survey instrument than SKA1-SUR at the required resolution ( arcsec) at all frequencies below 1.4 GHz. For a fixed resolution this advantage increases with decreasing frequency. As a resolution of 0.5 arcsec is essential for this science, then the number of sources is maximised by going to the lowest frequency.
Therefore, the combination of longer maximum baselines and higher instantaneous sensitivity makes SKA1-MID the preferred facility for this science case, as the higher surveys speeds at high frequencies for the PAF technology is negated for the majority of radio continuum science, due to ability to move to lower frequency with single-pixel feeds. For the shallower tier SKA1-SUR is more competitive, and the key limiting factor is the angular resolution.
8.1 Towards SKA1
Given that the SKA will be built up over the coming decade, in this section we highlight the preferred build-out strategy for the science case outlined above.
In order to make the most informative surveys as the SKA is expanded, then enhancing the ability to reach the full depth at the full resolution as quickly as possible will ensure that the new continuum surveys for studying the star-formation history of the Universe will surpass what is possible with the JVLA (e.g. Hales 2013; Brown et al. 2013; Jarvis et al. 2014). Initially this should be done at the expense of survey area. Given that the requisite multi-wavelength surveys will not exist to the required depth over the survey areas described in Section 3, then it makes perfect sense to start the surveys on smaller scales, but retaining the final depth. As such, for 50 per cent of SKA1-MID, surveying the 13.5 deg2 covered by the combination of the VIDEO and UltraVISTA near-infrared surveys would provide the greatest leap in our understanding of the total star-formation rate in galaxies, over the epoch where the Universe was undergoing its most active phase at . This would also enable the study of the environmental dependence of star formation over the vast majority of environments, and provide sufficient area in four independent fields to reduce the significant effects of sample variance.
Given that low-surface brightness sensitivity is not a key element for such surveys, then this means that in order to obtain the requisite resolution, the core of SKA1-MID could be delayed with respect to the long baselines, which are critical to retain the resolution for morphological studies and to avoid confusion at these very deep levels. This would require a similar time to complete as the full 30 deg2 survey, as the poorer sensitivity is balanced by the reduced survey area.
8.2 SKA1
The three surveys in Section 3 could be carried out fully with SKA1-MID, providing a unique census of star formation from the local Universe through to the epoch of reionisation. The key elements of SKA1-MID are the high sensitivity, large bandwidth in Band 1 or 2, along with the high resolution at relatively low frequency, which are required to push to low star-formation rates at high redshift whilst retaining morphological information.
8.3 SKA2
SKA2, with a factor of 10 increase in sensitivity and resolution, will be unrivalled for studying the total star formation rate in galaxies. Although at this stage it would be possible to extend the deep field and ultra-deep fields described in Section 3 to much wider areas, there may be little gained if this was seen as the default approach. By the mid-2020s our understanding of the evolution of star formation will have changed significantly, and it is really the new parameter space that is most likely to add to our understanding. For example, obtaining JWST-like resolution over enough cosmic volume that all environments are probed, out to the highest redshifts, would be a significant advancement over the foreseeable surveys with SKA1-MID. Therefore, the highest priority in our opinion would be to; a) cover the 30 deg2 where the best ancillary data lies, to the depth of the ultra-deep survey described above, but at a resolution of 30 milli-arcseconds. This would allow the study of star forming regions on the scale of 200 pc (i.e. the size of the Tarantula Nebula in the LMC) up to the highest redshifts, and, b) conduct ultra-deep surveys of dense regions to better understand the role of environment.
9 Conclusions
The SKA promises to be the premier facility for understanding the evolution of star formation in the Universe. Unlike optical and ultra-violet observations, the radio emission is not extinguished by dust, and thus provides a unique method to trace the total star-formation rate in galaxies. Furthermore, the resolution that is possible with the SKA surpasses what will be possible with the JWST, allowing morphologies and individual star-forming regions to be observed to the highest redshifts. Such observations, which will also cover enough area of sky to overcome sample variance, and allow star-formation to be studied as a function of galaxy environment, will provide the best method for understanding the build up of stellar mass in the Universe.
References
- Afonso et al. (2005) Afonso, J., Georgakakis, A., Almeida, C., Hopkins, A. M., Cram, L. E., Mobasher, B., & Sullivan, M. 2005, Astrophys. J. , (6) 24, 135
- Appleton et al. (2004) Appleton, P. N. et al., . 2004, ApJS, 154, 147
- Bacon et al. (2015) Bacon, D. et al., . 2015, in proceedings of ”Advancing Astrophysics with the Square Kilometre Array”, 2015, \posPoS(AASKA14)145
- Baldry et al. (2006) Baldry, I. K., Balogh, M. L., Bower, R. G., Glazebrook, K., Nichol, R. C., Bamford, S. P., & Budavari, T. 2006, MNRAS, 373, 469
- Baldwin et al. (1981) Baldwin, J. A., Phillips, M. M., & Terlevich, R. 1981, PASP, 93, 5
- Banerji et al. (2014) Banerji, M. et al., . 2014, ArXiv.1407.3801
- Bell (2003) Bell, E. F. 2003, Astrophys. J. , (5) 86, 794
- Bonzini et al. (2013) Bonzini, M., Padovani, P., Mainieri, V., Kellermann, K. I., Miller, N., Rosati, P., Tozzi, P., & Vattakunnel, S. 2013, MNRAS, 436, 3759
- Bourne et al. (2011) Bourne, N., Dunne, L., Ivison, R. J., Maddox, S. J., Dickinson, M., & Frayer, D. T. 2011, MNRAS, 410, 1155
- Brown et al. (2015) Brown, M. et al., . 2015, in proceedings of ”Advancing Astrophysics with the Square Kilometre Array”, 2015, \posPoS(AASKA14)023
- Brown et al. (2013) Brown, M. L. et al., . 2013, ArXiv.1312.5618
- Burgarella et al. (2013) Burgarella, D. et al., . 2013, A&A, 554, A70
- Ciliegi & Bardelli (2015) Ciliegi, P. & Bardelli, S. 2015, in proceedings of ”Advancing Astrophysics with the Square Kilometre Array”, 2015, \posPoS(AASKA14)150
- Cirasuolo et al. (2012) Cirasuolo, M. et al., . 2012, in Society of Photo-Optical Instrumentation Engineers (SPIE) Conference Series, Vol. 8446, Society of Photo-Optical Instrumentation Engineers (SPIE) Conference Series
- Condon (1992) Condon, J. J. 1992, Ann. Rev. Astron. & Astrophys. , (3) 0, 575
- Condon et al. (2012) Condon, J. J., Cotton, W. D., Fomalont, E. B., Kellermann, K. I., Miller, N., Perley, R. A., Scott, D., Vernstrom, T., & Wall, J. V. 2012, Astrophys. J. , (7) 58, 23
- Condon et al. (1991) Condon, J. J., Huang, Z.-P., Yin, Q. F., & Thuan, T. X. 1991, Astrophys. J. , (3) 78, 65
- Cram et al. (1998) Cram, L., Hopkins, A., Mobasher, B., & Rowan-Robinson, M. 1998, Astrophys. J. , (5) 07, 155
- Daddi et al. (2007) Daddi, E. et al., . 2007, Astrophys. J. , (6) 70, 156
- de Jong et al. (2013) de Jong, J. T. A. et al., . 2013, The Messenger, 154, 44
- de Jong et al. (1985) de Jong, T., Klein, U., Wielebinski, R., & Wunderlich, E. 1985, A&A, 147, L6
- Dole et al. (2006) Dole, H. et al., . 2006, A&A, 451, 417
- Drake et al. (2013) Drake, A. B. et al., . 2013, MNRAS, 433, 796
- Dye et al. (2010) Dye, S. et al., . 2010, A&A, 518, L10
- Edge et al. (2013) Edge, A., Sutherland, W., Kuijken, K., Driver, S., McMahon, R., Eales, S., & Emerson, J. P. 2013, The Messenger, 154, 32
- Elbaz et al. (2011) Elbaz, D. et al., . 2011, A&A, 533, A119
- Erb et al. (2003) Erb, D. K., Shapley, A. E., Steidel, C. C., Pettini, M., Adelberger, K. L., Hunt, M. P., Moorwood, A. F. M., & Cuby, J.-G. 2003, Astrophys. J. , (5) 91, 101
- Erb et al. (2006) Erb, D. K., Steidel, C. C., Shapley, A. E., Pettini, M., Reddy, N. A., & Adelberger, K. L. 2006, Astrophys. J. , (6) 47, 128
- Ferramacho et al. (2014) Ferramacho, L. D., Santos, M. G., Jarvis, M. J., & Camera, S. 2014, MNRAS, 442, 2511
- Foucaud et al. (2007) Foucaud, S. et al., . 2007, MNRAS, 376, L20
- Furusawa et al. (2008) Furusawa, H. et al., . 2008, ApJS, 176, 1
- Gilbank et al. (2010) Gilbank, D. G., Baldry, I. K., Balogh, M. L., Glazebrook, K., & Bower, R. G. 2010, MNRAS, 405, 2594
- Gruppioni et al. (2013) Gruppioni, C. et al., . 2013, MNRAS, 432, 23
- Haarsma et al. (2000) Haarsma, D. B., Partridge, R. B., Windhorst, R. A., & Richards, E. A. 2000, Astrophys. J. , (5) 44, 641
- Hales (2013) Hales, C. A. 2013, ArXiv.1312.4602
- Herbert et al. (2010) Herbert, P. D., Jarvis, M. J., Willott, C. J., McLure, R. J., Mitchell, E., Rawlings, S., Hill, G. J., & Dunlop, J. S. 2010, MNRAS, 406, 1841
- Heywood et al. (2013) Heywood, I., Bielby, R. M., Hill, M. D., Metcalfe, N., Rawlings, S., Shanks, T., & Smirnov, O. M. 2013, MNRAS, 428, 935
- Hopkins (2004) Hopkins, A. M. 2004, Astrophys. J. , (6) 15, 209
- Ivison et al. (2007) Ivison, R. J. et al., . 2007, MNRAS, 380, 199
- Ivison et al. (2010) —. 2010, A&A, 518, L31
- Jackson & Rawlings (1997) Jackson, N. & Rawlings, S. 1997, MNRAS, 286, 241
- Jarvis et al. (2015) Jarvis, M. J., Bacon, D., Blake, C., Brown, M., Lindsay, S., Raccanelli, A., Santos, M., & Schwarz, D. 2015, in proceedings of ”Advancing Astrophysics with the Square Kilometre Array”, 2015, \posPoS(AASKA14)018
- Jarvis et al. (2014) Jarvis, M. J. et al., . 2014, ArXiv.1401.4018
- Jarvis et al. (2013) —. 2013, MNRAS, 428, 1281
- Jarvis & Rawlings (2004) Jarvis, M. J. & Rawlings, S. 2004, NewAR, 48, 1173
- Jarvis et al. (2010) Jarvis, M. J. et al., . 2010, MNRAS, 409, 92
- Karim et al. (2011) Karim, A. et al., . 2011, Astrophys. J. , (7) 30, 61
- Kewley et al. (2013) Kewley, L. J., Maier, C., Yabe, K., Ohta, K., Akiyama, M., Dopita, M. A., & Yuan, T. 2013, ApJL, 774, L10
- Lapi et al. (2011) Lapi, A. et al., . 2011, Astrophys. J. , (7) 42, 24
- Madau & Dickinson (2014) Madau, P. & Dickinson, M. 2014, Ann. Rev. Astron. & Astrophys. , (5) 2, 415
- Magnelli et al. (2014) Magnelli, B. et al., . 2014, A&A, 561, A86
- Magnelli et al. (2013) —. 2013, A&A, 553, A132
- Makhatini et al. (2015) Makhatini, S., Smirnov, O., Jarvis, M., & Heywood, I. 2015, in proceedings of ”Advancing Astrophysics with the Square Kilometre Array”, 2015, \posPoS(AASKA14)081
- McAlpine et al. (2013) McAlpine, K., Jarvis, M. J., & Bonfield, D. G. 2013, MNRAS, 436, 1084
- McAlpine et al. (2015) McAlpine, K. et al., . 2015, in proceedings of ”Advancing Astrophysics with the Square Kilometre Array”, 2015, \posPoS(AASKA14)083
- McCracken et al. (2012) McCracken, H. J. et al., . 2012, A&A, 544, A156
- McKean et al. (2015) McKean, J. et al., . 2015, in proceedings of ”Advancing Astrophysics with the Square Kilometre Array”, 2015, \posPoS(AASKA14)084
- Moster et al. (2011) Moster, B. P., Somerville, R. S., Newman, J. A., & Rix, H.-W. 2011, Astrophys. J. , (7) 31, 113
- Murphy et al. (2015) Murphy, E. et al., . 2015, in proceedings of ”Advancing Astrophysics with the Square Kilometre Array”, 2015, \posPoS(AASKA14)085
- Murphy (2009) Murphy, E. J. 2009, Astrophys. J. , (7) 06, 482
- Muxlow et al. (2005) Muxlow, T. W. B. et al., . 2005, MNRAS, 358, 1159
- Noeske et al. (2007) Noeske, K. G. et al., . 2007, ApJL, 660, L43
- Padovani et al. (2009) Padovani, P., Mainieri, V., Tozzi, P., Kellermann, K. I., Fomalont, E. B., Miller, N., Rosati, P., & Shaver, P. 2009, Astrophys. J. , (6) 94, 235
- Peng et al. (2010) Peng, Y.-j. et al., . 2010, Astrophys. J. , (7) 21, 193
- Rau et al. (2014) Rau, U., Bhatnagar, S., & Owen, F. N. 2014, ArXiv.1403.5242
- Rodighiero et al. (2014) Rodighiero, G. et al., . 2014, MNRAS, 443, 19
- Scoville et al. (2013) Scoville, N. et al., . 2013, ApJS, 206, 3
- Scoville et al. (2007) —. 2007, ApJS, 172, 1
- Seymour et al. (2008) Seymour, N., Dwelly, T., Moss, D., McHardy, I., Zoghbi, A., Rieke, G., Page, M., Hopkins, A., & Loaring, N. 2008, MNRAS, 386, 1695
- Simpson et al. (2006) Simpson, C., Martínez-Sansigre, A., Rawlings, S., Ivison, R., Akiyama, M., Sekiguchi, K., Takata, T., Ueda, Y., & Watson, M. 2006, MNRAS, 372, 741
- Smith et al. (2014) Smith, D. J. B. et al., . 2014, MNRAS, 445, 2232
- Smolčić et al. (2015) Smolčić, E. et al., . 2015,in proceedings of ”Advancing Astrophysics with the Square Kilometre Array”, 2015, \posPoS(AASKA14)069
- Smolčić et al. (2009a) Smolčić, V. et al., . 2009a, Astrophys. J. , (6) 90, 610
- Smolčić et al. (2009b) —. 2009b, Astrophys. J. , (6) 96, 24
- Sobral et al. (2012) Sobral, D., Best, P. N., Matsuda, Y., Smail, I., Geach, J. E., & Cirasuolo, M. 2012, MNRAS, 420, 1926
- Takada et al. (2014) Takada, M. et al., . 2014, PASJ, 66, 1
- Takeuchi et al. (2005) Takeuchi, T. T., Buat, V., & Burgarella, D. 2005, A&A, 440, L17
- Vaccari et al. (2010) Vaccari, M. et al., . 2010, A&A, 518, L20
- Vernstrom et al. (2014) Vernstrom, T., Scott, D., Wall, J. V., Condon, J. J., Cotton, W. D., Fomalont, E. B., Kellermann, K. I., Miller, N., & Perley, R. A. 2014, MNRAS, 440, 2791
- Whitaker et al. (2012) Whitaker, K. E., van Dokkum, P. G., Brammer, G., & Franx, M. 2012, ApJL, 754, L29
- White et al. (2014) White, S. V., Jarvis, M. J., Häußler, B., & Maddox, N. 2014, ArXiv.1410.3892
- Willott et al. (2013) Willott, C. J. et al., . 2013, AJ, 145, 4
- Wilman et al. (2010) Wilman, R. J., Jarvis, M. J., Mauch, T., Rawlings, S., & Hickey, S. 2010, MNRAS, 405, 447
- Wilman et al. (2008) Wilman, R. J. et al., . 2008, MNRAS, 388, 1335
- Wright et al. (2010) Wright, E. L. et al., . 2010, AJ, 140, 1868
- Yun et al. (2001) Yun, M. S., Reddy, N. A., & Condon, J. J. 2001, Astrophys. J. , (5) 54, 803
- Zwart et al. (2014) Zwart, J. T. L., Jarvis, M. J., Deane, R. P., Bonfield, D. G., Knowles, K., Madhanpall, N., Rahmani, H., & Smith, D. J. B. 2014, MNRAS, 439, 1459