The Rich Are Different:
Evidence from the RAVE Survey for Stellar Radial Migration
Abstract
Using the RAdial Velocity Experiment fourth data release (RAVE DR4), and a new metallicity calibration that will be also taken into account in the future RAVE DR5, we investigate the existence and the properties of super-solar metallicity stars () in the sample, and in particular in the Solar neighbourhood. We find that RAVE is rich in super-solar metallicity stars, and that the local metallicity distribution function declines remarkably slowly up to . Our results show that the kinematics and height distributions of the super-solar metallicity stars are identical to those of the thin-disc giants that we presume were locally manufactured. The eccentricities of the super-solar metallicity stars indicate that half of them are on a roughly circular orbit (), so under the assumption that the metallicity of the interstellar medium at a given radius never decreases with time, they must have increased their angular momenta by scattering at corotation resonances of spiral arms from regions far inside the Solar annulus. The likelihood that a star will migrate radially does not seem to decrease significantly with increasing amplitude of vertical oscillations within range of oscillation amplitudes encountered in the disc.
keywords:
Galaxy: abundances – Galaxy: disc – Galaxy: kinematics and dynamics – Galaxy: stellar content – Galaxy: evolution.1 Introduction
The disc is our Galaxy’s dominant visible component and contains most of the baryons that lie within a sphere of radius . Hence if we are to understand how our very typical Galaxy has arisen within the CDM paradigm (Springel et al., 2006), we need to know how the disc is structured, functions and was formed. Since the seminal works of Spitzer & Schwarzschild (1953); Pagel & Patchett (1975); Matteucci & Francois (1989) and others, the relevant framework has been recognised to be the accretion of cool gas onto a centrifugally supported disc within which stars form on nearly circular orbits. Dying stars enrich the star-forming gas with metals, and fluctuations in the Galaxy’s gravitational field cause stars to migrate to less circular orbits that are more inclined to the Galactic plane (Binney, 2013a; Sellwood, 2014, and references therein).
In a classic study Eggen et al. (1962) showed that the orbits of the stars and the chemical composition of their atmospheres suggest how one may reconstruct the history of the Milky Way. While the chemical composition of a star retains (to a good approximation) an imprint of the chemistry of the Inter-Stellar Medium (ISM) at the time and place of its birth (e.g.: Yoshii, 1981; Freeman & Bland-Hawthorn, 2002), its orbit depends both on the environment in which the star formed (within circularly orbiting gas or gas in free fall, or the gas disc of a satellite) and subsequent evolution of the orbit in response to fluctuations in the Galaxy’s gravitational field (generated by molecular clouds, spiral structure, the bar, halo substructure, etc). The correlations between chemistry and kinematics are therefore tracers of the coevolution of nucleosynthesis and dynamical evolution.
The component of angular momentum about the Galaxy’s approximate symmetry axis plays a crucial role, and with we associate a guiding-centre radius by the equation , where is the speed of a circular orbit at . A star with angular momentum executes radial oscillations around . Changes in are therefore associated with changes in and one speaks of “radial migration” when changes.
Measurements of the abundances and metallicities111We denote the overall metallicity of a star, [M/H], the ratio of the abundance of any element to its abundance in the Sun. It is defined as . of young O and B stars, and nebular abundances, reveal the chemistry of the current ISM, whereas measurements of lower-mass FGK stars, reveal the chemistry of the ISM billions of years in the past. The available data are consistent with the conjecture that within a given Galactocentric annulus the ISM is chemically homogeneous. In particular, the ISM is very homogeneous within several hundred parsecs of the Sun (Cartledge et al., 2006). So if we could establish the ISM’s radial metallicity profile for each time in the past, we could infer the birth radius of a star of age from its measured value of [M/H] (see Gazzano et al., 2013; Boeche et al., 2013b; Hayden et al., 2014, and references therein for radial metallicity gradients of FGK stars).
Stars in the solar neighbourhood with metallicities above solar () are especially powerful probes of the evolution of the Milky Way’s disc. They can form only after several previous generations of stars have enriched their local ISM (e.g. Pagel, 1997; Matteucci, 2003). This can either take several billion years in regions where the star formation rate is low and approximately constant with time (OB stars in the Milky Way disc near the Sun only reach, on average, , Nieva & Przybilla, 2012), or occur rapidly in dense environments, such as the Galactic bulge, where we find stars with that are several billion years old (e.g.: Whitford & Rich, 1983; Hill et al., 2011).
Given the homogeneity of the ISM, stars with (noted super metal-rich stars, SMR, hereafter) must have formed inside the Sun’s Galactocentric distance , and we see them here either because they have significantly increased their Galactocentric angular momenta, and thus their guiding-centre radii (Grenon, 1989a, 1999b; Chiappini, 2009), or because they have moved to significantly eccentric orbits, or on account of a combination of both these processes.
Sellwood & Binney (2002) showed that the dominant effect of transient spiral structure is to cause stars that are in corotation resonance (CR) with the spiral to exchange angular momentum without changing the eccentricity of their orbits. They dubbed this process “churning”. Lynden-Bell & Kalnajs (1972) had already shown that stars that are in a Lindblad resonance exchange angular momentum with the spiral in such a way that on average they move to more eccentric orbits: at inner Lindblad resonance (ILR) stars typically surrender angular momentum to the spiral, while at outer Lindblad resonance (OLR) they gain angular momentum from the spiral. Since stars scattered at ILR lose angular momentum, and the great majority of disc stars were born inside (which is of order 3 of the disc’s exponential scale lengths), SMR stars on highly eccentric orbits are likely to have been scattered at OLR and thus have increased both their angular momenta and eccentricity.
Hence a star that has markedly increased its angular momentum without moving to a highly eccentric orbit must have been scattered at CR by the churning process. The azimuthal velocities of these stars will not lag the circular velocity by much. On the other hand, stars that reach the Sun on eccentric orbits from guiding-centres that are significantly smaller than will lag the local circular speed significantly. Hence by measuring the random velocities and the azimuthal speeds of stars we should be able to determine the relative importance of scattering at CR and at OLR.
The observational evidence for radial migration is still relatively scanty. In nearby disc galaxies, Yoachim et al. (2012) and Radburn-Smith et al. (2012) measured for a subsample of their targets a change of the age of the dominant population at the location of the break in the disc surface brightness, in agreement with the theoretical work of Roškar et al. (2008) on broken exponential profile in galaxies experiencing radial migration. As far as the Milky Way is concerned, Sellwood & Binney (2002) and Haywood (2008) argued that the large scatter in the age-metallicity relation near the Sun (e.g.: Edvardsson et al., 1993; Bergemann et al., 2014) is evidence of radial migration, whereas Lee et al. (2011), using SEGUE data (Sloan Extension for Galactic Understanding and Exploration, Yanny et al., 2009), invoked radial migration to explain why the metallicity of thin disc stars (for the range [Fe/H]) is uncorrelated with their orbital eccentricity. Finally, using RAVE data (RAdial Velocity Experiment, Steinmetz et al., 2006), Minchev et al. (2014c) found a decline of the velocity dispersion of the enhanced low-metallicity disc stars, and suggested that the stars responsible for this decline are migrators from the inner disc.
The actual efficiency of radial migration, i.e., the maximum distance from which a star can reach the Solar neighbourhood, has never been observationally constrained. Indeed, this is a challenging task, since distinguishing radially migrated stars from ones of the same metallicity that were born locally requires either accurate ages (for example, SMR stars having migrated from the Bulge region should be on average older than locally born stars at the same metallicity) or knowing how the metallicity gradient of the ISM has evolved. In this paper, however, we aim to obtain a first estimate of the radial migration efficiency by investigating the shape of the metallicity distribution function of the metal-rich tail of the Solar neighbourhood stars, in combination with a study of stellar orbits. For this purpose, we use the kinematically unbiased spectroscopic catalogue of RAVE (Steinmetz et al., 2006), for which the latest data release (DR4, Kordopatis et al., 2013a) has published the atmospheric parameters, metallicities and distances of approximately 400,000 relatively bright FGK stars ( mag).
Section 2 describes the data set used, in particular the new calibration of the metal-rich end, as well as the way the distances, velocities and orbits of the stars have been computed. Section 3 characterises the significance of the SMR stars that we identify in RAVE, and shows that the normal disc giants is likely to have amongst them stars born in regions where the Galactic bulge now dominates. Finally, Section 4 concludes.
2 Description of the data and the new metallicity calibration relation
2.1 A new metallicity calibration for the metal-rich stars
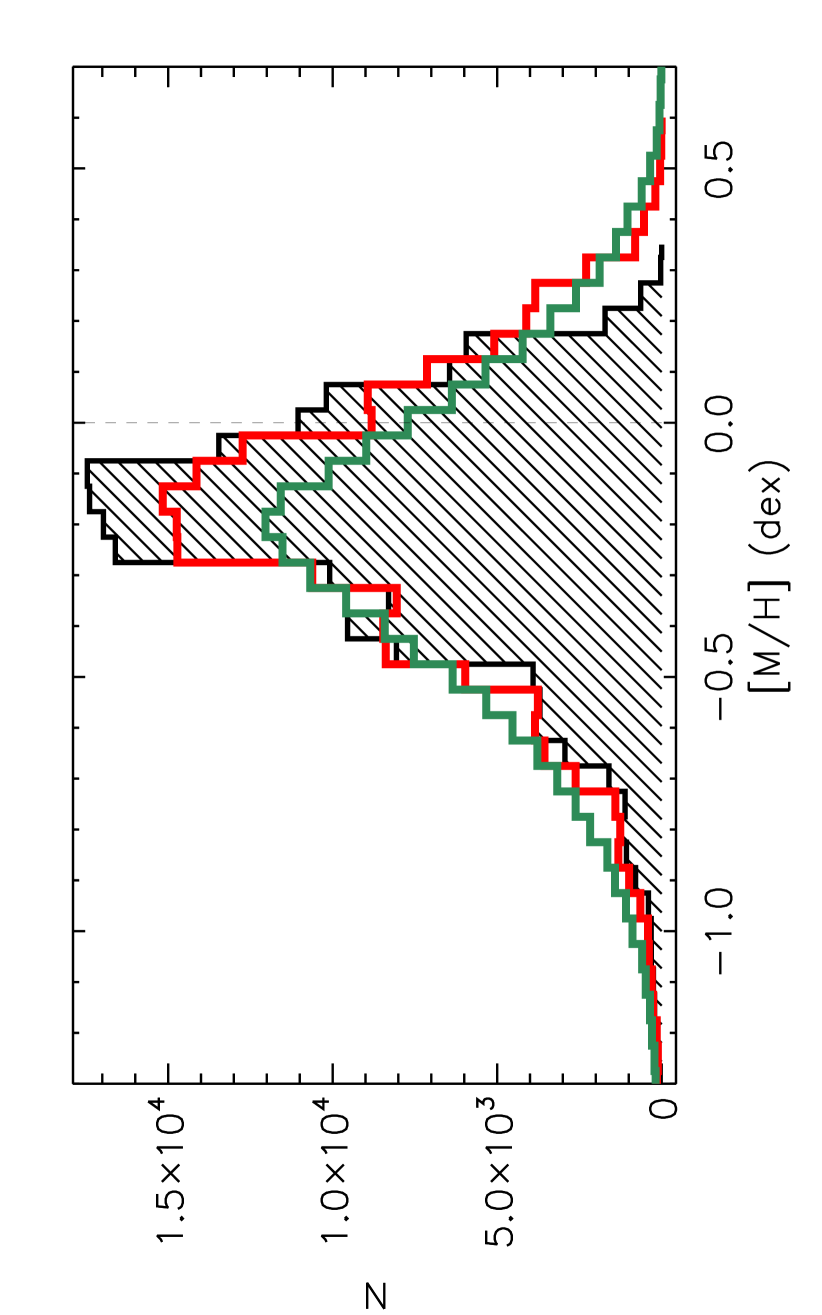
One of the major improvements of RAVE DR4 (Kordopatis et al., 2013a), compared to the previous data releases (Zwitter et al., 2008; Siebert et al., 2011), is its more thorough metallicity calibration, based on the RAVE observations of cluster stars and the availability of high-resolution spectra of already observed RAVE targets. Although the calibration has had several successes (e.g.: Kordopatis et al., 2013b; Binney et al., 2014; Conrad et al., 2014; Minchev et al., 2014c; Kordopatis, 2014), it suffered from a lack of calibration targets at the high-metallicity end. High-metallicity stars are not -rich, so at the high-metallicity end the [M/H] and [Fe/H] distributions should approximately coincide. In Fig. 1 the black histogram shows the DR4 [M/H] distribution while the green histogram shows the [Fe/H] distribution from the RAVE chemical pipeline (Boeche et al., 2013a). Contrary to expectation, the [M/H] distribution falls far below the [Fe/H] distribution at the high-metallicity end.
In the light of this discrepancy, the RAVE DR4 metallicity calibration has been revised at the metal-rich end, using spectra of Gaia Benchmark stars (Jofré et al., 2014) processed through the RAVE pipeline, as well as a comparison of the pipeline’s results for an additional 150 metal-rich stars that had parameters derived from very high resolution spectra using the High Accuracy Radial velocity Planet Searcher (HARPS) spectrograph (Adibekyan et al., 2013) and the Fiber-fed Extended Range Optical Spectrograph (FEROS Worley et al., 2012). Details of the updated calibration will be given in the RAVE-DR5 paper (in prep.). In summary, the calibration procedure is the same as in DR4, i.e., fitting the difference between the metallicities derived from the pipeline and literature metallicities of all available calibrators to a second order polynomial in and [M/H]. The resulting calibration relation is almost unchanged for all of the stars with (less than difference), and provides a more symmetric shape of the metallicity distribution function at – the red histogram of Fig. 1 shows the new distribution.
2.2 Distances, positions, orbits and quality sub-sample
After modifying the metallicities of the stars, one should re-determine the distances to these stars since the DR4 distances (Binney et al., 2014) used the DR4 metallicities. However, by re-running the distance pipeline it has been found that increasing the metallicities of all super-solar metallicity stars by up to typically adds to the derived distance moduli (see Fig. 2). This represents about a 2% increase in distance, which is negligible compared to our uncertainties, estimated to be %. Hence here we use the published DR4 distances.
We adopted the solar motion with respect to the Local Standard of Rest (LSR) of Schönrich et al. (2010), namely , and assumed that the Sun is located at and that the LSR is on a circular orbit with circular speed . Then from the DR4 data we computed the Galactocentric positions and velocities of the stars, in the same way as in Kordopatis et al. (2013b).
We used the model Galaxy of Dehnen & Binney (1998), where the Galactic gravitational potential is built with three superposed double-exponential discs (thin disc, thick disc and gas layer) and two spheroids (bulge and dark halo). More specifically, the density of each disc is given by:
| (1) |
where and are the coordinates in a Galactocentric cylindrical coordinate system, and are, respectively, the scale-length and scale-height, is the disc’s central surface density and where a non-zero value of generates a central depression in the disc. The density of the spheroids is given by:
| (2) |
where and control the outer and inner density slopes, and are the scale and cut-off radii, sets the scale density and , defined as:
| (3) |
includes the axis ratio of the isodensity surfaces. Table 1 presents the values that are adopted in this work for each disc and spheroid. In the fixed potential of this model we used the “Stäckel Fudge” of Binney (2012b) to determine the smallest and largest radii at which the orbit defined by its given initial condition cuts the Galactic plane, and then computed the orbit’s mean radius and the orbital eccentricity .
| Disc | Thick | Thin | Gas |
|---|---|---|---|
| 2.4 | 2.4 | 4.8 | |
| 1.0 | 0.36 | 0.04 | |
| 0 | 0 | 4 | |
| Spheroid | Dark halo | Bulge | |
| 0.8 | 0.6 | ||
| 1.8 | |||
| 2.21 | 1.8 | ||
| 1.09 | 1 | ||
| 1000 | 1.9 |
The sample analysed here is selected to have reliable stellar parameters (and therefore distances, velocities and orbits) following the recommendations of Kordopatis et al. (2013a). It contains only stars that have effective temperature TeffK, surface gravity , errors in line-of-sight velocity e, spectral morphological flags set to ‘’ (normal stars) and for which the stellar parameter pipeline had converged222Given the S/N threshold applied, was required, indicating that the pipeline should converge without getting outside the synthetic spectra grid boundaries (see also Kordopatis et al., 2011c).. In addition, we selected, for higher accuracy, only stellar parameters obtained from spectra with a Signal-to-Noise ratio (S/N) higher than 20.

3 Characterisation of the metal-rich population
3.1 Identification of the strength of the signal
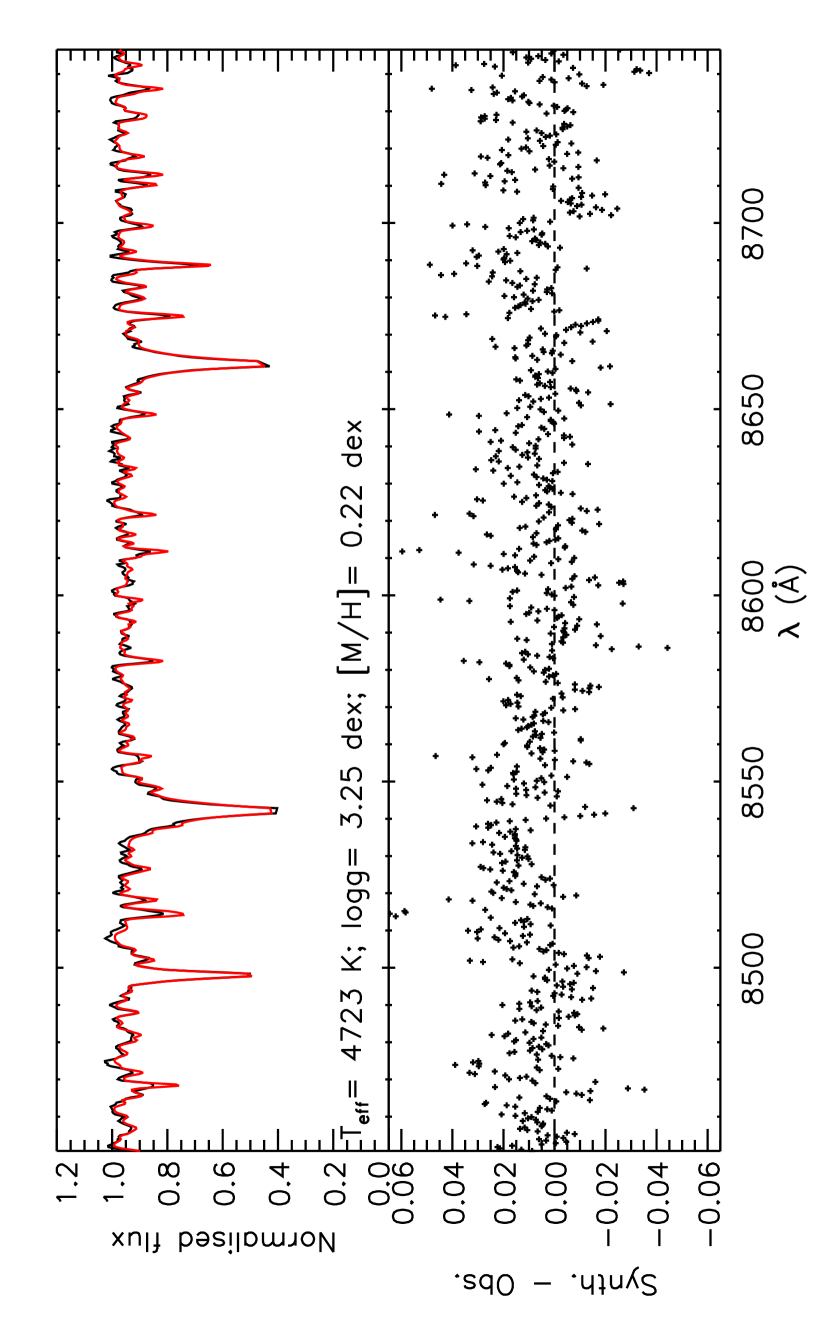
Figure 1 shows the distributions of the DR4 metallicity (black points) and iron (green points) abundances for the selected quality sample; the red points show the distribution obtained with the new calibration (DR5). One can see the effect of the new DR5 calibration for the super-Solar metallicity stars: they are now in better agreement with [Fe/H] in the shape of the tail of the distribution. In particular, one can notice that the selected RAVE quality subsample has more than stars with . A visual inspection of the fit of the synthetic templates to the observed spectra confirmed that the results were in good agreement with the data (Fig. 3), and that within the errors we could trust the derived parameters (see Kordopatis et al., 2013a, for a discussion on the internal errors of the method). These targets, all of which have , are located relatively close to the Sun (, Fig. 4), and are mainly located near the Galactic plane, with nevertheless, some stars seen up to .
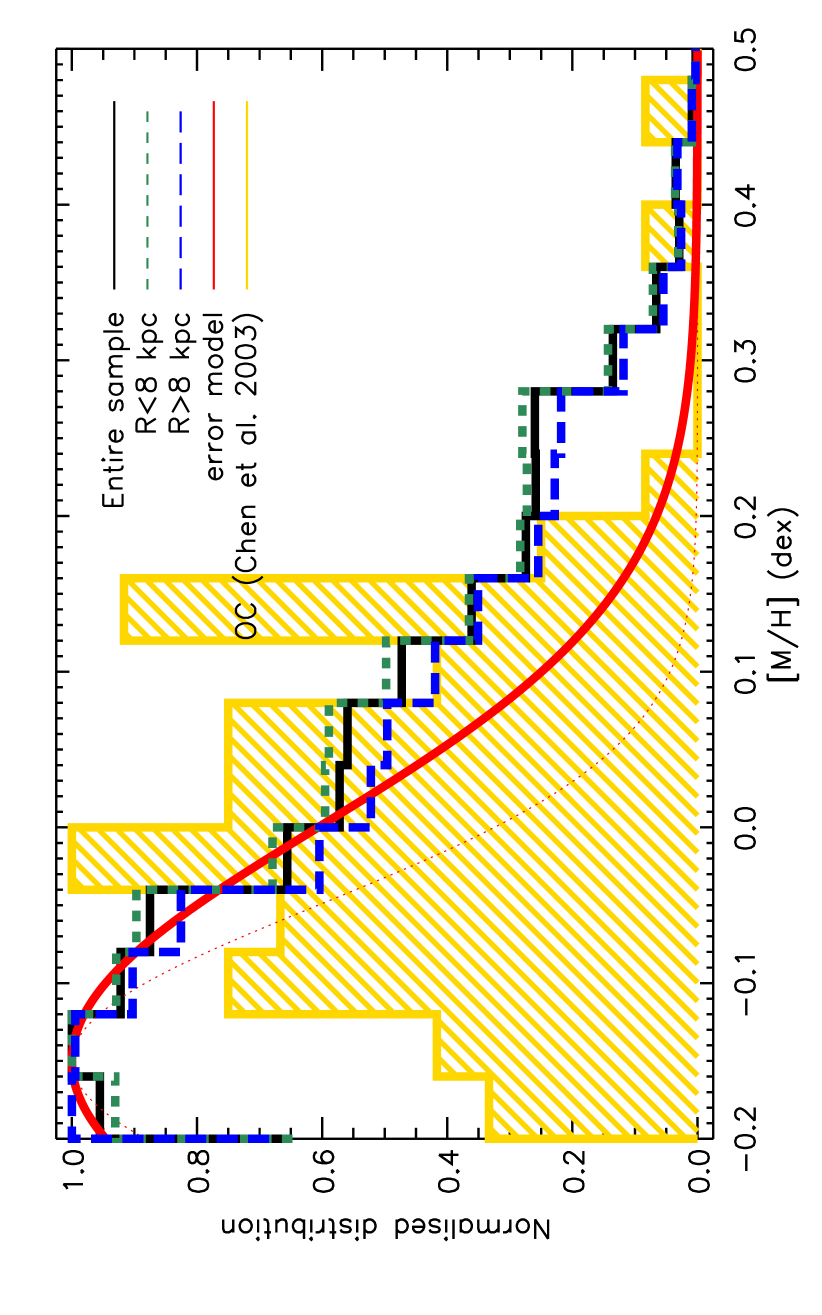
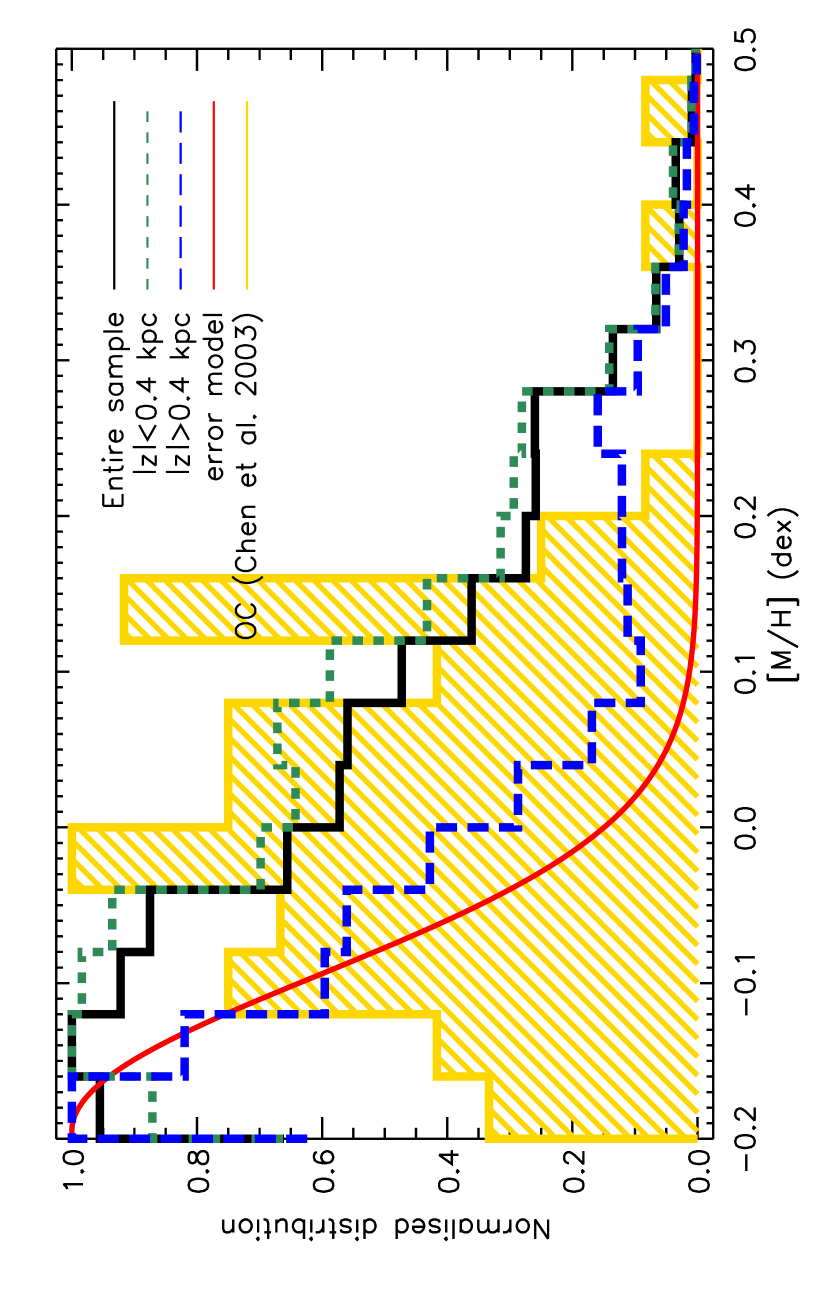
Figure 5 shows that the metallicity distribution function has roughly the same shape in the inner () and outer () Galaxy, although the inner Galaxy is marginally more metal-rich. However, we now ask to what extent the number of stars measured to be metal-rich is boosted by stars scattered by observational error from the sub-solar peak of the metallicity distribution (, see Fig. 1). Suppose the uncertainty of the sub-Solar metallicity stars follows a Gaussian distribution, of standard deviation , as suggested in Tables 1 and 2 of Kordopatis et al. (2013a). Then the red dotted Gaussian of Fig. 5 indicates that only a small fraction of the stars with measured would be generated by accidental scattering of sub-solar stars. Indeed, the number of stars seen at cannot be explained by accidental scattering even when the errors are over-estimated by 50% by setting (red solid Gaussian in Fig. 5).
To further assess the plausibility of metal-rich stars really existing, in Fig. 5 we compare our [M/H] distribution with the [Fe/H] distribution of the 82 open clusters published in Chen et al. (2003) that have Galactocentric radii in the range probed by RAVE (, yellow histogram). The metallicity distribution of the clusters is narrower than that of the stars, having its principal peak at rather than , and, with the exception of two outliers, falling to zero at . The paucity of clusters with is a natural consequence of the monotonic increase with time in the ISM’s metallicity and the youth of clusters – the clusters are in the majority younger than (Chen et al., 2003) whereas the RAVE metal-rich stars should be a few billion years old given the typical age () of Solar-metallicity field stars. The presence of old field stars more metal-rich than any but the two outlying clusters would be hard to explain in the absence of radial migration because the cluster distribution implies that even now, and more so in the past, in the probed radial range the gas is too metal-poor to form these stars.
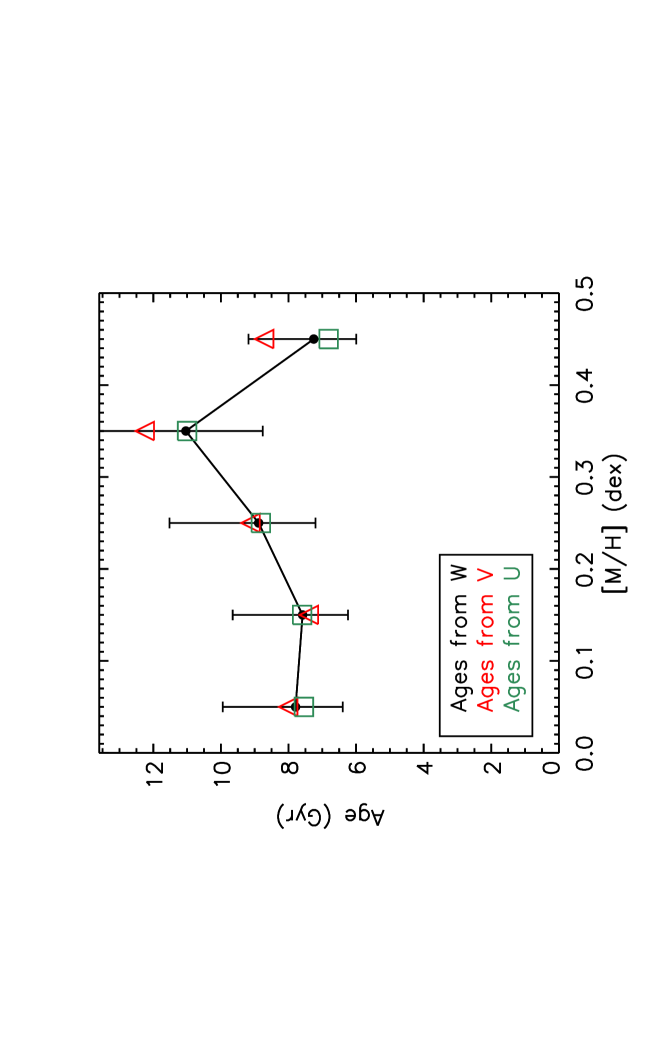
We obtained a rough estimation of the age of the RAVE stars by applying, for different metallicity bins, the age–velocity dispersion relation defined for the heliocentric velocities as:
| (4) |
where is the velocity dispersion ( or ), is the local normalisation factor, set in order to be equal to the velocity dispersion of old stars, and is is power-law exponent defining the age-velocity dispersion law. By adopting the values (Robin et al., 2003) and (Nordström et al., 2004), we confirm the previous statement that the metal-rich stars in our sample are on average old (see Fig. 6), with approximate ages . We note that the age uncertainties are expected to be larger, as they depend on the values adopted for the parameters and in equation (4) (see Table 8 of Sharma et al., 2014, for a review of the possible values of ). Our argument is simply that if the stars under study were young, their velocity dispersions would be significantly smaller than they actually are.
3.2 Identification of the radially migrated stars
As division of the sample by Galactocentric radius did not reveal any significant difference in the shape of the metallicity distribution functions, in Fig. 7 we split our sample into closer and farther than from the plane333Other threshold values have been tested, up to in order to have enough stars in each sub-sample, without changing our conclusions. (note that given the RAVE footprint on the sky, stars far from the plane are preferentially located towards the inner Galaxy, see Fig. 4 and Kordopatis et al., 2013a).
The metallicity distributions of Fig. 7 indicate that an uncertainty of in metallicity, as assumed above, is indeed an over-estimation of the internal errors, since the high-altitude sample (blue broken curve) shows a narrower distribution in [M/H]. As discussed in the previous section, an uncertainty of to is more realistic.
Whereas the metallicity distribution of stars near the plane (green histogram) falls smoothly from a peak at to near zero at , that of stars farther than from the plane (blue histogram) falls smoothly from a peak at to a local minimum at and then flattens to a very extensive tail. The tail rises to a peak around and then gradually fades. From the tail comprises the SMR stars.
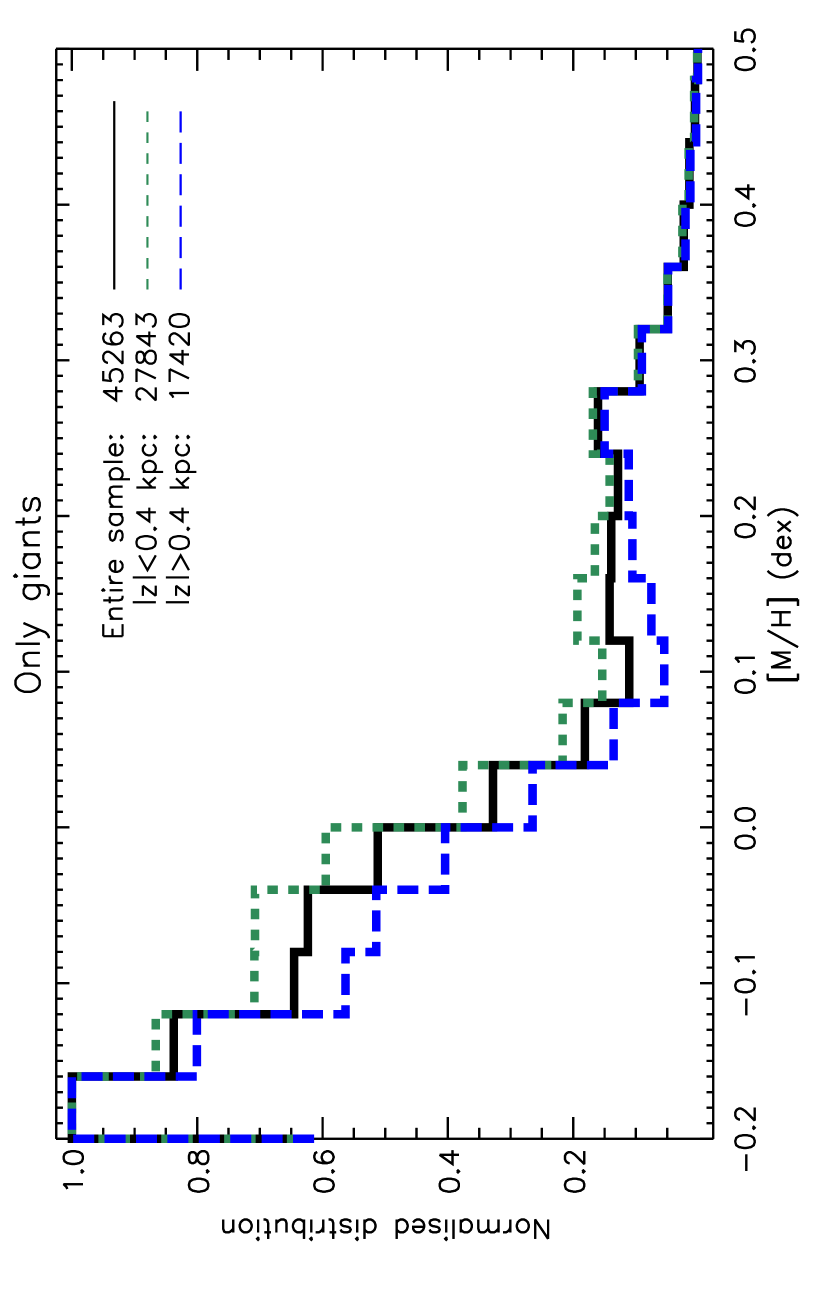
In Fig. 8 the histograms show the metallicity distributions of just the giants (): the green histogram is for those that lie closer than to the plane, the blue histogram for those further than from the plane and the black histogram is for the joint sample. The blue histogram differs little from that shown in Fig. 7 because all the contributing stars are quite distant and are unlikely to make the magnitude cut if they are not giants. But the sample of stars that are close to the plane is substantially modified by restricting the sample to giants, and we see that the metallicity distribution of the giants is essentially the same near and far from the plane. That is, in Fig. 7 the difference between the blue and black histograms is attributable by the contribution of the dwarfs. Many of the dwarfs are younger than the giants,444Only few young giants are expected to be present in our selection, due to their relatively short lifetime in that evolutionary phase. so they tend to be more metal-rich. Figure 8 reveals that the metallicity distribution of the in-plane giants has a long tail to match that of the giants that are further away. Of course this is physically essential because most of the giants that are currently near the plane will in be far from it, and vice versa.
The key finding is that the (near-plane) dwarfs do not contribute significantly above even though they are typically younger. If these SMR stars formed near us, we would expect them to have formed recently and include RAVE dwarfs. This is clearly not the case, at least for .
The natural explanation of the tail is that it is made up of stars that have migrated to us from smaller radii, where high metallicities were achieved very early on (e.g., Fig. 3 of Minchev et al., 2013a). The distance that the stars on the metal-rich end of the tail need to have travelled to match the observations, depends on the rate at which the disc enriched its metallicity at each radius over time (see for example Wyse & Silk, 1989; Chiappini et al., 1997). The likelihood of an individual star reaching the Solar neighbourhood decreases with distance to travel. However, the exponential rise inwards in the number of stars available to make the journey will to an extent compensate for the decreasing probability of coming far, with the result that the number in the tail decreases remarkably slowly with increasing [M/H]. Future work will include developing such a model and investigating its plausibility in the light of the results of this study.
3.3 Orbits of metal-rich stars
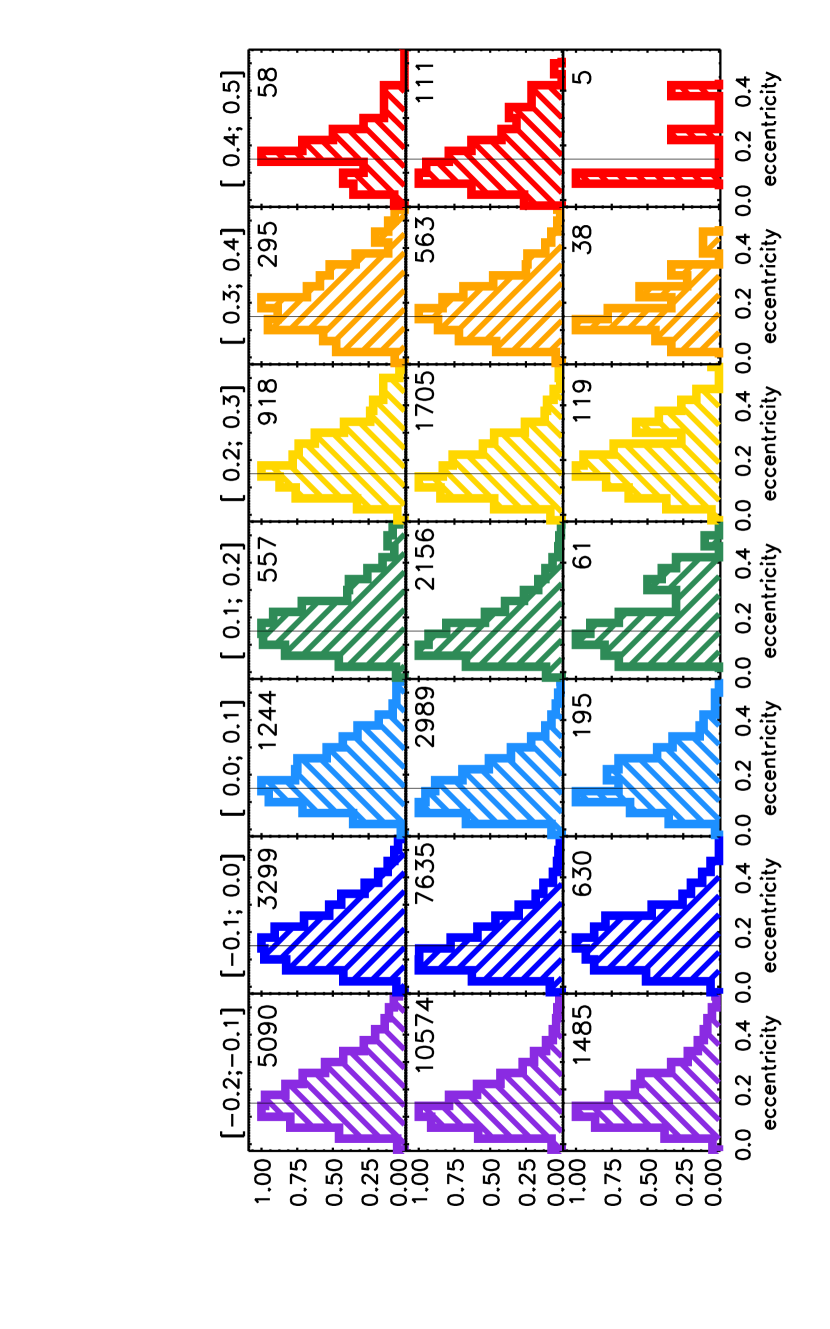
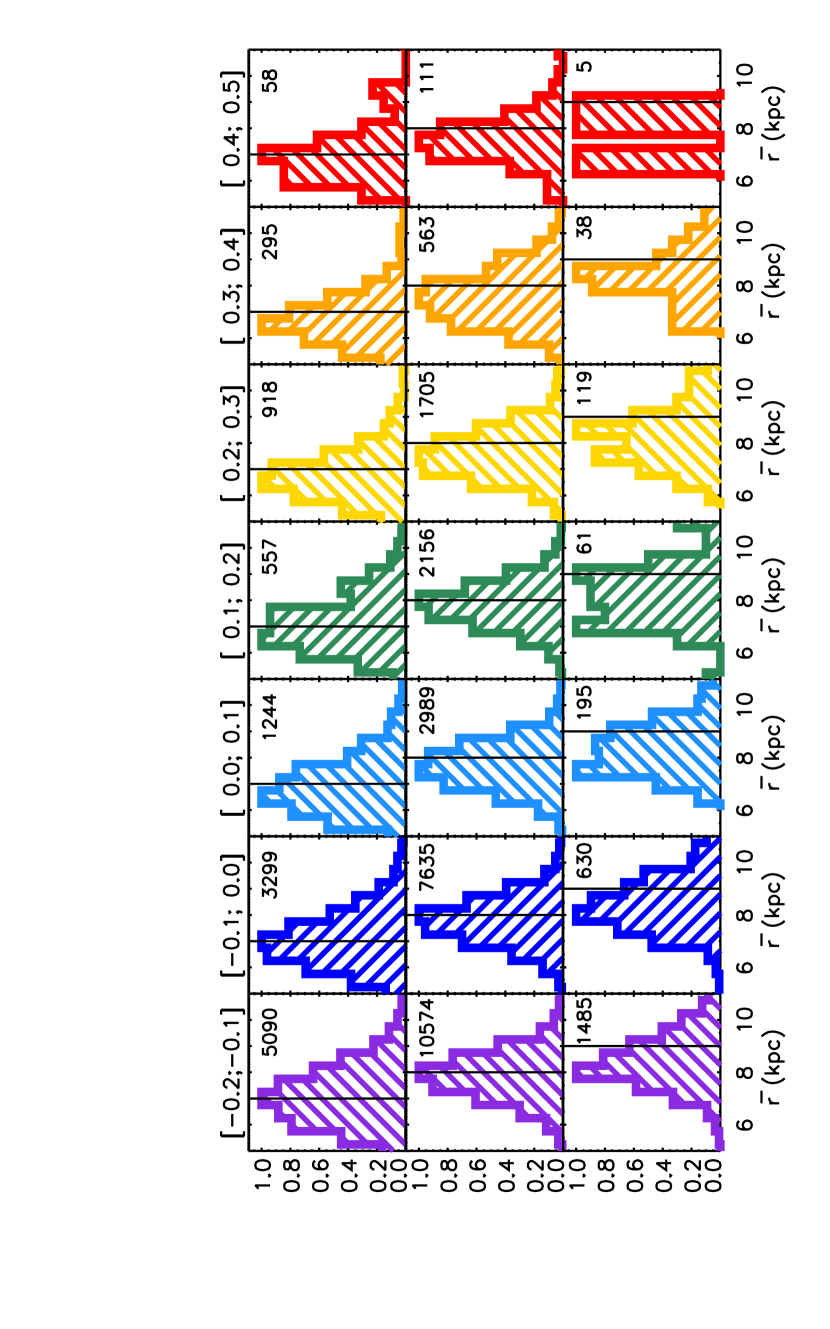
We now examine the orbits of the metal-rich stars. Figure 9 and Table 2 illustrate and quantify the shape of the eccentricity distribution of the stars for three different distance ranges from the Galactic centre and for different metallicity bins, starting from . Figure 10 shows the mean orbital radii for the same stars. From these two figures, one can see that:
-
•
most of the stars have eccentricities below , with a peak at around indicating, as expected for thin disc targets, that the stars are on nearly circular orbits.
-
•
No systematic variation is evident of the eccentricity distribution with metallicity. In particular, SMR stars are not more likely that low-metallicity stars to be on eccentric orbits.
-
•
There is a slight tendency for stars to be observed nearer apocentre than pericentre (). This bias towards apocentre may increase slightly with metallicity, but the effect is at best weak. Given that the density of stars decreases exponentially with guiding-centre radius, it is inevitable that when we focus on nearby stars with large eccentricities, stars with small guiding centres outnumber stars with large guiding centres, so the majority of stars with high eccentricities will be seen nearer apocentre than pericentre. Indeed most of the solar-neighbourhood stars with prove to have mean orbital radii . Thus “blurring” by eccentric orbits that have been populated by scattering at Lindblad resonances plays a significant role in bringing these stars to us. We will see, however, that the mean radii of these stars are too large to be their birth radii: even these stars have increased their angular momenta since birth.
| Metallicity range () | |||||||
|---|---|---|---|---|---|---|---|
| Metallicity range () | ||||||||
|---|---|---|---|---|---|---|---|---|
Based on the values presented in Table 2 and illustrated in Fig. 9, the central row of Table 3 gives for different metallicity bins the proportion of giant stars of a given metallicity in the Solar neighbourhood that are on nearly circular orbits (). This ratio proves to be roughly constant, of the order of 0.51. This is in agreement with Lee et al. (2011), who found that the thin disc stars have eccentricities that are independent of metallicity. In particular, we find that super-solar metallicity stars are not distributed differently in either eccentricity and or mean orbital radius from the stars of lower metallicity.
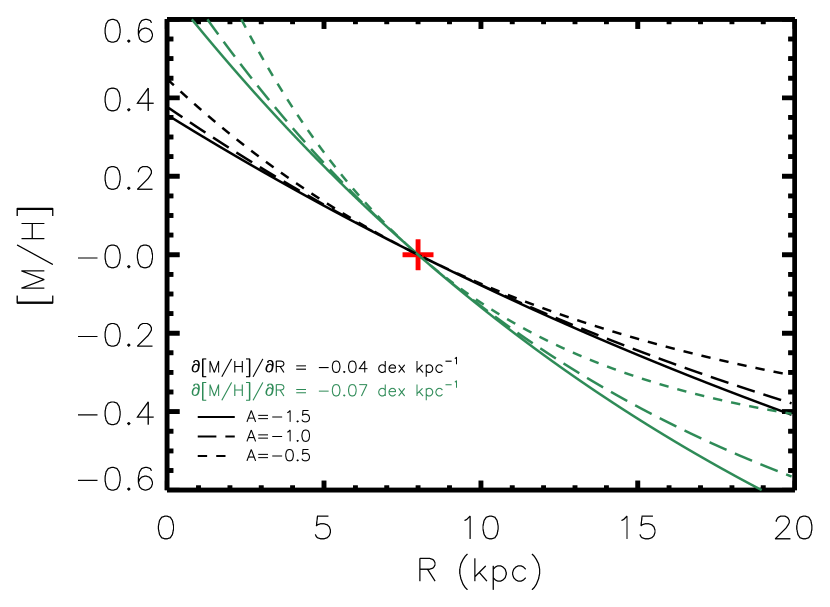
Taking into account (i) that super-solar metallicity stars are more metal-rich than the local ISM, (ii) that they are not a young population and (iii) that they are on nearly circular orbits, we can infer that these stars have increased their angular momenta through resonant scattering at CR. A quantitative theoretical estimate of the probable birth radii of solar vicinity stars with is given by Minchev et al. (2013a, 2014b). According to their simulations these SMR stars would originate from the galactocentric region and would be at most old. From the observational point of view, we can say that the present abundance gradient in the ISM, according to the most precise estimates based on Cepheids (e.g. Genovali et al., 2014), is around . Although it is very unlikely that the gradient remained constant in the last , this would imply that could be reached already at from the Galactic centre under the assumption of a linear gradient.
Figure 11 represents an illustration of the possible birth radii of any metallicity star, for two local metallicity gradients in the ISM, considering the extreme case in which [M/H] increases exponentially inwards with a scale length :
| (5) |
The constant in this formula is the value to which [M/H] tends at large radii, and together with the value of local metallicity gas gradient, sets the value of . Regardless of the adopted value of , the shallowness of the local metallicity gradient in the ISM always implies for stars as metal-rich as
The first and third rows of, Table 3 give for the cylindrical shell inside and outside the solar cylinder, respectively. In these shells RAVE does not see stars that lie close to the plane (Fig. 4), so only warmer populations are sampled. Hence it is no surprise that in these shells we find smaller values of than in the solar cylinder: in the inner shell we have while in the outer shell we have . However, the measured ratios still show no statistically significant variation over the entire investigated metallicity range (see Figs. 9,10). Below we discuss how the lack of dependence of on [Fe/H], even well off the plane can put constraints in the Galaxy’s spiral history.
The gravitational field of a spiral structure that has radial wavenumber varies with as (e.g. Binney & Tremaine, 2008, §6.1.5), so the capacity of a wave to force stars does not extend further than from the plane. Among the recent literature, disc simulations of spirals with different radial wavenumbers resulted to different observational predictions on radial migration. For example, the disc simulations of Solway et al. (2012) were seeded with spiral arms through the groove mechanism of Sellwood & Kahn (1991) and in these simulations the extent of radial migration decreased only slowly with the amplitude of vertical excursions, and was “almost as large for thick-disc stars as for those in the thin disc”. On the other hand, in the simulations of Vera-Ciro et al. (2014) the spirals were seeded by point masses in the disc intended to represent giant molecular clouds, and it was found, by contrast, that migrated stars were “a heavily biased subset of stars with preferentially low vertical velocity dispersions”. This finding reflects the short-wavelength, filamentary nature of the spiral structure in the discs of Vera-Ciro et al. (2014, see their Fig. 2), which strongly confines the gravitational field to the equatorial plane.
The lack of dependence of that we measure in our Galaxy implies that the responsible spiral structure has longer radial scales than that discussed by Vera-Ciro et al. (2014). This is consistent with K-band photometry of nearby face-on spiral galaxies that shows that the mass-bearing populations of these galaxies are organised into loosely-wound spirals (Rix & Zaritsky, 1995, Plate 1). A spiral structure, possibly groove driven like our results suggest, is also in agreement with Sellwood & Carlberg (2014) that have argued that the groove mechanism is fundamental to the development of large-amplitude spiral structure in discs that contain only stars and are stable at the level of linear perturbation theory.
4 Discussion and Conclusions
A recalibration of the metallicities of stars in the RAVE survey leads to a significant increase in the number of stars with and brings the metallicity distribution of the entire RAVE sample into closer agreement with that of the DR4 chemical pipeline. In fact the two distributions are now in good agreement for .
Currently the inter-stellar medium (ISM) has metallicity near the Sun, and its metallicity increases towards the Galactic centre, the local gas gradient being of the order of (e.g. Smartt & Rolleston, 1997; Balser et al., 2011; Genovali et al., 2014). In the absence of large amounts of metal-poor gas being accreted, the natural expectation for gas metallicity at a given radius is to be a monotonic increasing function of time, so current metallicities give upper limits on metallicities at all previous times (e.g. Chiappini, 2009). If these propositions are accepted and one grants that the metallicity of a star reflects the metallicity of the ISM at the time and place of its formation, it follows that super metal-rich (SMR) stars with must have formed far inside , probably in the region now occupied by the bar/bulge.
Indeed, the alternative scenario of these stars forming in situ nearer the Sun, from a turbulent ISM that has reached at early times seems unlikely, because turbulence extensive enough to mix gas from the inner galaxy to (where the stellar metallicity gradient measured for example by the APOGEE survey becomes flatter) requires clouds to be on significantly non-circular orbits, and in such clouds few stars would be born onto the near-circular orbits on which we observe many SMR stars. Moreover, realistic turbulent discs as seen in external galaxies at (Epinat et al., 2012; Tacconi et al., 2013) are too short lived (e.g. Genzel et al., 2008; Bournaud et al., 2009) to allow enriched inner galactic ISM to reach outer galactic regions.
We have shown that SMR stars are not on particularly eccentric orbits. It follows that they have materially increased their angular momenta through resonant scattering by spiral arms (Sellwood & Binney, 2002), and most no longer visit the region of their birth. Angular momentum can be increased at either corotation resonance (CR) or outer Lindblad resonance (OLR) and the key distinction between these resonances is that at OLR eccentricity increases, while at CR it does not. Since the SMR stars have experienced large angular momentum increases without large increases in eccentricity, it follows that the dominant process bringing them to us is scattering at CR, i.e., churning.
We have shown that the vertical distribution of the higher-metallicity stars is not unusual. In fact, as far as we can determine, the spatial distribution of these stars is independent of metallicity. The natural interpretation of this finding is that the probability for radial migration is insensitive to the extent of a star’s excursions perpendicular to the plane. This interpretation is consistent with the dynamical study of Solway et al. (2012), who showed an example of a disc seeded with spiral structure through the groove mechanism of Sellwood & Kahn (1991) where migration probability is almost as large for thick-disc stars as for those in the thin disc. Our interpretation of the data implies that the radial wavelength of spiral structure is no smaller than the thick disc’s scale height, which is not the case in the experiments of Vera-Ciro et al. (2014) who used a simulation with multi-armed recurrent spirals and showed that churning is far more efficient for stars with low vertical velocity dispersion.
Finally, we note that rather than radial migration, the SMR stars could be evidence of inhomogeneous chemical evolution within the Galactic disc on account of the Galactic fountain (e.g.: Marasco et al., 2013, and references therein,) bringing metal-rich ejecta from an interior region of the disc to somewhere in the solar annulus and there giving rise to metal-rich star formation (Spitoni et al., 2009). However, this scenario seems implausible because (i) the ratio of stars on nearly circular and eccentric orbits is independent of metallicity, and (ii) high-velocity clouds, which may be associated with the Galactic fountain, have low metallicities (Wakker, 2001). However, only a few hundred high-resolution spectra of SMR stars should be enough to identify their chemical abundance patterns and test this possibility. Large and high-resolution surveys such as Gaia-ESO (Gilmore et al., 2012) or APOGEE (Allende Prieto et al., 2008) could, perhaps, already provide some answers to the above questions.
Acknowledgments
The anonymous referee is greatly thanked for the useful comments and suggestions that helped improving the quality of this paper. Funding for RAVE has been provided by: the Australian Astronomical Observatory; the Leibniz-Institut für Astrophysik Potsdam (AIP); the Australian National University; the Australian Research Council; the French National Research Agency; the German Research Foundation (SPP 1177 and SFB 881); the European Research Council (ERC-StG 240271 Galactica); the Instituto Nazionale di Astrofisica at Padova; The Johns Hopkins University; the National Science Foundation of the USA (AST-0908326); the W. M. Keck foundation; the Macquarie University; the Netherlands Research School for Astronomy; the Natural Sciences and Engineering Research Council of Canada; the Slovenian Research Agency; the Swiss National Science Foundation; the Science & Technology Facilities Council of the UK; Opticon; Strasbourg Observatory; and the Universities of Groningen, Heidelberg and Sydney. RFGW acknowledges support of NSF Grant OIA-1124403 and thanks the Aspen Center for Physics and NSF Grant #1066293 for hospitality during the writing of this paper. The research leading to these results has received funding from the European Research Council under the European Union’s Seventh Framework Programme (FP7/2007-2013)/ERC grant agreement no. 321067. The RAVE web site is at http://www.rave-survey.org.
References
- Adibekyan et al. (2013) Adibekyan V. Z. et al., 2013, A&A, 554, A44
- Allende Prieto et al. (2008) Allende Prieto C. et al., 2008, Astronomische Nachrichten, 329, 1018
- Balser et al. (2011) Balser D. S., Rood R. T., Bania T. M., Anderson L. D., 2011, ApJ, 738, 27
- Bergemann et al. (2014) Bergemann M. et al., 2014, A&A, 565, A89
- Binney (2013a) Binney J., 2013a, New Astron. Rev., 57, 29
- Binney (2012b) Binney J., 2012b, MNRAS, 426, 1324
- Binney & Tremaine (2008) Binney J., Tremaine S., 2008, Galactic Dynamics: Second Edition. Princeton University Press
- Binney et al. (2014) Binney J. et al., 2014, MNRAS, 437, 351
- Boeche et al. (2013a) Boeche C. et al., 2013a, A&A, 553, A19
- Boeche et al. (2013b) Boeche C. et al., 2013b, A&A, 559, A59
- Bournaud et al. (2009) Bournaud F., Elmegreen B. G., Martig M., 2009, ApJL, 707, L1
- Cartledge et al. (2006) Cartledge S. I. B., Lauroesch J. T., Meyer D. M., Sofia U. J., 2006, ApJ, 641, 327
- Chen et al. (2003) Chen L., Hou J. L., Wang J. J., 2003, AJ, 125, 1397
- Chiappini (2009) Chiappini C., 2009, in Andersen J., Nordström B., Bland-Hawthorn J., eds, IAU Symposium Vol. 254, IAU Symposium. pp 191–196, doi:10.1017/S1743921308027580
- Chiappini et al. (1997) Chiappini C., Matteucci F., Gratton R., 1997, ApJ, 477, 765
- Conrad et al. (2014) Conrad C. et al., 2014, A&A, 562, A54
- Dehnen & Binney (1998) Dehnen W., Binney J., 1998, MNRAS, 294, 429
- Edvardsson et al. (1993) Edvardsson B., Andersen J., Gustafsson B., Lambert D. L., Nissen P. E., Tomkin J., 1993, A&A, 275, 101
- Eggen et al. (1962) Eggen O. J., Lynden-Bell D., Sandage A. R., 1962, ApJ, 136, 748
- Epinat et al. (2012) Epinat B. et al., 2012, A&A, 539, A92
- Freeman & Bland-Hawthorn (2002) Freeman K., Bland-Hawthorn J., 2002, ARA&A, 40, 487
- Gazzano et al. (2013) Gazzano J.-C., Kordopatis G., Deleuil M., et al 2013, A&A, 550, A125
- Genovali et al. (2014) Genovali K. et al., 2014, A&A, 566, A37
- Genzel et al. (2008) Genzel R. et al., 2008, ApJ, 687, 59
- Gilmore et al. (2012) Gilmore G. et al., 2012, The Messenger, 147, 25
- Grenon (1989a) Grenon M., 1989a, Ap&SS, 156, 29
- Grenon (1999b) Grenon M., 1999b, Ap&SS, 265, 331
- Hayden et al. (2014) Hayden M. R. et al., 2014, AJ, 147, 116
- Haywood (2008) Haywood M., 2008, MNRAS, 388, 1175
- Hill et al. (2011) Hill V. et al., 2011, A&A, 534, A80
- Jofré et al. (2014) Jofré P. et al., 2014, A&A, 564, A133
- Kordopatis (2014) Kordopatis G., 2014, in Ballet J., Martins F., Bournaud F., Monier R., Reylé C., eds, SF2A-2014: Proceedings of the Annual meeting of the French Society of Astronomy and Astrophysics. pp 431–435, arXiv:1410.4254
- Kordopatis et al. (2013a) Kordopatis G. et al., 2013a, AJ, 146, 134
- Kordopatis et al. (2013b) Kordopatis G. et al., 2013b, MNRAS, 436, 3231
- Kordopatis et al. (2011c) Kordopatis G., Recio-Blanco A., de Laverny P., Bijaoui A., Hill V., Gilmore G., Wyse R. F. G., Ordenovic C., 2011c, A&A, 535, A106
- Lee et al. (2011) Lee Y. S. et al., 2011, ApJ, 738, 187
- Lynden-Bell & Kalnajs (1972) Lynden-Bell D., Kalnajs A. J., 1972, MNRAS, 157, 1
- Marasco et al. (2013) Marasco A., Marinacci F., Fraternali F., 2013, MNRAS, 433, 1634
- Matteucci (2003) Matteucci F., 2003, The Chemical Evolution of the Galaxy
- Matteucci & Francois (1989) Matteucci F., Francois P., 1989, MNRAS, 239, 885
- Minchev et al. (2013a) Minchev I., Chiappini C., Martig M., 2013a, A&A, 558, A9
- Minchev et al. (2014b) Minchev I., Chiappini C., Martig M., 2014b, A&A, 572, A92
- Minchev et al. (2014c) Minchev I. et al., 2014c, ApJL, 781, L20
- Nieva & Przybilla (2012) Nieva M.-F., Przybilla N., 2012, A&A, 539, A143
- Nordström et al. (2004) Nordström B. et al., 2004, A&A, 418, 989
- Pagel (1997) Pagel B. E. J., 1997, Nucleosynthesis and Chemical Evolution of Galaxies
- Pagel & Patchett (1975) Pagel B. E. J., Patchett B. E., 1975, MNRAS, 172, 13
- Radburn-Smith et al. (2012) Radburn-Smith D. J. et al., 2012, ApJ, 753, 138
- Rix & Zaritsky (1995) Rix H.-W., Zaritsky D., 1995, ApJ, 447, 82
- Robin et al. (2003) Robin A. C., Reylé C., Derrière S., Picaud S., 2003, A&A, 409, 523
- Roškar et al. (2008) Roškar R., Debattista V. P., Quinn T. R., Stinson G. S., Wadsley J., 2008, ApJL, 684, L79
- Schönrich et al. (2010) Schönrich R., Binney J., Dehnen W., 2010, MNRAS, 403, 1829
- Sellwood (2014) Sellwood J. A., 2014, Reviews of Modern Physics, 86, 1
- Sellwood & Binney (2002) Sellwood J. A., Binney J. J., 2002, MNRAS, 336, 785
- Sellwood & Carlberg (2014) Sellwood J. A., Carlberg R. G., 2014, ApJ, 785, 137
- Sellwood & Kahn (1991) Sellwood J. A., Kahn F. D., 1991, MNRAS, 250, 278
- Sharma et al. (2014) Sharma S. et al., 2014, ApJ, 793, 51
- Siebert et al. (2011) Siebert A. et al., 2011, AJ, 141, 187
- Smartt & Rolleston (1997) Smartt S. J., Rolleston W. R. J., 1997, ApJL, 481, L47
- Solway et al. (2012) Solway M., Sellwood J. A., Schönrich R., 2012, MNRAS, 422, 1363
- Spitoni et al. (2009) Spitoni E., Matteucci F., Recchi S., Cescutti G., Pipino A., 2009, A&A, 504, 87
- Spitzer & Schwarzschild (1953) Spitzer Jr. L., Schwarzschild M., 1953, ApJ, 118, 106
- Springel et al. (2006) Springel V., Frenk C. S., White S. D. M., 2006, Nature, 440, 1137
- Steinmetz et al. (2006) Steinmetz M. et al., 2006, AJ, 132, 1645
- Tacconi et al. (2013) Tacconi L. J. et al., 2013, ApJ, 768, 74
- Vera-Ciro et al. (2014) Vera-Ciro C., D’Onghia E., Navarro J., Abadi M., 2014, ApJ, 794, 173
- Wakker (2001) Wakker B. P., 2001, ApJS, 136, 463
- Whitford & Rich (1983) Whitford A. E., Rich R. M., 1983, ApJ, 274, 723
- Worley et al. (2012) Worley C. C., de Laverny P., Recio-Blanco A., Hill V., Bijaoui A., Ordenovic C., 2012, A&A, 542, A48
- Wyse & Silk (1989) Wyse R. F. G., Silk J., 1989, ApJ, 339, 700
- Yanny et al. (2009) Yanny B. et al., 2009, AJ, 137, 4377
- Yoachim et al. (2012) Yoachim P., Roškar R., Debattista V. P., 2012, ApJ, 752, 97
- Yoshii (1981) Yoshii Y., 1981, A&A, 97, 280
- Zwitter et al. (2008) Zwitter T. et al., 2008, AJ, 136, 421