11email: fabricio@utfpr.edu.br
Feature extraction from complex networks: A case of study in genomic sequences classification
Abstract
This work presents a new approach for classification of genomic sequences from measurements of complex networks and information theory. For this, it is considered the nucleotides, dinucleotides and trinucleotides of a genomic sequence. For each of them, the entropy, sum entropy and maximum entropy values are calculated. For each of them is also generated a network, in which the nodes are the nucleotides, dinucleotides or trinucleotides and its edges are estimated by observing the respective adjacency among them in the genomic sequence. In this way, it is generated three networks, for which measures of complex networks are extracted. These measures together with measures of information theory comprise a feature vector representing a genomic sequence. Thus, the feature vector is used for classification by methods such as SVM, MultiLayer Perceptron, J48, IBK, Naive Bayes and Random Forest in order to evaluate the proposed approach. It was adopted coding sequences, intergenic sequences and TSS (Transcriptional Starter Sites) as datasets, for which the better results were obtained by the Random Forest with 91.2%, followed by J48 with 89.1% and SVM with 84.8% of accuracy. These results indicate that the new approach of feature extraction has its value, reaching good levels of classification even considering only the genomic sequences, i.e., no other a priori knowledge about them is considered.
1 Introduction
The study of biological systems and how its components are interconnected is a great challenge nowadays, attracting the attention of researchers from various fields of knowledge. This new scientific research area is known as systems biology and it is highly interdisciplinary. The main focus is to analyze the organism in a holistic way.
The complex networks theory has been successfully applied in systems biology for modeling interactions between cellular components [1, 2, 3, 4], proteins [5, 6] and metabolic relationships [7]. Most often, the study of a interconnected components subset is more important than the individual analysis of them, which leads to a suitable application of complex networks in biology. As suggested by [8], the p53 gene is a tumor suppressor, however it is more important to analyze its connections than studying it individually.
Through complex networks it is possible to extract measures that represent characteristics in natural and artificial systems composed of interacting parts. However, despite the great success obtained by the complex network theory, there is still a huge field of research to be explored due to some limitations such as the lack of measures and methods to analyze, characterize and classify real networks. Therefore, to obtain a more precise characterization, it is essential to consider a broad set of non-redundant measurements, which can be achieved with the use of pattern recognition techniques and data mining [9]. On the other hand, the information theory is also an important measure generally used for indicate the amount of information of a given source, it was successfully applied in a myriad of bioinformatics problems in order to characterize the relationships among genes [10, 11, 12, 13].
In the context of pattern recognition, the feature extraction is a form of dimensionality reduction [14]. More specifically, in a reductionist point of view, a feature extraction method attempts to represent a sample for a relatively small subset of features, while minimizing the loss of information from this sample. As a result, if the feature extractor succeeds, the extracted features could be suitable to distinguish the samples even when considered samples belonging to different categories or classes.
Therefore, it is proposed in this work a new feature extraction approach for genomic sequences from complex networks and information theory. The extracted measures are used in some classification methods in order to demonstrate the accuracy of prediction with different DNA regions. Among the adopted sequences in this work, should be highlighted the TSS dataset, due to the difficulty to recognize them in the genomes of different species, which many other researches demonstrate techniques for predicting these regions, such as [15, 16, 17].
The next sections of this paper present in more detail the proposed approach for feature extraction from genomic sequences, the adopted genomic sequences datasets, the results and the conclusions.
2 Background
2.1 Complex Networks
Considered an extension of graph theory, the complex networks is defined as a graph which shows an irregular structure of nodes connected by edges [9]. The complex networks theory extends the formalism of graph theory by adding measures and methods based on real properties of a system [9]. This theory presents multidisciplinary applications, covering various sciences, such as biology, computer science, physics, mathematics and sociology, to cite but a few. Thus, many real-world systems can be represented by means of complex networks, such as the connection between airports [18], the Internet [19], Social groups [20], Neural Networks [21, 22] and biological systems [23, 24, 25, 26, 4, 3].
2.2 Complex Networks measurements
The complex networks models have different topologies and well-defined properties which can be used to represent biological systems and characterize them in terms of complex networks measures [9]. Among the possible measures to extract from a complex network, it were adopted the measures listed below.
-
1.
Average path length. The length of the shortest path between two nodes and , , is given by the the length of all paths connecting these nodes whose lengths are minimal [27]. Its determination is important to characterize the internal structure of the networks [28]. Given a distance matrix D, whose elements represent the value of the shortest path between nodes and . The average between the values expressed in matrix D is the lowest average path and it is defined as:
(1) -
2.
Clustering coefficient. The clustering coefficient also known as transitivity is a agglomerative measure which represents the probability of adjacent nodes for a given node being connected, such as in a social network can be represented as the probability between two friends (A and B) have a friend (C) in common. Depending on the network topology, the value of transitivity can be different. Transitivity is defined by the following equation:
(2) -
3.
Centrality. In the context of complex networks theory, there are different kinds of centrality, such as:
-
•
Degree Centrality: is defined as the number of links incident on a given node. In the case of a directed networks is usual to define two separate measures of degree centrality: indegree e outdegree.
-
•
Proximity: is the natural distance between a node to all others, i.e., the more central the node is, the shorter the distance for all others.
-
•
Centrality of intermediation: is a measure that quantifies the number of times a node acts as an intermediary on a path between two nodes [29].
-
•
Efficiency Centrality: indicates the eccentricity of a node over another, i.e., indicates the fastest way to connect with another node, where the smaller its most efficient eccentricity is the node.
-
•
-
4.
Average Degree. The average grade is the arithmetic average of the network degrees, which can be obtained by dividing the number of edges by the number of nodes.
-
5.
Motifs. The motifs are subgraphs identified with great frequency within a complex network, which are directly related to the structure and evolution of a complex network [30].
-
6.
Number of communities. Most networks are often modular, i.e., the connections are more frequent between nodes belonging to the same group and less frequent between nodes of different groups [31].
2.3 Entropy and Mutual Information
The entropy has been defined in the context of information theory by Claude Shannon[32], where it indicate the amount of information contained in a particular source, but may also scale the disorder of a source of data.
The maximum entropy [33] is estimated from the probability distribution by considering its maximum point of uncertainty, in which the greater the amount of unreliable symbols and patterns in a given source, the greater the entropy of the whole, being defined as:
| (3) |
2.3.1 Sum and Maximization of Entropy.
Once the entropy measures the amount of information of a given source, the sum represents the steps for finding the maximum point of the information, given by the sum[33]:
| (4) |
and the maximization of entropy is defined by the given equation:
| (5) |
3 Materials and Methods
3.1 Genome Sequence Datasets
3.1.1 DBTSS.
The DataBase of Transcriptional Start Sites is a dataset that contains exact positions of transcriptional start sites (TSS), determined with the technique called tss-seq in the genomes of various species [34]. In this work, was adopted a subset containing 1500 promoter sequences randomly chosen. The dataset is available at ftp://ftp.hgc.jp/pub/hgc/db/dbtss/Yamashita_NAR/.
3.1.2 Genome Browser.
We extracted the protein coding sequences from a set of 1600 randomly selected RefSeq genes from the human genome (hg18). To obtain the protein coding sequences, the intronic region of each gene were removed and the coding segments were merged together. The sequence of the genes annotated in reverse strand were reverse complemented. Using the same genome we also randomly selected 1520 non-coding regions. We obtained the annotation of each gene and the hg18 from the UCSC Genome Browser database [35].
3.2 Feature Extraction Approach
For the proposed feature extraction were used two sources: complex networks measurements and information theory. The entropy extracts global features of each sequence, by contrast the complex networks measurements extracts local measures of the relationships between nucleotides of the genomic sequence.
3.2.1 Information Theory.
Given a FASTA file, the same processing is performed for each sequence was extracted the following measures: histogram, total entropy of the sequence, sum of entropy and maximum value of entropy (See sec. 2.3). For each sequence is considered the nucleotides, dinucleotides and trinucleotides nucleotides, thus, thus for each sequence are generated three feature vectors.
3.2.2 Complex Networks.
The number of networks is set in accordance with the parameters considered for the method. In the proposed approach the genomic sequences are used to build complex networks. The number of generated networks depends of the adopted parameters for the method execution. Whereas the nodes of the network are represented by occurrence of nucleotides/dinucleotides/trinucleotides within the sequence the following parameters are needed:
-
1.
Word Size (): is the number of characters that represent the nodes.
-
2.
Step (): is the number of characters that will be considered for walking in the sequence after read a word (node) to obtain a new word and constitution of the link between the nodes.
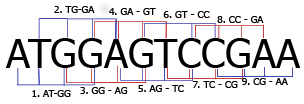
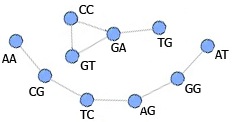
In order to better illustrate the proposed approach, an example considering a dinucleotides network, with the parameters e is presented in Figure 1. The connection between the nodes is done by considering a with the next word in the sequence by considering . Thus, by considering the genomic sequence ATGGAGTCCGAA, the obtained connections with the adopted parameters are presented in Figure 1(b).
By considering the possible of the parameters values WS = {1,2,3} and P = {1,2,3}, could be generated 6 nondirectional complex networks without any nucleotide is disregarded: nucleotides network (WS = 1; P = 1), dinucleotides network (WS = 2; P = 1) and (WS = 2; P = 2), trinucleotides (WS = 3; P = 1), (WS = 3; P = 2) and (WS = 3; P = 3). For each network was extract its complex networks measurements (See sec. 2.1) and some measures of descriptive statistics such as: standard deviation, maximum and minimum value of the nodes degree.
The generated feature vector for each genomic sequence is defined by the extracted features of the complex networks and the information theory measures.
4 Results and discussion
In order to evaluate the proposed feature extraction approach, it was adopted the feature extraction and classification from datasets presenting different DNA regions: Coding, Intergenic and hspromoter (See Sec. 3.1). It was adopted different classification methods such as Naive Bayes, IBK, MultiLayer Perceptron, SVM, J48 and Random Forest from WEKA machine learning software [36].
The results were obtained by adopting the Ten-Fold Cross-Validation, by using the default parameters for the adopted classification methods. Only for SVM, the parameter Kernel Type was changed from linear to radial. All the extracted features were considered in the classification task by all classifiers.
| Classification Method | Accuracy (%) |
|---|---|
| Random Forest | 91.2 |
| SVM | 84.8 |
| MultiLayer Perceptron | 64.5 |
| IBK | 79.9 |
| J48 | 89.1 |
| Naive Bayes | 72.6 |
Table 1 shows the rate of correct classification for each adopted classifier. It is possible to notice that the better results were achieved by the methods Random Forest and J48 with respectively 91.2% and 89.1%, indicating the potential value of this work by using only the genomic sequence itself.
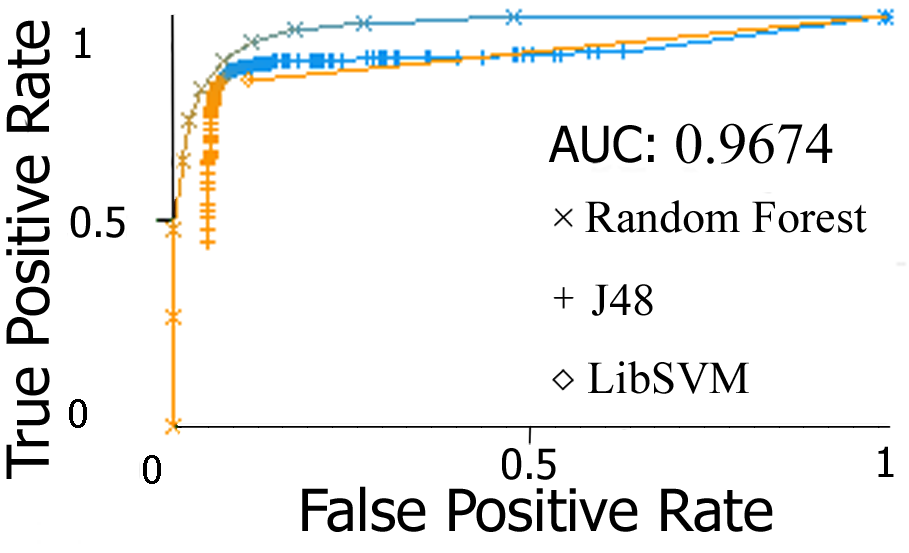
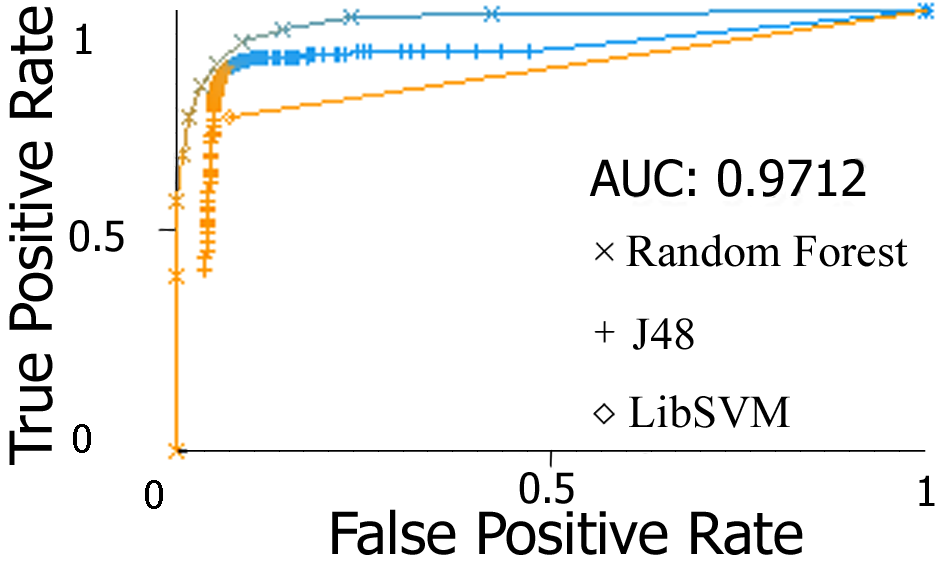
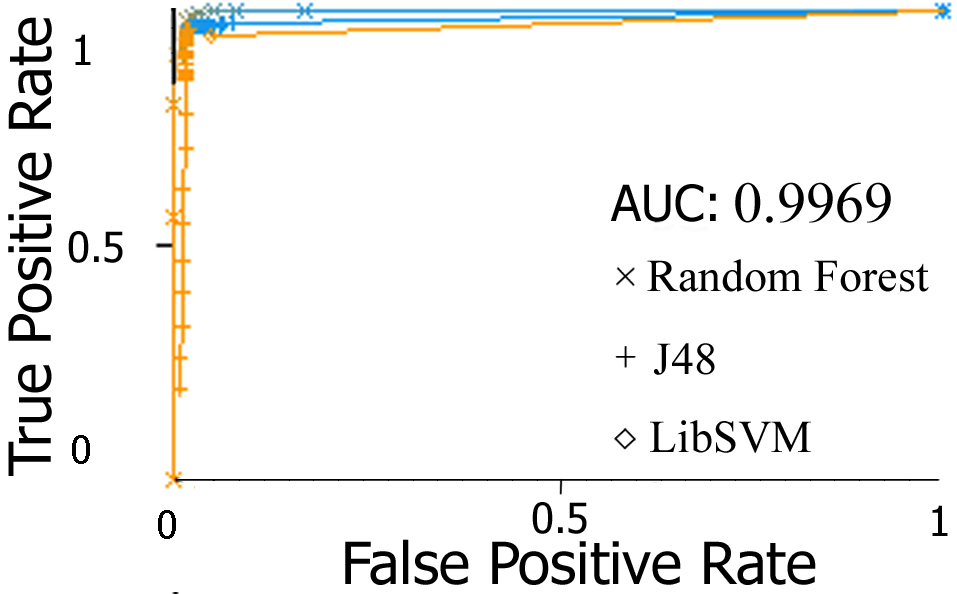
Figures 2 (a), (b) and (c), shows ROC curves for the adopted classifiers with better performance by considering the classes: Coding, Intergenic and hspromoter. It is possible to notice the effectiveness of the extracted features by the classification results of these three classifiers, indicating the suitability of the proposed approach. The characterization of the genomic sequences in both strategies, complex networks and information theory, is directly related to the frequency of nucleotides occurrence within them. Thus, intergenic regions which have a higher repetition of identical nucleotides is detected by the proposed approach, making possible the identification of theses sequences more correctly and also contributing by the correct inference from the other classes.
5 Conclusions
This paper presents a new approach for feature extraction and classification of genomic sequences by identifying patterns in the arrangement of the nucleotides within them. The proposed approach combines complex networks and information theory measures for the composition of a feature vector representing each genomic sequence.
The experimental results show the suitability and the potential of the proposed methodology to classify three different DNA regions: Coding, Intergenic and hspromoter achieving 91.2% (Random Forest), 89.1% (J48) and 84.8% (SVM) of classification accuracy.
In addition to the obtained results, the complex networks also provides the possibility of new experiments because the flexibility of the algorithm to higher parameters (WS and P) combination values, as a result allowing a greater number of networks and extracted features, which may improve the classification results. Besides, in a further work the proposed methodology can be applied for the classification of other classes of genomic sequences such as: miRNA, transposon, protein-coding genes, RNA genes, regulatory sequences and other sequences.
Acknowledgments
This work was supported by CNPq and Fundação Araucária.
References
- [1] Shen-Orr, S.S., Milo, R., Mangan, S., Alon, U.: Network motifs in the transcriptional regulation network of escherichia coli. Nature genetics 31(1) (2002) 64–68
- [2] Diambra, L., Costa, L.d.F.: Complex networks approach to gene expression driven phenotype imaging. Bioinformatics 21(20) (2005) 3846–3851
- [3] Lopes, F.M., Martins Jr, D.C., Barrera, J., Cesar Jr, R.M.: A feature selection technique for inference of graphs from their known topological properties: Revealing scale-free gene regulatory networks. Information Sciences 272 (2014) 1–15
- [4] Lopes, F.M., Cesar Jr, R.M., Costa, L.D.F.: Gene expression complex networks: synthesis, identification, and analysis. J. of Comp. Biol. 18(10) (2011) 1353–1367
- [5] Jeong, H., Mason, S.P., Barabási, A.L., Oltvai, Z.N.: Lethality and centrality in protein networks. Nature 411(6833) (2001) 41–42
- [6] Costa, L.d.F., Rodrigues, F.A., Travieso, G.: Protein domain connectivity and essentiality. Applied physics letters 89(17) (2006) 174101
- [7] Jeong, H., Tombor, B., Albert, R., Oltvai, Z.N., Barabási, A.L.: The large-scale organization of metabolic networks. Nature 407(6804) (2000) 651–654
- [8] Vogelstein, B., Lane, D., Levine, A.J.: Surfing the p53 network. Nature 408(6810) (2000) 307–310
- [9] Costa, L.d.F., Rodrigues, F.A., Travieso, G., Villas-Boas, P.R.: Characterization of complex networks: a survey of measurements. Adv. in Phys. 56(1) (2007) 167–242
- [10] Butte, A., Kohane, I.: Mutual information relevance networks: functional genomic clustering using pairwise entropy measurements. In: PSB. (2000) 418–429
- [11] Lopes, F.M., Martins-Jr, D.C., Cesar-Jr, R.M.: Feature selection environment for genomic applications. BMC Bioinformatics 9(1) (October 2008) 451
- [12] Lopes, F.M., de Oliveira, E.A., Cesar-Jr, R.M.: Inference of gene regulatory networks from time series by Tsallis entropies. BMC Syst. Biology 5(1) (2011) 61
- [13] Lopes, F.M., Ray, S.S., Hashimoto, R.F., Jr., R.M.C.: Entropic biological score: a cell cycle investigation for GRNs inference. Gene 541(2) (2014) 129–137
- [14] Theodoridis, S., Koutroumbas, K.: Pattern Recognition. 4th edn. Academic Press, USA (2008)
- [15] Ohler, U.: Promoter prediction on a genomic scale - the adh experience. Genome research 10(4) (2000) 539–542
- [16] Down, T.A., Hubbard, T.J.: Computational detection and location of transcription start sites in mammalian genomic dna. Genome research 12(3) (2002) 458–461
- [17] Sonnenburg, S., Zien, A., Rätsch, G.: Arts: accurate recognition of transcription starts in human. Bioinformatics 22(14) (2006) e472–e480
- [18] Guimera, R., Amaral, L.A.N.: Modeling the world-wide airport network. The European Physical J. B-Cond. Mat. and Complex Syst. 38(2) (2004) 381–385
- [19] Barabási, A.L., Albert, R., Jeong, H.: Scale-free characteristics of random networks: the topology of the world-wide web. Physica A: Statistical Mechanics and its Applications 281(1) (2000) 69–77
- [20] Wasserman, S.: Social network analysis: Methods and applications. Volume 8. Cambridge university press (1994)
- [21] Costa, L.d.F., Sporns, O.: Hierarchical features of large-scale cortical connectivity. The European Physical J. B-Cond. Mat. and Complex Syst. 48(4) (2005) 567–573
- [22] Rubinov, M., Sporns, O.: Complex network measures of brain connectivity: uses and interpretations. Neuroimage 52(3) (2010) 1059–1069
- [23] Kauffman, S.A.: Chapter 5 gene regulation networks: A theory for their global structure and behaviors. Volume 6 of Current Topics in Developmental Biology. Academic Press (1971) 145–182
- [24] Jeong, H., Tombor, B., Albert, R., Oltvai, Z.N., Barabási, A.L.: The large-scale organization of metabolic networks. Nature 407 (2000) 651–654
- [25] Albert, R.: Scale-free networks in cell biology. J Cell Sci 118(21) (2005) 4947–4957
- [26] Costa, L.d.F., Rodrigues, F.A., Cristino, A.S.: Complex networks: the key to systems biology. Genetics and Molecular Biology 31(3) (2008) 591–601
- [27] Watts, D.J., Strogatz, S.H.: Collective dynamics of ’small-world’ networks. nature 393(6684) (1998) 440–442
- [28] Boccaletti, S., Latora, V., Moreno, Y., Chavez, M., Hwang, D.U.: Complex networks: Structure and dynamics. Physics reports 424(4) (2006) 175–308
- [29] Freeman, L.C.: A set of measures of centrality based on betweenness. Sociometry (1977) 35–41
- [30] Milo, R., Shen-Orr, S., Itzkovitz, S., Kashtan, N., Chklovskii, D., Alon, U.: Network motifs: simple building blocks of complex networks. Science 298 (2002) 824–827
- [31] Danon, L., Diaz-Guilera, A., Duch, J., Arenas, A.: Comparing community structure identification. J. of Statistical Mech.: Theory and Exp. 2005(09) (2005) P09008
- [32] Shannon, C.E.: A mathematical theory of communication. ACM SIGMOBILE Mobile Computing and Communications Review 5(1) (2001) 3–55
- [33] Jaynes, E.: Information theory and statistical mechanics. Physical Review 106 (1957) 620–630
- [34] Yamashita, R., Sugano, S., Suzuki, Y., Nakai, K.: Dbtss: Database of transcriptional start sites progress report in 2012. NAR 40(D1) (2012) D150–D154
- [35] Kent, W.J., Sugnet, C.W., Furey, T.S., Roskin, K.M., Pringle, T.H., Zahler, A.M., Haussler, D.: The human genome browser at UCSC. Genome Research 12(6) (2002) 996–1006
- [36] Hall, M., Frank, E., Holmes, G., Pfahringer, B., Reutemann, P., Witten, I.H.: The weka data mining software: An update. SIGKDD Exp. Newsl. 11(1) (2009) 10–18