The exclusion of a significant range of ages in a massive star cluster
Abstract
Stars spend most of their lifetimes on the main sequence in the Hertzsprung–Russell diagram. The extended main-sequence turn-off regions – containing stars leaving the main sequence after having spent all of the hydrogen in their cores – found in massive (more than a few tens of thousands of solar masses), intermediate-age (about one to three billion years old) star clusters[1, 2, 3, 4, 5, 6, 7, 8] are usually interpreted as evidence of cluster-internal age spreads of more than 300 million years[2, 4, 5], although young clusters are thought to quickly lose any remaining star-forming fuel following a period of rapid gas expulsion on timescales of order years[9, 10]. Here we report that the stars beyond the main sequence in the two billion-year-old cluster NGC 1651, characterized by a mass of solar masses[3], can be explained only by a single-age stellar population, even though the cluster has clearly extended main-sequence turn-off region. The most plausible explanation for the extended main-sequence turn-offs invokes the presence of a population of rapidly rotating stars, although the secondary effects of the prolonged stellar lifetimes associated with such a stellar-population mixture are as yet poorly understood. From preliminary analysis of previously obtained data, we find that similar morphologies are apparent in the Hertzsprung–Russell diagrams of at least five additional intermediate-age star clusters[2, 3, 5, 11], suggesting that an extended main-sequence turn-off does not necessarily imply the presence of a significant cinternal age dispersion.
Kavli Institute for Astronomy & Astrophysics, Peking
University, Yi He Yuan Lu 5, Hai Dian District, Beijing 100871,
China
Department of Astronomy, Peking University, Yi He Yuan Lu 5,
Hai Dian District, Beijing 100871, China
Key Laboratory for Optical Astronomy, National Astronomical
Observatories, Chinese Academy of Sciences, 20A Datun Road,
Chaoyang District, Beijing 100012, China
We obtained archival Hubble Space Telescope/Wide Field Camera-3 observations of the NGC 1651 field in the F475W (“”) and F814W (“”) broad-band filters (Methods). The corresponding colour–magnitude diagram, that is, the observational counterpart of the Hertzsprung–Russell diagram, is shown in Fig. 1. When stars have exhausted their core hydrogen supply, hydrogen fusion continues in a shell outside the stellar core. At this stage, stars leave the main sequence and evolve onto the subgiant branch. The colour–magnitude diagram of NGC 1651 exhibits a clearly extended main-sequence turn-off and a very narrow subgiant branch. This is surprising, given the corresponding, far-reaching implications for our interpretation of such extended turn-offs in the context of star cluster evolution.
Star clusters more massive than a few tens thousands of solar masses were, until recently, considered single-generation (“simple”) stellar populations. It was thought that all of their member stars had formed approximately simultaneously from molecular gas originally confined to a small volume of space. As a consequence, all cluster stars would thus have similar ages, a very narrow range in chemical composition and individual stellar masses that followed the initial mass function, that is, the stellar mass distribution at the time of star birth. In the past decade, however, consensus has emerged that massive star clusters are no longer ideal simple stellar populations[12, 13, 14, 15, 16, 17, 18]. Deviations from the simple-stellar-population model in resolved star clusters are most readily discerned by reference to their colour–magnitude diagrams, and in particular to their main-sequence turn-off regions.
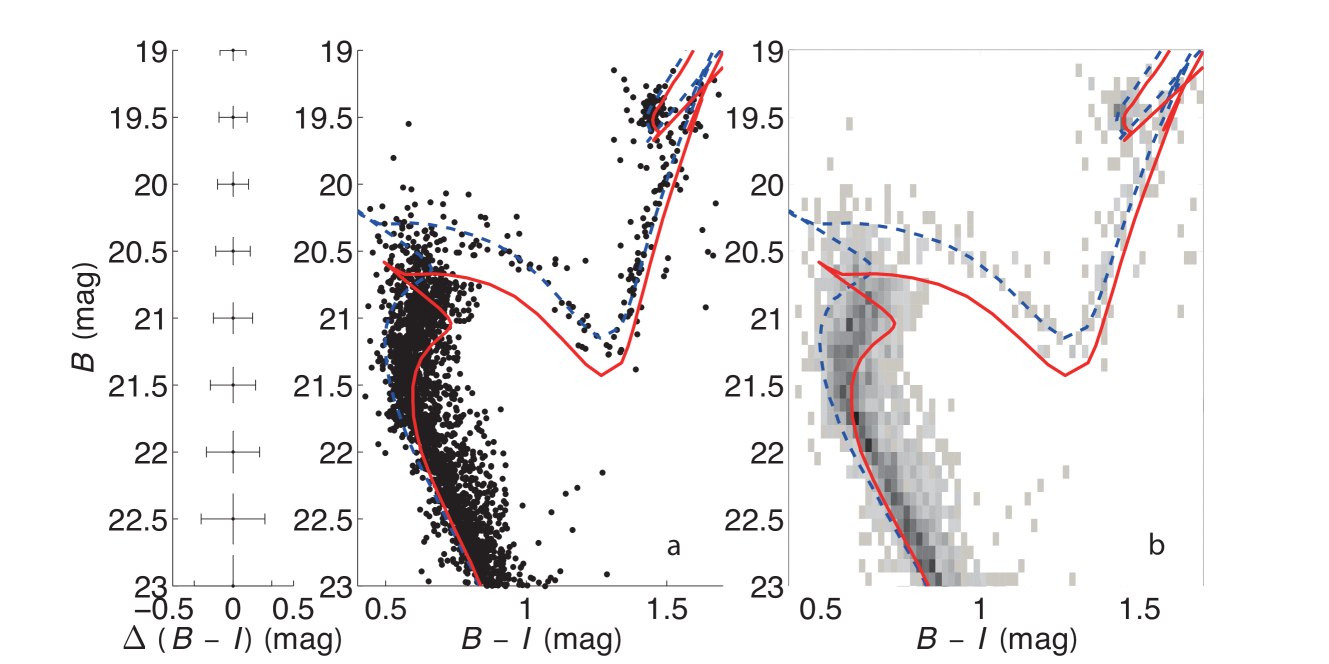
Taking a simplistic, direct approach, we obtain best fits to the blue and red edges of the extended turn-off by matching the best set of theoretical stellar isochrones[19] available at present to the observed stellar distribution. The best-fitting isochrones bracketing the data range from to (where represents the stellar population’s age), for a stellar metal (iron) abundance, [Fe/H] dex (ref. 20),a reddening mag and a distance modulus, mag (ref.21).Figure 1 shows the ‘cleaned’ colour–magnitude diagram (Methods). The lines represent the best-fitting theoretical isochrones covering the cluster’s extended main-sequence turn-off. Although the latter is well-described by adoption of an age dispersion of approximately 450 Myr, the cluster’s subgiant-branch stars are predominantly confined to the youngest isochrone. The 15 subgiant-branch stars in the NGC 1651 core region (with a radius of arcsec pc; see Methods) are confined to an even narrower distribution along the subgiant branch than is the full sample of 38 stars selected using the box in Fig. 2a, c. This indicates that the narrow width of the subgiant branch does not depend on position in the cluster. However, a 450 Myr age spread would also require a significant broadening of the cluster’s subgiant branch. This is why our discovery of a subgiant branch in NGC 1651 with a very narrow stellar distribution is surprising, which thus immediately leaves us with a troublesome conundrum.
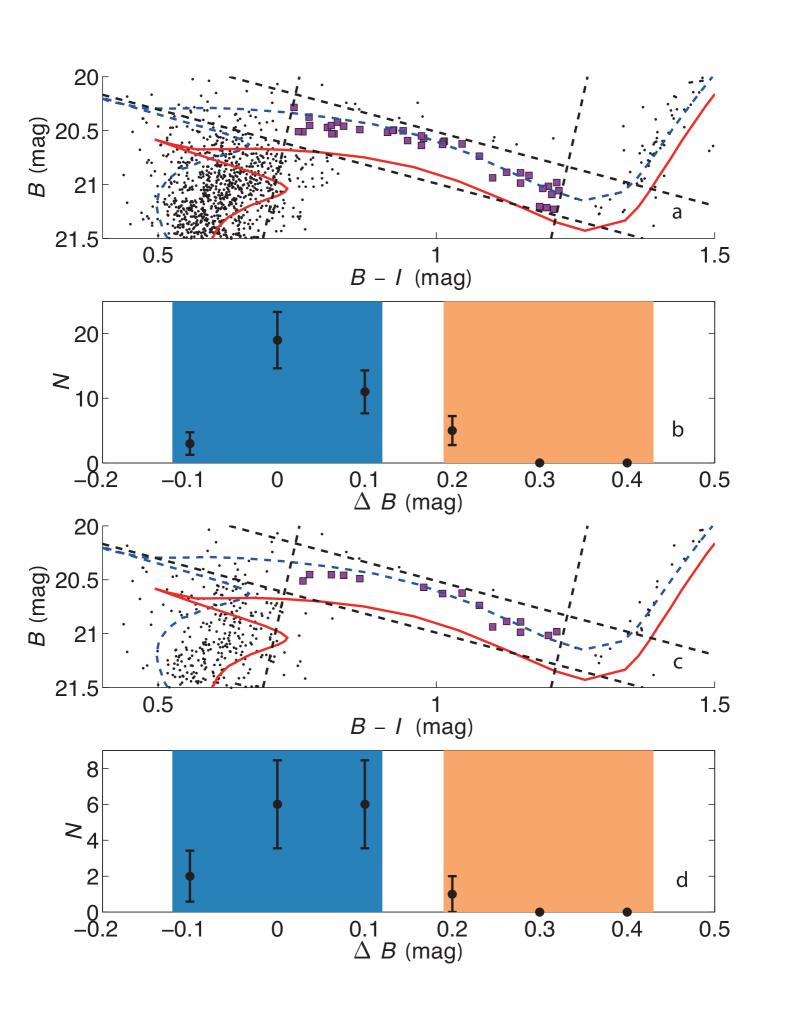
To assess the association of our subgiant-branch stars with either the youngest or oldest isochrones, we first adopt the isochrone as our baseline and calculate the individual deviations, (mag), for all subgiant-branch stars. We subsequently adopt the isochrone as our fiducial locus. The blue and orange regions in Fig. 2b, d correspond to the typical deviations expected for subgiant-branch stars associated with the young and old isochrones, respectively, assuming a 3 magnitude dispersion of mag. Thirty of the 38 stars (14 of 15 stars in the core) are associated with the young isochrone. Only a single subgiant-branch star, located outside the cluster’s core region, might statistically be associated with the region in parameter space defined by the old isochrone. If we directly use the observed spread of these stars in the colour–magnitude diagram to derive a maximum likely age spread, , we conclude that Myr for the full sample and that Myr for the core sample (Methods).
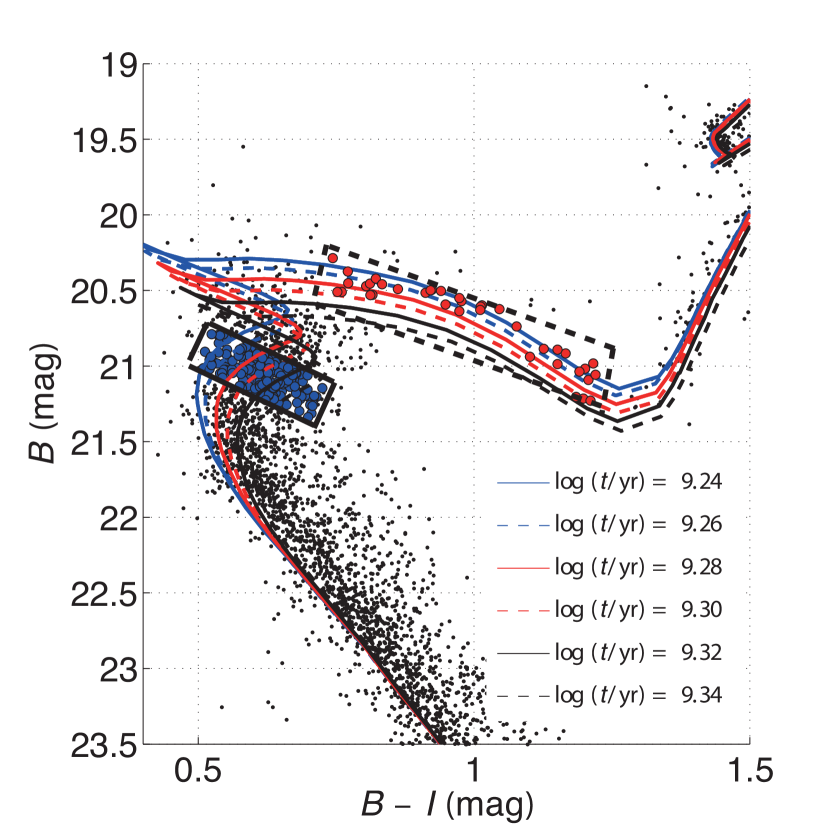
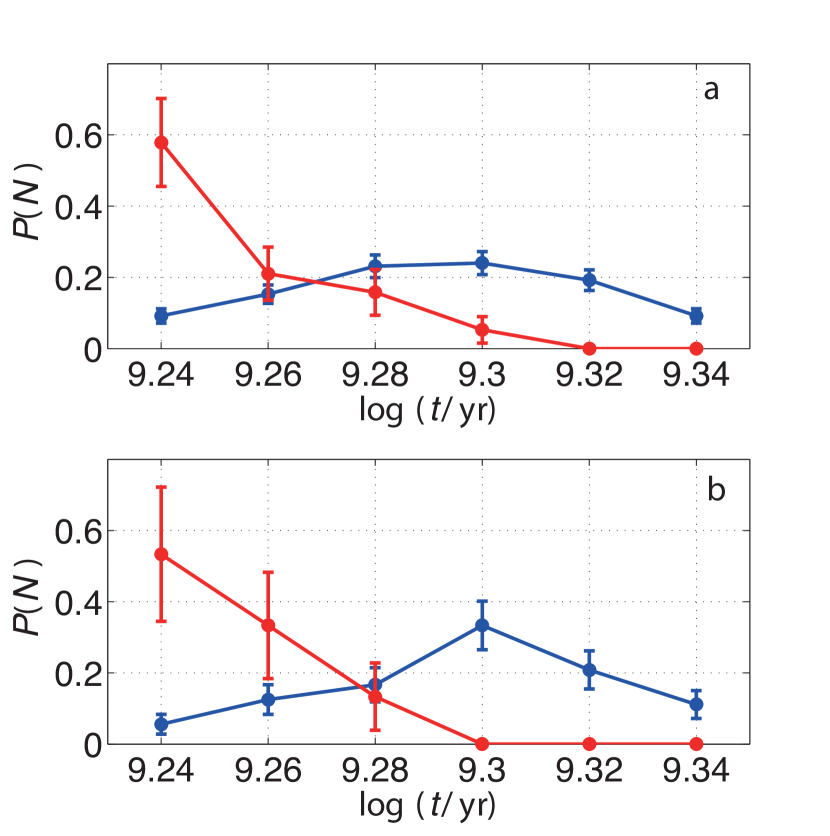
If the cluster’s stellar population were characterized by an age dispersion, this would naturally produce a broadened subgiant branch. Using Fig. 3, we quantitatively assess the probability of the presence of a genuine internal age dispersion. We calculated the number-density distributions of both “typical” extended turn-off stars (blue bullets in Fig. 3) and the cluster’s subgiant-branch stars, adopting differently aged isochrones (see figure legend). The resulting distributions are indeed significantly different, as shown in Fig. 4 (a, b). Whereas the extended turn-off stars clearly exhibit a spread from to 9.34, the subgiant-branch stars are almost all associated with the young isochrone. Once again, this invalidates the presence of a genuine age spread within the cluster.
It is imperative to probe beyond the extended main-sequence turn-off to fully understand the evolution of massive clusters at ages in excess of 1 Gyr. Subgiant-branch stars will not yet have experienced significant mass loss, which would further complicate our interpretation of, for example, the morphology of the upper end of the red-giant branch and of the red clump. Investigation of the subgiant-branch morphology thus offers clean insights into the extent to which intermediate-age clusters resemble true simple stellar populations, unimpeded by effects owing to unresolved binary systems[22, 23] or the possible presence of a population of rapidly rotating stars[24, 25, 26, 8], both of which complicate our interpretation of the nature of the observed extended main-sequence turn-offs. Unresolved binary systems will broaden the turn-off towards lower magnitude (brighter stars), but they will not cause a reddening of this region[2, 3]. Our discovery of a very narrow subgiant branch in NGC 1651 implies that the impact of binary systems is negligible.
The possible presence of a population of rapidly rotating stars may also complicate our interpretation of the observed, extended main-sequence turn-offs in intermediate-age clusters[24, 8]. Moreover, because of the conservation of angular momentum, any fast rotators on the main sequence are (naively) expected to quickly slow down when they expand and evolve onto the subgiant branch. However, in practice the contribution to the subgiant-branch morphology from a population of rapidly rotating stars is complex, given that fast stellar rotation facilitates prolonged main-sequence lifetimes[27]. The presence of such stars may, in fact, also cause a subgiant-branch split[28], driven by the resulting extended characteristic stellar mass range and its corresponding range in evolutionary timescales. However, the importance of this latter scenario strongly depends on the prevailing mixing efficiency[26]. For sufficiently small mixing efficiencies, the turn-off region will be broadened while the subgiant branch will remain relatively narrow (Methods).
Nevertheless, the observed narrow subgiant-branch width provides the strongest evidence yet that NGC 1651 cannot have undergone star formation for any significant, sustained length of time. This thus implies that an extended main-sequence turn-off in the colour–magnitude diagram of an intermediate-age massive cluster does not necessarily imply the presence of a significant, Myr age dispersion. NGC 1651 is so far unique, because its subgiant branch is the narrowest yet discovered and discussed for any cluster characterized by an extended main-sequence turn-off, thus supporting its nature as a genuine simple stellar population (for chemical composition-related arguments, see Methods). In retrospect, other intermediate-age clusters have been found that exhibit extended main-sequence turn-offs but which also exhibit very narrow subgiant branches, including NGC 1783.[2, 3, 5], NGC 1806[2, 3, 5], NGC 1846[2, 3, 5], NGC 2155[11] and SL 674[11]. The results highlighted here have left us with an as yet unresolved puzzle regarding the evolution of young and intermediate-age massive star clusters. This is troublesome, since star clusters are among the brightest stellar population components in any galaxy; they are visible to much greater distances than individual stars, even the brightest. Understanding star cluster composition in detail is therefore imperative for understanding the evolution of galaxies as a whole.
References
- [1] Mackey, A. D. & Broby Nielsen, P. A double main-sequence turn-off in the rich star cluster NGC 1846 in the Large Magellanic Cloud. MNRAS 379, 151–158 (2007)
- [2] Mackey, A. D., Broby Nielsen, P., Ferguson, A. M. N. & Richardson, J. C. Multiple Stellar Populations in Three Rich Large Magellanic Cloud Star Clusters. ApJ 681, L17–L20 (2008)
- [3] Milone, A. P., Bedin, L. R., Piotto, G. & Anderson, J. Multiple stellar populations in Magellanic Cloud clusters. I. An ordinary feature for intermediate age globulars in the LMC? A&A 497, 755–771 (2009)
- [4] Rubele, S., Kerber, L. & Girardi, L. The star-formation history of the Small Magellanic Cloud star cluster NGC 419. MNRAS 403, 1156–1164 (2010)
- [5] Goudfrooij, P., Puzia, T. H., Kozhurina-Platais, V., & Chandar, R. Population Parameters of Intermediate-age Star Clusters in the Large Magellanic Cloud. II. New Insights from Extended Main-Sequence Turnoffs in Seven Star Clusters. ApJ 737, 3 (18pp) (2011)
- [6] Keller, S. C., Mackey, A. D. & Da Costa, G. S. Extended Star Formation in the Intermediate-age Large Magellanic Cloud Star Cluster NGC 2209 ApJ 761, L5 (5pp) (2012)
- [7] Rubele, S., Girardi, L., Kozhurina-Platais, V., Kerber, L., Goudfrooij, P., Bressan, A., Marigo, P. The star formation history of the Large Magellanic Cloud star clusters NGC 1846 and NGC 1783. MNRAS 430, 2774–2788 (2013)
- [8] Li, C., de Grijs, R. & Deng, L. Not-so-simple Stellar Populations in the Intermediate-age Large Magellanic Cloud Star Clusters NGC 1831 and NGC 1868. ApJ 784, 157 (13pp) (2014)
- [9] Bastian, N. & Goodwin, S. P. Evidence for the strong effect of gas removal on the internal dynamics of young stellar clusters. MNRAS 369, L9–L13 (2006)
- [10] Longmore, S. N., Kruijssen, J. M. D., Bastian, N., Bally, J., Rathborne, J., Testi, L., Stolte, A., Dale, J., Bressert, E. & Alves, J. The Formation and Early Evolution of Young Massive Clusters. Protostars and Planets VI, in press (arXiv:1401.4175) (2014)
- [11] Piatti, A. E., Keller, S. C., Mackey, A. D., & Da Costa, G. S. Gemini/GMOS photometry of intermediate-age star clusters in the Large Magellanic Cloud. MNRAS 444, 1425–1441 (2014)
- [12] Piotto, G., Villanova, S., Bedin, L. R., Gratton, R., Cassisi, S., Momany, Y., Recio-Blanco, A., Lucatello, S., Anderson, J., King, I. R., Pietrinferni, A. & Carraro, G. Metallicities on the Double Main Sequence of Centauri Imply Large Helium Enhancement. ApJ 621, 777–784 (2005)
- [13] Piotto, G., Bedin, L. R., Anderson, J., King, I. R., Cassisi, S., Milone, A. P., Villanova, S., Pietrinferni, A. & Renzini, A. A Triple Main Sequence in the Globular Cluster NGC 2808. ApJ 661, L53–L56 (2007)
- [14] Sollima, A., Ferraro, F. R., Bellazzini, M., Origlia, L., Straniero, O. & Pancino, E. Deep FORS1 Observations of the Double Main Sequence of Centauri. ApJ 654, 915–922 (2007)
- [15] Milone, A. P., Bedin, L. R., Piotto, G., Anderson, J., King, I. R., Sarajedini, A., Dotter, A., Chaboyer, B., Marín-Franch, A., Majewski, S., Aparicio, A., Hempel, M., Paust, N. E. Q., Reid, I. N., Rosenberg, A. & Siegel, M. The ACS Survey of Galactic Globular Clusters. III. The Double Subgiant Branch of NGC 1851. ApJ 673, 241–250 (2008)
- [16] Lee, J.-W., Kang, Y.-W., Lee, J. & Lee, Y.-W., Enrichment by supernovae in globular clusters with multiple populations Nature 462, 480–482 (2009)
- [17] Milone, A. P., Marino, A. F., Piotto, G., Bedin, L. R., Anderson, J., Aparicio, A., Cassisi, S. & Rich, R. M. A Double Main Sequence in the Globular Cluster NGC 6397. ApJ 745, 27 (10pp) (2012)
- [18] Piotto, G., Milone, A. P., Marino, A. F., Bedin, L. R., Anderson, J., Jerjen, H., Bellini, A. & Cassisi, S. Multi-wavelength Hubble Space Telescope Photometry of Stellar Populations in NGC 288. ApJ 775, 15 (7pp) (2013)
- [19] Marigo, P., Girardi, L., Bressan, A., Groenewegen, M. A. T., Silva, L. & Granato, G. L. Evolution of asymptotic giant branch stars. II. Optical to far-infrared isochrones with improved TP-AGB models. A&A 482, 883–905, (2008)
- [20] Dirsch, B., Richtler, T., Gieren, W. P. & Hilker, M. Age and metallicity for six LMC clusters and their surrounding field population. A&A 360, 133–160, (2000)
- [21] Grocholski, A. J., Sarajedini, A., Olsen, K. A. G., Tiede, G. P. & Mancone, C. L. Distances to Populous Clusters in the Large Magellanic Cloud via the -band Luminosity of the Red Clump. ApJ 134, 680–693, (2007)
- [22] Hu, Y., Deng, L., de Grijs, R., Liu, Q., & Goodwin, S. P. The Binary Fraction of the Young Cluster NGC 1818 in the Large Magellanic Cloud. ApJ 724, 649–656 (2010)
- [23] Li, C., de Grijs, R. & Deng, L. The binary fractions in the massive young Large Magellanic Cloud star clusters NGC 1805 and NGC 1818. MNRAS 436, 1497–1512 (2013)
- [24] Bastian, N. & de Mink, S. E. The effect of stellar rotation on colour–magnitude diagrams: on the apparent presence of multiple populations in intermediate age stellar clusters. MNRAS 398, L11–L15 (2009)
- [25] Li, Z., Mao, C., Chen, L. & Zhang, Q. Combined Effects of Binaries and Stellar Rotation on the Color–Magnitude Diagrams of Intermediate-age Star Clusters. ApJ 761, L22 (5pp) (2012)
- [26] Yang, W., Bi, S., Meng, X. & Liu, Z. The Effects of Rotation on the Main-Sequence Turnoff of Intermediate-age Massive Star Clusters. ApJ 776, 112 (14pp) (2013)
- [27] Girardi, L., Eggenberger, P.& Miglio, A. Can rotation explain the multiple main-sequence turn-offs of Magellanic Cloud star clusters?MNRAS 412, L103–L107 (2013)
- [28] Georgy, C., Granada, A., Ekström, S., Meynet, G., Anderson, R. I., Wyttenbach, A., Eggenberger, P., & Maeder, A. Populations of rotating stars. III. SYCLIST, the new Geneva population synthesis code. A&A 566, A21 (2014)
We thank Selma de Mink, Yang Huang and Xiaodian Chen for discussions and assistance. Partial financial support for this work was provided by the National Natural Science Foundation of China through grants 11073001,11373010 and 11473037.
C.L., R.d.G. and L.D. jointly designed and coordinated this study. C.L. performed the data reduction. C.L. and R.d.G. collaborated on the detailed analysis. L.D. provided ideas that improved the study’s robustness. All authors read, commented on and jointly approved submission of this article.
Correspondence and requests for materials should be addressed to C.L. (email: joshuali@pku.edu.cn)
The authors declare that they have no competing financial interests.
Methods
Observations and Reduction
The data sets of NGC 1651 were obtained as part of Hubble Space Telescope programme GO-12257 (Principal Investigator: L. Girardi), using the Wide Field Camera-3 (WFC3). Both clusters were observed through the F475W and F814W filters (with central wavelengths of 475 nm and 814 nm, respectively), which roughly correspond to the Johnson–Cousins and bands, respectively. Two images with long exposure times of 1440 s and 1430 s in the and bands, respectively. Two images with short exposure times of 720 s and 700 s, respectively, were obtained. We used the IRAF/DAOPHOT software package to perform point-spread-function photometry[2].
The photometric catalogues pertaining to the long- and short- exposure-time images were combined. We carefully cross-referenced both catalogues to avoid duplication of objects in the combined output catalogue. For stars in common between both catalogues, we adopted the generally more accurate photometry from the long-exposure catalogue for inclusion in the output master catalogue, except in the magnitude range where the long-exposure image could be affected by saturation (for example for stars on the upper red-giant branch or blue stragglers).[23]
Determination of the cluster region
We divided the stellar spatial distribution into 20 bins along both the right ascension () and declination () axes. Using a Gaussian function to fit the stellar number-density distribution in each direction, we determined the closest coincidence of both Gaussian peaks as the cluster centre: . The centre position compares very well with previous determinations. For instance, NASA’s Extragalactic Database (http://ned.ipac.caltech.edu) lists , while SIMBAD (http://simbad.u-strasbg.fr/) gives , compared with the NGC/IC Project’s (http://www.ngcicproject.org/realskyview/N1600-N1699.txt) .
The complete data set for this cluster is composed of a combination of two WFC3 images. We used a Monte Carlo-based method to estimate the areas of rings of different clustercentric radii (all radii were measured from the centre of the cluster). Specifically, we calculated the total area of the region covered and subsequently generated millions of points that were homogeneously distributed across the full region. We then calculated the number fraction of points located in each ring to the total number of points. We used this fraction, multiplied by the total area to represent the specific area of each ring. The number of stars in each ring is , where is the number of observed stars located in a ring with radius and is the corresponding area of the ring.
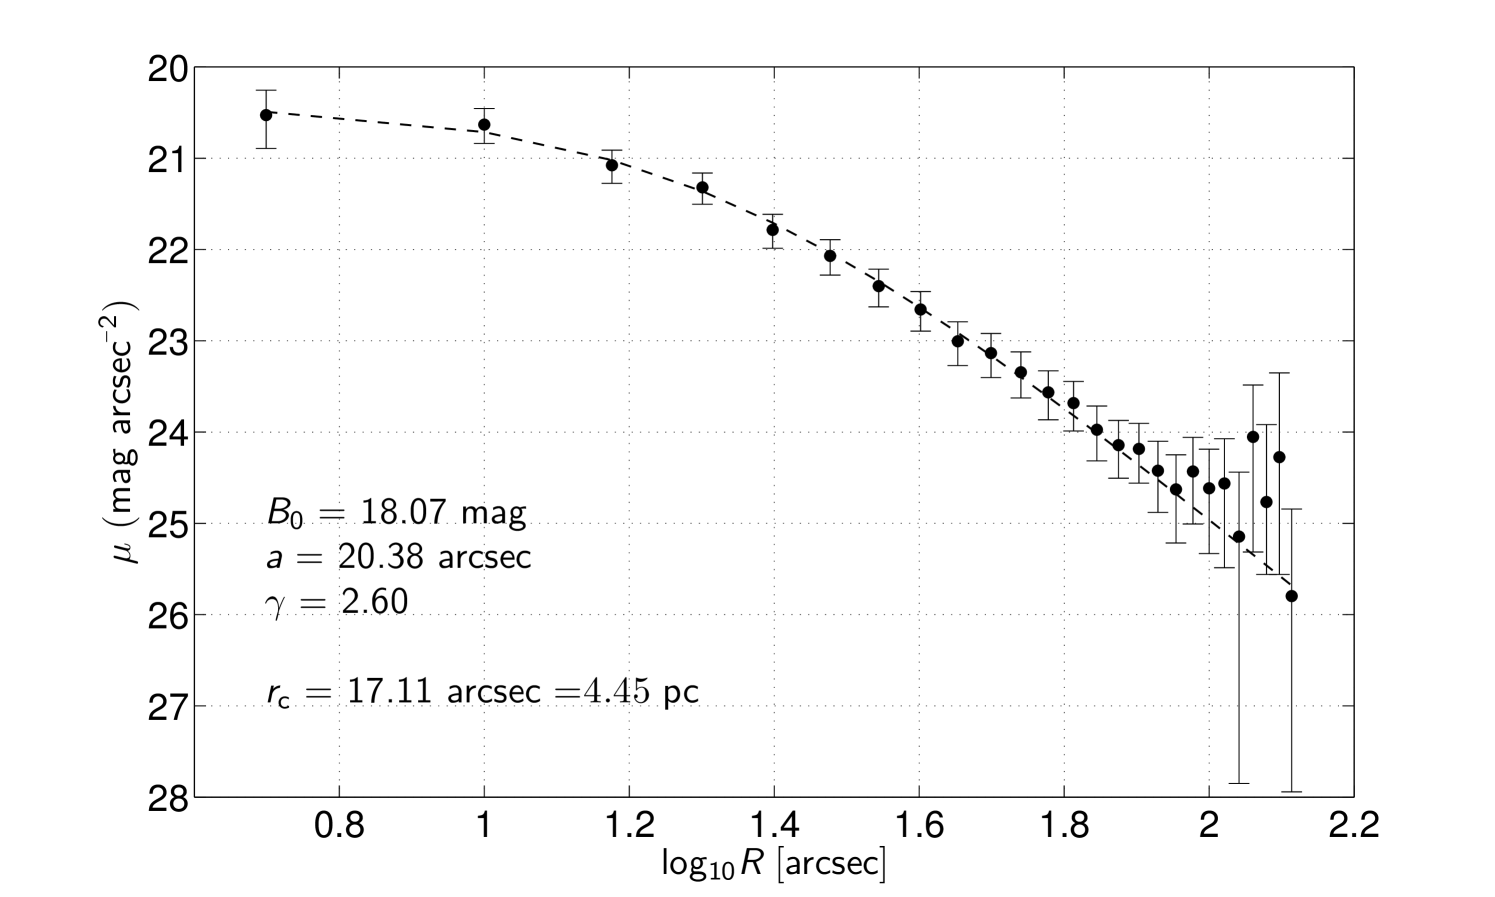
We next calculated the total brightness of stars in each ring, , where is the number of stars located in the ring of interest and mag is the adopted distance modulus. The brightness density is then , which corresponds to a surface brightness, . Because NGC 1651 is an intermediate-age star cluster, we represent its brightness profile by[3, 4]
| (1) |
where is the central surface brightness. The measure of the core radius, , and the power-law index are linked to the King core radius, , through
| (2) |
The cluster’s radial profile, including the 1 photometric uncertainties due to Poisson noise, as well as the best-fitting theoretical profile, are shown in Extended Data Fig. 1.
Field-star decontamination
The Hubble Space Telescope/WFC3 images cover a very large region, allowing us to investigate the entire cluster, as well as a neighbouring field region. Based on the radial density profile in Extended Data Fig. 2, we determined that for arcsec, the cluster brightness becomes indistinguishable from the background noise. We hence selected the region characterized by arcsec as our comparison field region for the purposes of field-star decontamination. Taking into account the standard deviation of the field-star magnitudes, we concluded that the most representative cluster region has a radius of arcsec. We statistically field-star decontaminated this cluster region. Using a Monte Carlo approach, we estimated that the comparison field region covers 46.7% of the cluster region.
The full stellar catalogue resulting from our analysis of the field region contains 759 stars. Given that the cluster region covers 2.14 times that of the comparison field, from a statistical perspective we therefore expect 1607 field stars to be located within the cluster region. We divided the NGC 1651 cluster and field colour–magnitude diagrams into 50 bins in magnitude and 25 bins in colour; for relatively sparsely populated regions, we enlarged the bin size appropriately (see below). We then calculated the number of field stars in each colour–magnitude bin, and subsequently removed 2.14 times the (integer) number of stars from the corresponding bins of the NGC 1651 colour–magnitude diagram.
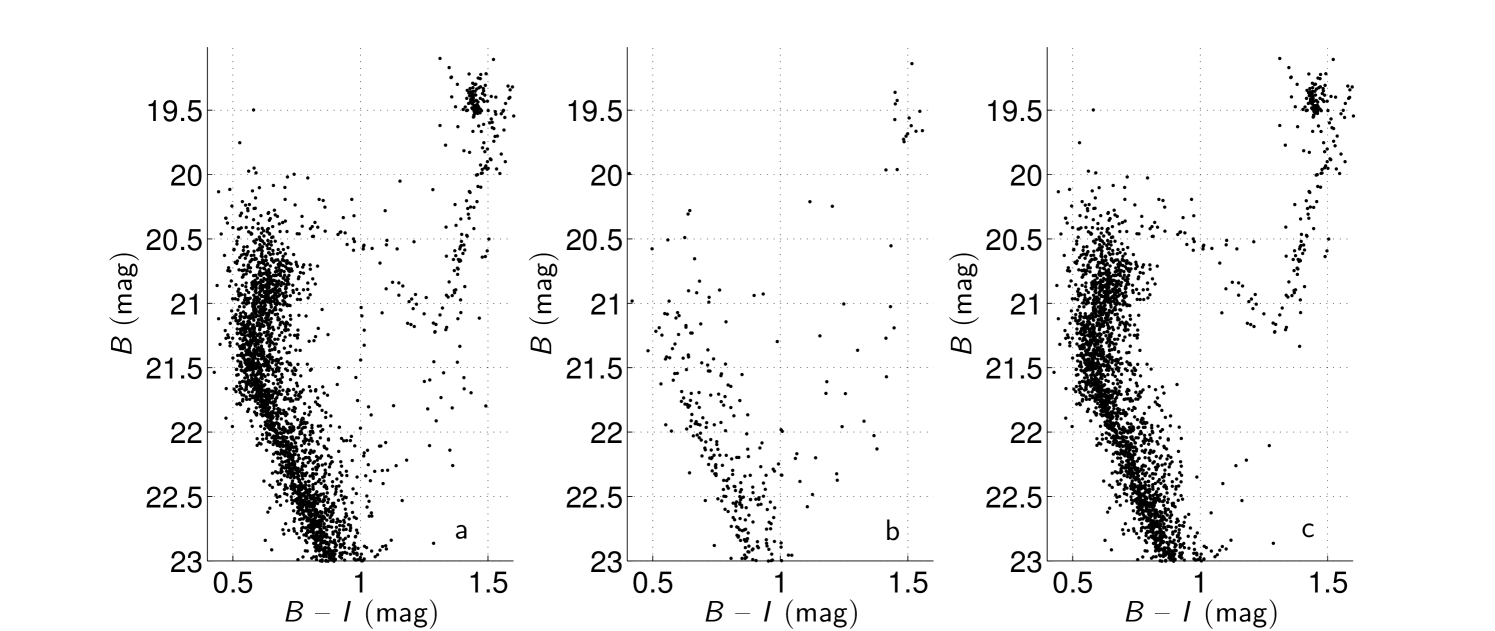
Because the comparison field region was selected from the same image as the cluster region, its exposure time is identical. Hence, exposure-time differences will not affect the reliability of our field-star decontamination, although statistical differences between the cluster and field regions cause a slight dependence on the adopted grid size. We carefully checked how the number of bins adopted would affect the decontamination results and enlarged the bin sizes for sparsely populated regions (e.g., on the red side of the main sequence). We concluded that our field-star decontamination is robust with respect to reasonable differences in adopted bin size. This thus eventually resulted in a statistically robustly field-star decontaminated colour–magnitude diagram of NGC 1651. We show the results of the main steps employed in our field-star decontamination procedure in Extended Data Fig. 2. Panel a shows the original colour–magnitude diagram of NGC 1651 (for arcsec), panel b represents the synthesized field-star equivalent and panel c is the decontaminated colour–magnitude diagram on which we based our analysis.
Using the subgiant branch to constrain the cluster’s maximum age dispersion
Many authors have invoked age dispersions as explanation for the observed extended main-sequence turn-off regions, and although numerous apparently somewhat different scenarios have been proposed, most can be traced back to the basic idea of an age dispersion. For instance, mergers of star clusters with an age difference of 200 Myr[1] as well as interactions of star clusters and star-forming giant molecular clouds,[5] have been suggested as the possible origin of extended turn-off regions.
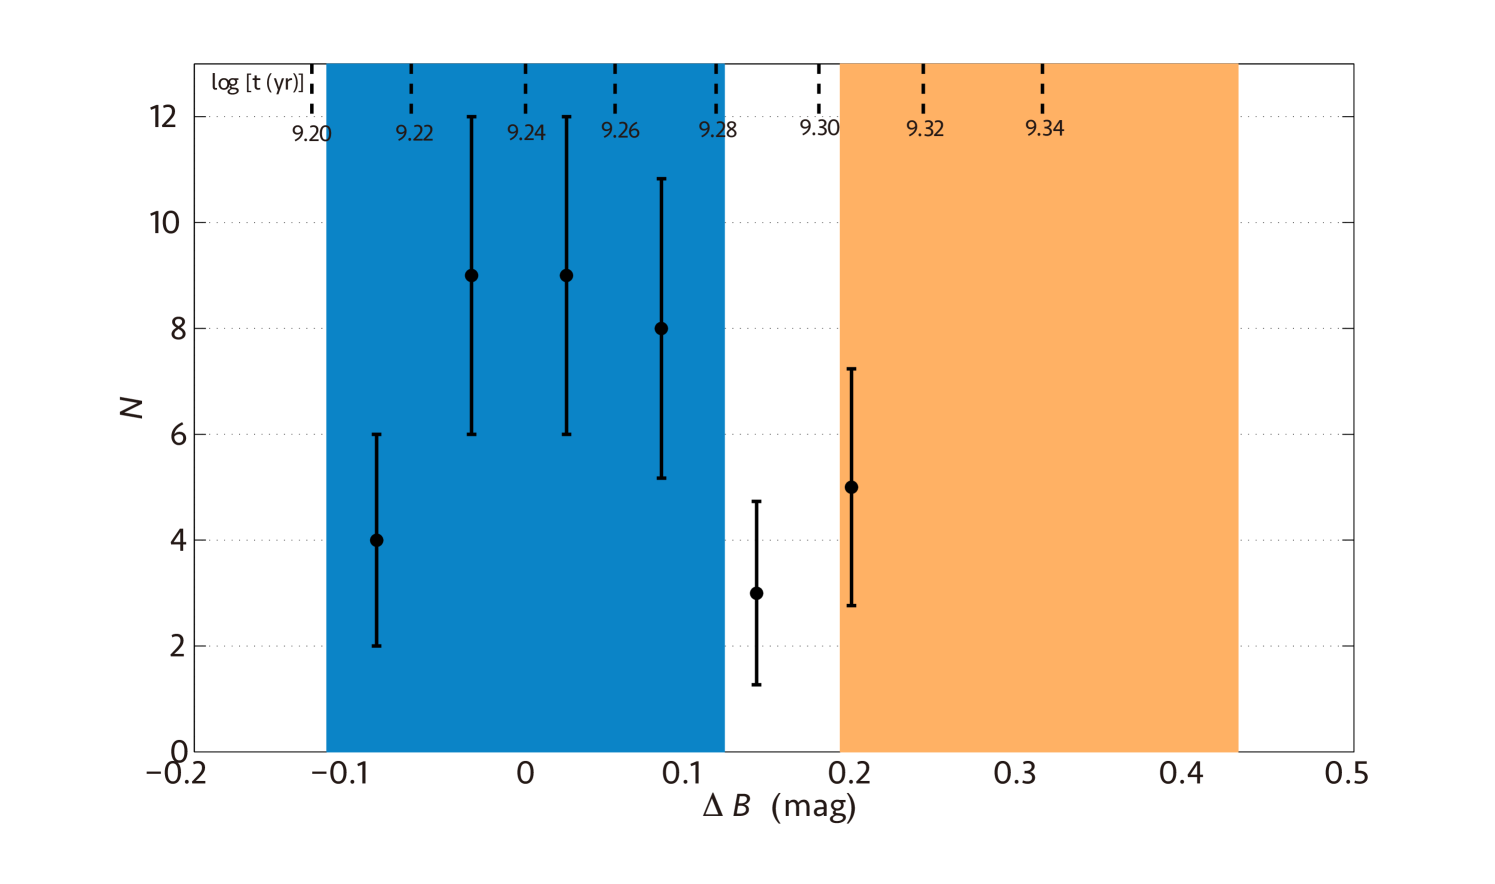
We calculated the magnitude deviation () with respect to the young, isochrone for each subgiant-branch star (cf. Fig. 2). Since our full sample contains 38 subgiant-branch stars, we adopted five bins in . A gradually increasing trend in is found, starting from mag, with a peak at mag, followed by a decrease to mag and a slight upturn to mag: see Extended Data Fig. 3, which includes the 1 standard deviations. We next generated an additional set of isochrones characterized by different ages and applied the same procedure. The typical values are included at the top of Extended Data Fig. 3 (black dashed lines), for an age resolution of .
Assuming appropriate photometric uncertainties for each of these isochrones, we calculated the number of subgiant-branch stars that would be covered if we adopted a given age dispersion. We first proceeded to test the simple-stellar-population approximation, i.e., assuming no age dispersion. In this case, all stars should be located on the isochrone, with a spread determined by the typical (3) photometric uncertainties of 0.12 mag. We found that 30 of our 38 subgiant-branch stars are associated with this isochrone (cf. Fig. 3, light blue background).
If we assume that all subgiant-branch stars belong to a simple stellar population characterized by a typical age of , and adopting the same photometric uncertainties, we can reproduce 35 of the 38 stars (92%). This thus strongly implies that the NGC 1651 stellar population is most likely a genuine simple stellar population. Extended Data Table 1 includes the results of our analysis to derive the maximum intrinsic age dispersion needed to explain the observed subgiant-branch loci in the cluster’s colour–magnitude diagram.
| Fraction (%) | (Myr) | ||
|---|---|---|---|
| 9.24–9.28 | 38/38 | 100.0 | 167 |
| 9.26–9.28 | 37/38 | 97.4 | 86 |
| 9.24–9.26 | 36/38 | 94.7 | 82 |
| 9.26 | 35/38 | 92.1 | SSP |
| 9.24 | 30/38 | 78.9 | SSP |
| 9.28 | 27/38 | 71.1 | SSP |
| 9.24–9.26 | 15/15 | 100.0 | 82 |
| 9.26 | 14/15 | 93.3 | SSP |
| 9.24 | 13/15 | 86.7 | SSP |
| 9.28 | 10/15 | 66.7 | SSP |
An age dispersion of 80 Myr can reproduce 90% of the subgiant-branch stars in our full sample. Similarly, if we assume that the cluster’s subgiant-branch stars are members of a simple stellar population, a typical age of can also reproduce 90% of all subgiant-branch stars. The result holds for the subgiant-branch sample in the cluster core: an age dispersion of 80 Myr can reproduce all the core subgiant-branch stars, and a simple-stellar-population model with a typical age of still reproduces 90% of the core subgiant-branch stars. This hence unequivocally excludes the presence of an age dispersion extending to at least .
A population of rapidly rotating stars?
The observed extended main-sequence turn-offs in intermediate-age clusters might also be explained as evidence of the presence of a population of rapidly rotating stars.[24, 26, 8]. The centrifugal force resulting from rapid stellar rotation leads to a reduction in effective gravity, which hence decreases both the stellar surface temperature and its luminosity[26]. The reduced gravity also leads to a decreasing stellar central hydrogen-burning efficiency, rendering stars slightly fainter. This effect mainly affects F-type stars; stars with masses below 1.2 solar masses do not rotate rapidly because of magnetic braking[6].
Although some authors have claimed that rapid stellar rotation could lead to a broadening of the turn-off[25, 8], this scenario only holds if rapid rotation does not have any effect on the stellar lifetime on the main sequence. However, rapid rotation will also cause a transfer of mass from radial shells to the central core, thus providing additional material for nuclear fusion in the core. This hence could increase the stellar lifetime compared with their non-rotating counterparts. Calculations of the effect of this expected prolongation of stellar lifetimes has led some authors[27] to conclude that the resulting colour–magnitude diagram will still retain a narrow main-sequence turn-off. These authors maintained that the presence of an age dispersion was still the most natural model that reproduces the extended turn-off. However, derivation of colour–magnitude diagrams resulting from the adoption of different rotation velocities,[26] while also considering the increased main-sequence lifetimes, led to the conclusion that such a scenario can still reproduce the observed extended turn-offs. However, the extent of the main-sequence turn-off’s broadening depends on the typical cluster age. Nevertheless, if one adopts a modest mixing efficiency for rotating stars, extended turn-offs can still be observed.[26] In any case, since different stellar rotation rates have been observed for solar-neighbourhood field stars[7], it is natural to expect that stars in star clusters may have similar distributions of rotation velocities.
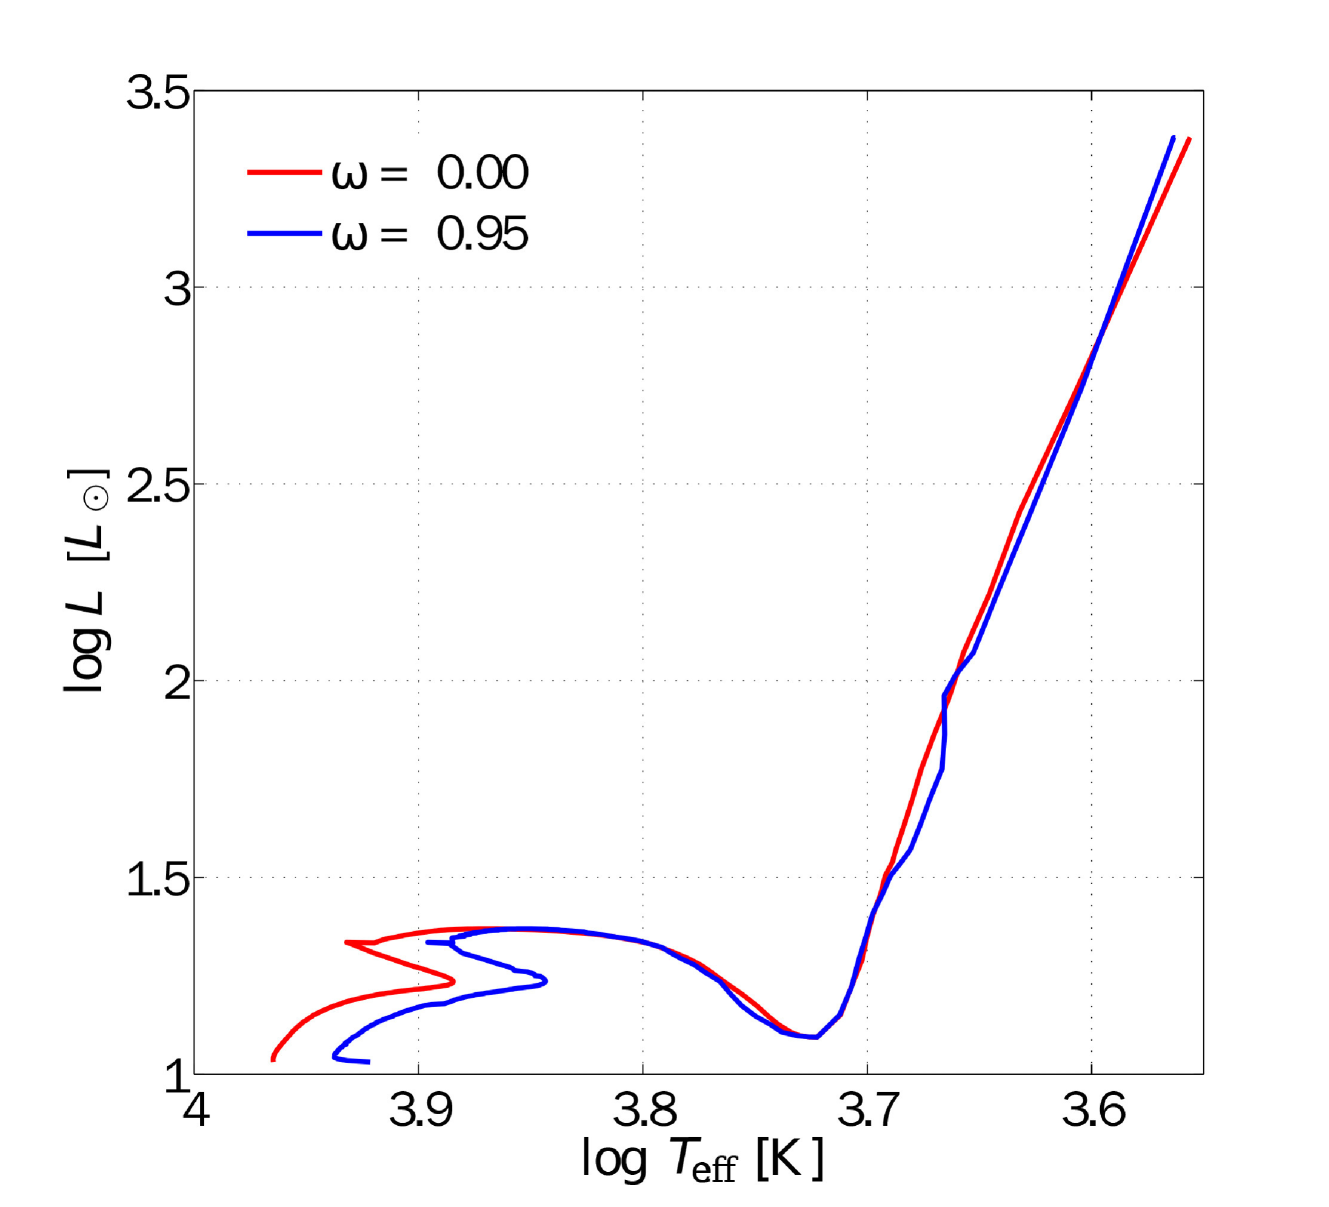
Overall, the extent to which rapid rotation will affect subgiant-branch stars is as yet unclear. Very few authors consider these effects, with the exception of a single study[28] that aims at generating a grid of stellar models including a range of rotation rates. Although these authors have thus far only satisfactorily completed their calculations for extremely massive stars, using different evolutionary tracks and a range of rotation velocities, this nevertheless allows us to estimate the extent to which rapid rotation may affect stars on the subgiant branch. Based on their interactive tools (http://obswww.unige.ch/Recherche/evol/-Database-), we generated two evolutionary tracks for their lowest-mass stars, 1.7 solar masses, one without rotation and the second characterized by extremely rapid rotation ( = 0.95, i.e., rotation at 95% of the critical break-up rate): see Extended Data Fig. 4. We clearly see that, following the main-sequence turn-off stage, the rapidly rotating track converges to the non-rotating track. Indeed, because of the conservation of angular momentum, the fast rotators are expected to quickly slow down when they expand and evolve onto the subgiant branch. This result hence confirms that the effects of rapid stellar rotation become negligible, so that the observed narrow subgiant branch in NGC 1651 can only be reconciled with the colour–magnitude diagram of a genuine simple stellar population.
However, taking into account the effects of rapid rotation is highly complex. Because stars that originally rotate rapidly tend to live longer than their non-rotating counterparts, the presence of a population of rapidly rotating stars may, in fact, still give rise to a broadened or split subgiant branch. Whether or not this scenario holds depends on the atmospheric mixing efficiency, the effects of which are as yet unclear. Nevertheless, we point out that if the mixing efficiency is reduced to “normal” levels of 0.03, the extended main-sequence turn-off caused by the most rapid stellar rotation will be equivalent to a simple-stellar-population age spread of approximately 450 Myr for clusters aged 1.7 Gyr[26]. This fits our observations exactly.
Additional evidence in support of NGC 1651 as a simple stellar population
Except for possibly the cluster’s sodium abundance, [Na/Fe], the observed dispersions in the abundances of all other elements investigated to date are consistent with the measurements’ root-mean-square values.[8] [Na/Fe] ranges from approximately dex to dex, but this result is based on analysis of only five bright asymptotic giant-branch stars, which may be strongly affected by their associated stellar winds. In fact, it has been shown convincingly[8, 9] that a number of extended main-sequence turn-off clusters do not exhibit chemical-abundance spreads.
Based on a detailed analysis of the spectra of 1200 red giants in 19 clusters[10], it has become apparent that first, intermediate- and extreme second-generation stars tend to be found in three typical zones in the [Na/Fe] versus [O/Fe] diagram. In this context, first-generation stars may be characterized by relatively poor sodium abundances, exhibiting dispersions of up to 0.4 dex[10]. As such, the absence of any significant abundance dispersions in most elements[8] in the cluster, combined with the observed spread in [Na/Fe], is indeed consistent with NGC 1651 representing a genuine simple stellar population.
Recent insights[11] convincingly showed that star clusters with ages up to 300 Myr in both Magellanic Clouds do not have any sizeable gas reservoirs left to form second-generation stars. One must thus turn to alternative models to explain the observations of clusters like NGC 1651.
References
- [1]
-
[2]
Davis, L. E. A Reference Guide to the
IRAF/DAOPHOT Package
http://iraf.noao.edu/iraf/web/docs/recommend.html (1994) - [3] Elson, R. A. W., Fall, S. M., & Freeman, K. C. The stellar content of rich young clusters in the Large Magellanic Cloud. ApJ 336, 734–751 (1989)
- [4] Mackey, A. D., & Gilmore, G. F. Surface brightness profiles and structural parameters for 53 rich stellar clusters in the Large Magellanic Cloud. MNRAS 338, 85–119 (2003)
- [5] Bekki, K., & Mackey, A. D. On the origin of double main-sequence turn-offs in star clusters of the Magellanic Clouds. MNRAS 394, 124–132 (2009)
- [6] Mestel, L. & Spruit, H. C. On magnetic braking of late-type stars. MNRAS 226, 57–66 (1987)
- [7] Royer, F., Zorec, J. & Gómez, A. E. Rotational velocities of A-type stars. III. Velocity distributions. A&A 463, 671–682 (2013)
- [8] Mucciarelli, A., Carretta, E., Origlia, L., & Ferraro, F. R. The Chemical Composition of Red Giant Stars in Four Intermediate-Age Clusters of the Large Magellanic Cloud. AJ 136, 375–388 (2008)
- [9] Mucciarelli, A., Dalessandro, E., Ferraro, F. R., Origlia, L. & Lanzoni, B. No Evidence of Chemical Anomalies in the Bimodal Turnoff Cluster NGC 1806 in the Large Magellanic Cloud. ApJ 793, L6 (5pp) (2014)
- [10] Carretta, E., Bragaglia, A., Gratton, R. G., Recio-Blanco, A., Lucatello, S., D’Orazi, V. & Cassisi, S. Properties of stellar generations in globular clusters and relations with global parameters. A&A 516, A55 (29pp) (2010)
- [11] Bastian, N., & Strader, J. Constraining globular cluster formation through studies of young massive clusters. III. A lack of gas and dust in massive stellar clusters in the LMC and SMC. MNRAS 443, 3594–3600 (2014)