Supplementary Materials for Nano-scale displacement sensing based on Van der Waals interaction

Lin Hu ICQD/Hefei National Laboratory for Physical Sciences at Microscale, and Key Laboratory of Strongly-Coupled Quantum Matter Physics, Chinese Academy of Sciences, and Department of Physics, University of Science and Technology of China, Hefei, Anhui 230026, China Synergetic Innovation Center of Quantum Information &\& Quantum Physics, University of Science and Technology of China, Hefei, Anhui 230026, China    Jin Zhao zhaojin@ustc.edu.cn ICQD/Hefei National Laboratory for Physical Sciences at Microscale, and Key Laboratory of Strongly-Coupled Quantum Matter Physics, Chinese Academy of Sciences, and Department of Physics, University of Science and Technology of China, Hefei, Anhui 230026, China Synergetic Innovation Center of Quantum Information &\& Quantum Physics, University of Science and Technology of China, Hefei, Anhui 230026, China    Jinlong Yang jlyang@ustc.edu.cn ICQD/Hefei National Laboratory for Physical Sciences at Microscale, and Key Laboratory of Strongly-Coupled Quantum Matter Physics, Chinese Academy of Sciences, and Department of Physics, University of Science and Technology of China, Hefei, Anhui 230026, China Synergetic Innovation Center of Quantum Information &\& Quantum Physics, University of Science and Technology of China, Hefei, Anhui 230026, China

I I. Vertical transitions corresponding to Peak I and Peak II.

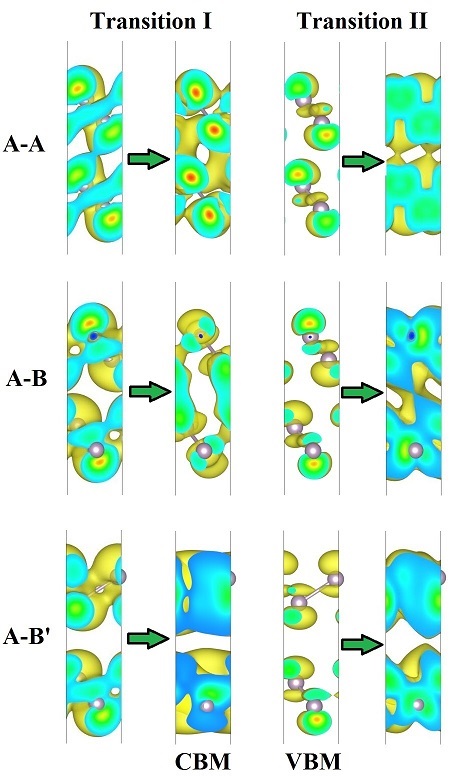
Peak I in Fig. 4(b) corresponds to a vertical transition from an initial state in VB to CBM. In Fig. S1 we plot out the orbital probability density distribution of the initial state and CBM. One can see that for three different stacking configurations, both the initial state and CBM show the bonding character of delocalized states in the interlayer region. Therefore their energy variations are almost the same. That is the reason that Peak I almost keeps constant corresponds to the displacement. Peak II in Fig.4 (b) corresponds to a vertical transition from VBM to a final state in CB. From Fig. S1 one can see that the final state contains the interlayer delocalized probability density and σ𝜎\sigma bonding character while VBM does not. Therefore EVBMsubscript𝐸𝑉𝐵𝑀E_{VBM} remains constant and EPeakIIsubscript𝐸𝑃𝑒𝑎𝑘𝐼𝐼E_{PeakII} changes remarkably with the energy of the final state.

Refer to caption
Figure S1: (color online)The orbital probability density distributions of the initial and final states of vertical transitions corresponding to Peak I and Peak II for A-A, A-B and A-B’ stacking BLBP.

II II. Fitting ECBMsubscript𝐸𝐶𝐵𝑀E_{CBM} and EPeakIIsubscript𝐸𝑃𝑒𝑎𝑘𝐼𝐼E_{PeakII} with quadratic equation

Both ECBMsubscript𝐸𝐶𝐵𝑀E_{CBM} and EPeakIIsubscript𝐸𝑃𝑒𝑎𝑘𝐼𝐼E_{PeakII} follow the quadratic equation express as: E=E0βdz2𝐸subscript𝐸0𝛽superscriptsubscript𝑑𝑧2E=E_{0}-\beta d_{z}^{-2}. The values of E0subscript𝐸0E_{0} and β𝛽\beta are shown in Table S1. Here E0subscript𝐸0E_{0} converges to the ECBMsubscript𝐸𝐶𝐵𝑀E_{CBM}/EPeakIIsubscript𝐸𝑃𝑒𝑎𝑘𝐼𝐼E_{PeakII} value of single layer BP. β𝛽\beta is determined by the interlayer hopping integral of interacting orbitals, which is proportional to the wave function overlap. The β𝛽\beta value of ECBMsubscript𝐸𝐶𝐵𝑀E_{CBM} is larger than EPeakIIsubscript𝐸𝑃𝑒𝑎𝑘𝐼𝐼E_{PeakII}, suggesting the hopping integral of CBM is larger than the final state of peak II in CB. For both ECBMsubscript𝐸𝐶𝐵𝑀E_{CBM} and EPeakIIsubscript𝐸𝑃𝑒𝑎𝑘𝐼𝐼E_{PeakII}, β𝛽\beta is independent for different stacking configurations, which suggests that the interlayer hopping integral does not change much for different stacking configurations. This might be due to the delocalized distribution of the interacting orbitals. The dz2superscriptsubscript𝑑𝑧2d_{z}^{-2} is described in tight-binding theory in ref1 .

Table S1: The values of E0subscript𝐸0E_{0} and β𝛽\beta for ECBMsubscript𝐸𝐶𝐵𝑀E_{CBM}, EPeakIIsubscript𝐸𝑃𝑒𝑎𝑘𝐼𝐼E_{PeakII} and Egapsubscript𝐸𝑔𝑎𝑝E_{gap}.
ECBMsubscript𝐸𝐶𝐵𝑀E_{CBM} EPeakIIsubscript𝐸𝑃𝑒𝑎𝑘𝐼𝐼E_{PeakII} Egapsubscript𝐸𝑔𝑎𝑝E_{gap}
BLBP E0subscript𝐸0E_{0}(eV) -2.31 4.80 3.4
β𝛽\beta(eV×\timesÅ2superscriptitalic-Å2{\AA}^{2}) 18.0 11.5 18.0
Bi-layer E0subscript𝐸0E_{0}(eV) 3.0
MoS2 β𝛽\beta(eV×\timesÅ2superscriptitalic-Å2{\AA}^{2}) 10.5

III III. The electronic structure dependence on interlayer twisting.

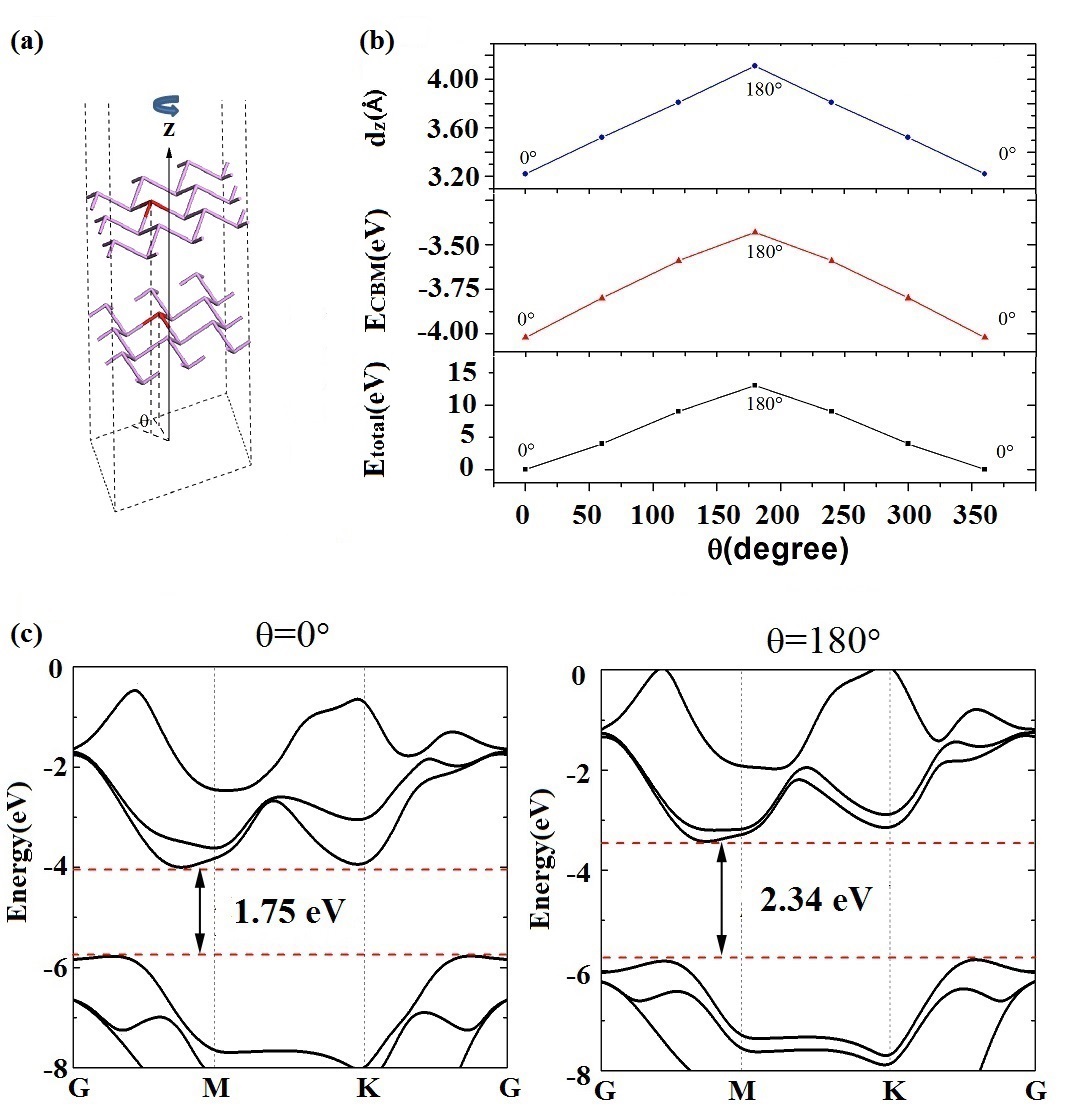
The electronic structure of BLBP is also sensitive to the interlayer twisting. We have investigated the band gap change for the A-A stacking when the top layer is twisted around z𝑧z axis shown in Fig. S2. The band gap varies from 1.75 eV to 2.34 eV when the twist angle θ𝜃\theta changes from 0superscript00^{\circ} to 180superscript180180^{\circ}. The total energy is within 13 meV. The interlayer distance dzsubscript𝑑𝑧d_{z} changes from 3.22 Å to 4.12 Å. The lowest energy configuration corresponding to θ=0𝜃superscript0\theta=0^{\circ} has the smallest dzsubscript𝑑𝑧d_{z}, in which the CBM is stabilized to the lowest energy because of its σ𝜎\sigma bonding character.

Refer to caption
Figure S2: (color online)The electronic structure dependence on interlayer twisting for A-A stacking BLBP. (a) The schematic diagram of interlayer twisting. (b) The change of Etotalsubscript𝐸𝑡𝑜𝑡𝑎𝑙E_{total}, ECBMsubscript𝐸𝐶𝐵𝑀E_{CBM} and dzsubscript𝑑𝑧d_{z} with twisting angle θ𝜃\theta. (c) The plotting of band structure corresponding to θ=0𝜃superscript0\theta=0^{\circ} and θ=180𝜃superscript180\theta=180^{\circ}.

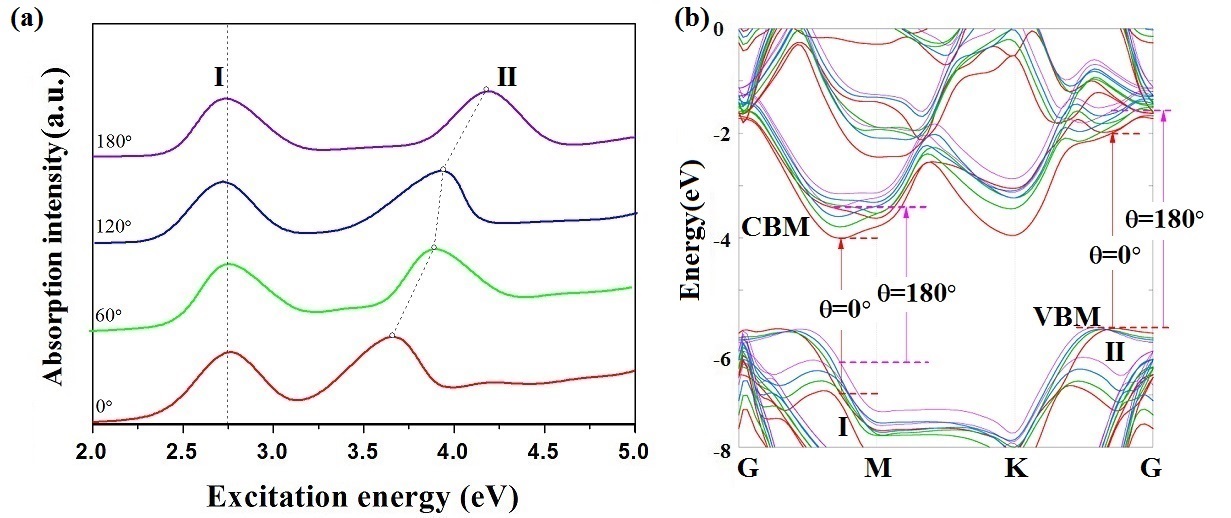
The absorption intensity of different twisting angle is also investigated. The absorption intensity for A-A stacking BLBP with different interlayer twist angle is shown in Fig. S3(a). The lowest two peaks corresponding to two direct excitation involves CBM and VBM as shown in Fig. S3(b). Peak I corresponding to the vertical excitation to CBM does not change with the twist angle. Peak II corresponding to the vertical excitation from VBM changes from 3.65 eV to 4.18 eV when θ𝜃\theta changes from 0superscript00^{\circ} to 180superscript180180^{\circ}.

Refer to caption
Figure S3: (color online)The Absorption intensity (a) and band structure (b) of A-A stacking BLBP when the interlayer twisting angle θ𝜃\theta changes from 0superscript00^{\circ} (red line) to 180superscript180180^{\circ} (purple line). The two absorption peaks below 5 eV are marked as peaks I and II in (a). The corresponding vertical transitions for θ=0𝜃superscript0\theta=0^{\circ} and θ=180𝜃superscript180\theta=180^{\circ} are indicted by red and purple arrows in (b).

IV IV. Comparation with bi-layer MoS2 and black phosphorus

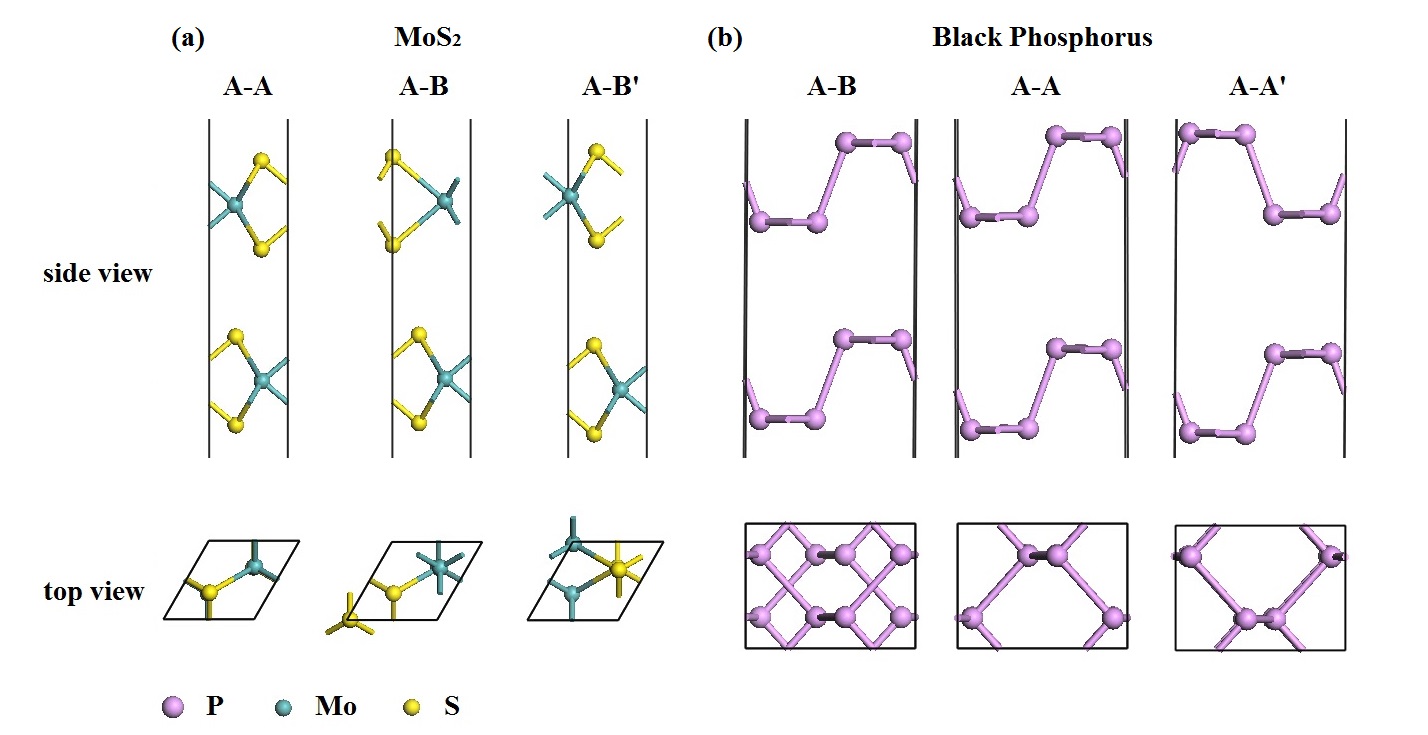
We have compare BLBP with other corrugated bi-layer materials MoS2 and black phosphorus. Fig. S4 shows the top view and side view of different stacking configurations of MoS2 and black phosphorus. One can see that MoS2 has similar structure with blue phosphorus (Fig. S4(a)), which belongs to the graphene-like structures. As shown in Fig. 5, similar with BLBP, Egapsubscript𝐸𝑔𝑎𝑝E_{gap} of bi-layer MoS2 can be fitted with E=E0βdz2𝐸subscript𝐸0𝛽superscriptsubscript𝑑𝑧2E=E_{0}-\beta d_{z}^{-2}. In contrast, the corrugation of black phosphorus is very large as shown in Fig. S4(b), therefore the unified Egapdz2proportional-tosubscript𝐸𝑔𝑎𝑝superscriptsubscript𝑑𝑧2E_{gap}\propto d_{z}^{-2} trend for different stacking configuration fails.

Refer to caption
Figure S4: (color online)The side view and top view of atomic structure of A-A, A-B, and A-B’ stacking MoS2 and black phosphorus.

References

  • (1) W. A. Harrison, Electronic Structure and Properties of Solids (Freeman, San Francisco, 1980).