Extragalactic large-scale structures in the northern Zone of Avoidance
Abstract
We used the Nançay Radio Telescope (NRT) to measure the 21 cm line emission of near-infrared bright galaxies in the northern Zone of Avoidance (ZoA) without previous redshift determinations. We selected galaxies with extinction-corrected magnitudes from the 2MASS Extended Source Catalog. These data will complement the existing 2MASS Redshift Survey (2MRS; first data release) as well as the ongoing 2MASS Tully-Fisher survey, both of which exclude the inner ZoA (), where the identification of galaxy candidates is the hardest. Of the 1000 identified 2MASX galaxy candidates we have so far detected 252 to our 3.0 mJy rms sensitivity limit and the velocity limit of 10500 km s-1. The resulting redshift distribution reveals various new structures that were hitherto uncharted. They seem to form part of the larger Perseus-Pisces Supercluster (PPS). The most conspicuous is a ridge at about , km s-1. Within this wall-like structure, two strong radio galaxies (3C 129 and 3C 129.1) are embedded which lie at the same distance as the ridge. They seem to form part of an X-ray cluster. Another prominent filament has been identified crossing the ZoA at , hence suggesting the second Perseus-Pisces arm is more extended than previously thought.
1 Introduction
Dust extinction and high stellar densities in the Galactic Plane block a large fraction of the sky resulting in the so-called Zone of Avoidance (ZoA) [1]. Compared to the optical, the near-infrared (NIR) is much less affected by the dust obscuration. A whole-sky near-infrared () imaging survey exists in the form of the 2-Micron All Sky Survey (2MASS)[2]. The resulting extended source catalogue, 2MASX, with its 1.6 million sources complete to [3], provides the most uniform and deep NIR sample of the whole sky. Although 2MASX suffers little from dust extinction, there remains an “NIR ZoA” caused by stellar crowding around the Galactic bulge ( 90∘) [1].
To analyse the large-scale galaxy distribution over the entire sky, the optical 2MASS Redshift Survey (2MRS) was started about a decade ago. The first data release is complete to [4], the second to [5]. Both versions do exclude, however, the inner ZoA () because of the inherent difficulties in getting good signal-to-noise (SNR) optical spectra for these heavily obscured galaxies. While the 2MRS is currently the deepest ”whole-sky” redshift survey for mapping large-scale structures, and studying the dynamics in the nearby Universe and the CMB dipole [6], the lack of redshift data in the ZoA remains an obstacle. This also holds for the 2MASS Tully Fisher survey (2MTF) which uses a subsample of sufficiently inclined 2MASX spiral galaxies to study cosmic flow fields [7].
To improve on this we have started a project to systematically observe in H I all likely 2MASX galaxies in the “2MRS ZoA” without previous redshift information. The line emission from neutral hydrogen (H I) at the radio wavelength of 21 cm can travel unhindered through the thickest dust layers of the Milky Way. Targeting ZoA galaxies with a radio telescope will therefore allow us to obtain redshifts for gas-rich 2MASS galaxies. We used the 100m-class Nançay Radio Telescope (NRT) for pointed observations of all ZoA galaxies with Dec . We were particularly interested in filling in the northern ZoA because – contrary to the southern ZoA – most of the northern ZoA has not been surveyed in any systematic way before. For the southern hemisphere a blind H I survey has been performed with the Parkes Multi-Beam receiver (HIZOA) which covers for the longitude range out to velocities of 12700 km s-1 (rms mJy)[8], [9]. For the remaining ZoA () hardly any data are available (see e.g. the top panel of Fig.1).
2 Filling in the redshift gap in the ZoA
2.1 Sample selection
To start filling in the northern redshift gap we first extracted all extended sources from 2MASX with and extinction-corrected magnitudes , i.e., the completeness limit of the first 2MRS catalogue and the 2MTF. Of the 4743 extended sources accessible to the NRT (Dec ), we classified 2546 sources as clear galaxies (plus 42 as possible galaxies) by visually inspecting the Digitized Sky Survey (DSS)111http://stdatu.stsci.edu/dss/ images in the , and bands, the 2MASS and -bands, as well as the 2MASX colour images. From that sample we excluded galaxies that already had redshift measurements by cross-correlating our catalogue with NED and unpublished data sets like 2MRS (Macri, priv comm), HIZOA (Kraan-Korteweg et al, priv comm), etc.
The final NRT target sample consists of 1000 near-infrared bright galaxy candidates in the ZoA (; ); the great majority ( 83%) of them are located in the strip. We have already used 1200 hours of observing time with the NRT for pointed observations of these objects since mid-2009.
2.2 Observations and data reduction
The galaxy candidates were observed with the NRT in position-switching mode. Pairs of equal-duration ON/OFF-source integrations were made, with the OFF-source position 20′ east of the target. Candidates were typically observed for 40-minute long periods till an rms noise level of 3.0 mJy was reached. Because none of the target galaxies have prior redshift information, the auto-correlator was set to cover a radial velocity range of 500 to 10500 km s-1. The original resolution is 2.6 km s-1, which is later smoothed to 18 km s-1 for further analysis. Observations were made simultaneously in two linear polarizations, to gain sensitivity. Data reduction and Radio Frequency Interference (RFI) recognition and mitigation were performed using the NAPS and SIR data reduction packages, developed by the NRT staff.
2.3 Results
From July 2009 to March 2012, we observed 926 out of the total of 1000 target galaxies to an rms level of 3.0 mJy. The resulting spectra were first inspected by eye by one of us for the signature of redshifted Galactic H I-emission. The reliability of all potential H I detections was then assessed independently by three other team members, followed by an adjudication by another team member. Clear detections, and non-detections which had reached our target rms noise level of 3.0 mJy were filed as such, whereas marginal or possible detections were tagged for re-observation, whose results were continuously updated.
This has led to 252 solid detections so far out of the 926 observed targets, i.e., a detection rate of 27%. This is a respectable detection rate given that no pre-selection was made according to morphological type (which is not straightforward in the NIR, nor in the ZoA). The mean rms in the final spectra was found to be 2.9 mJy. The 252 detected H I profiles have a peak signal-to-noise ratio .
A reliable detection was found to have a typical linewidth- and flux-dependent signal-to-noise ratio as defined in the Arecibo Legacy Fast ALFA survey of SNR [10]. Detections with typically were adjudicated as marginal.
3 Resulting large-scale structures
While we find galaxies over the entire observed redshift range, the majority lie within km s-1. The velocity histogram (not shown here) shows a clear peak at 6000 km s-1, probably due to the prevalence of galaxies connected to the Perseus-Pisces Supercluster (PPS) described below. There is a noticeable drop-off in detections around km s-1 which is due to a combination of recurring RFI at km s-1 and limited telescope sensitivity.
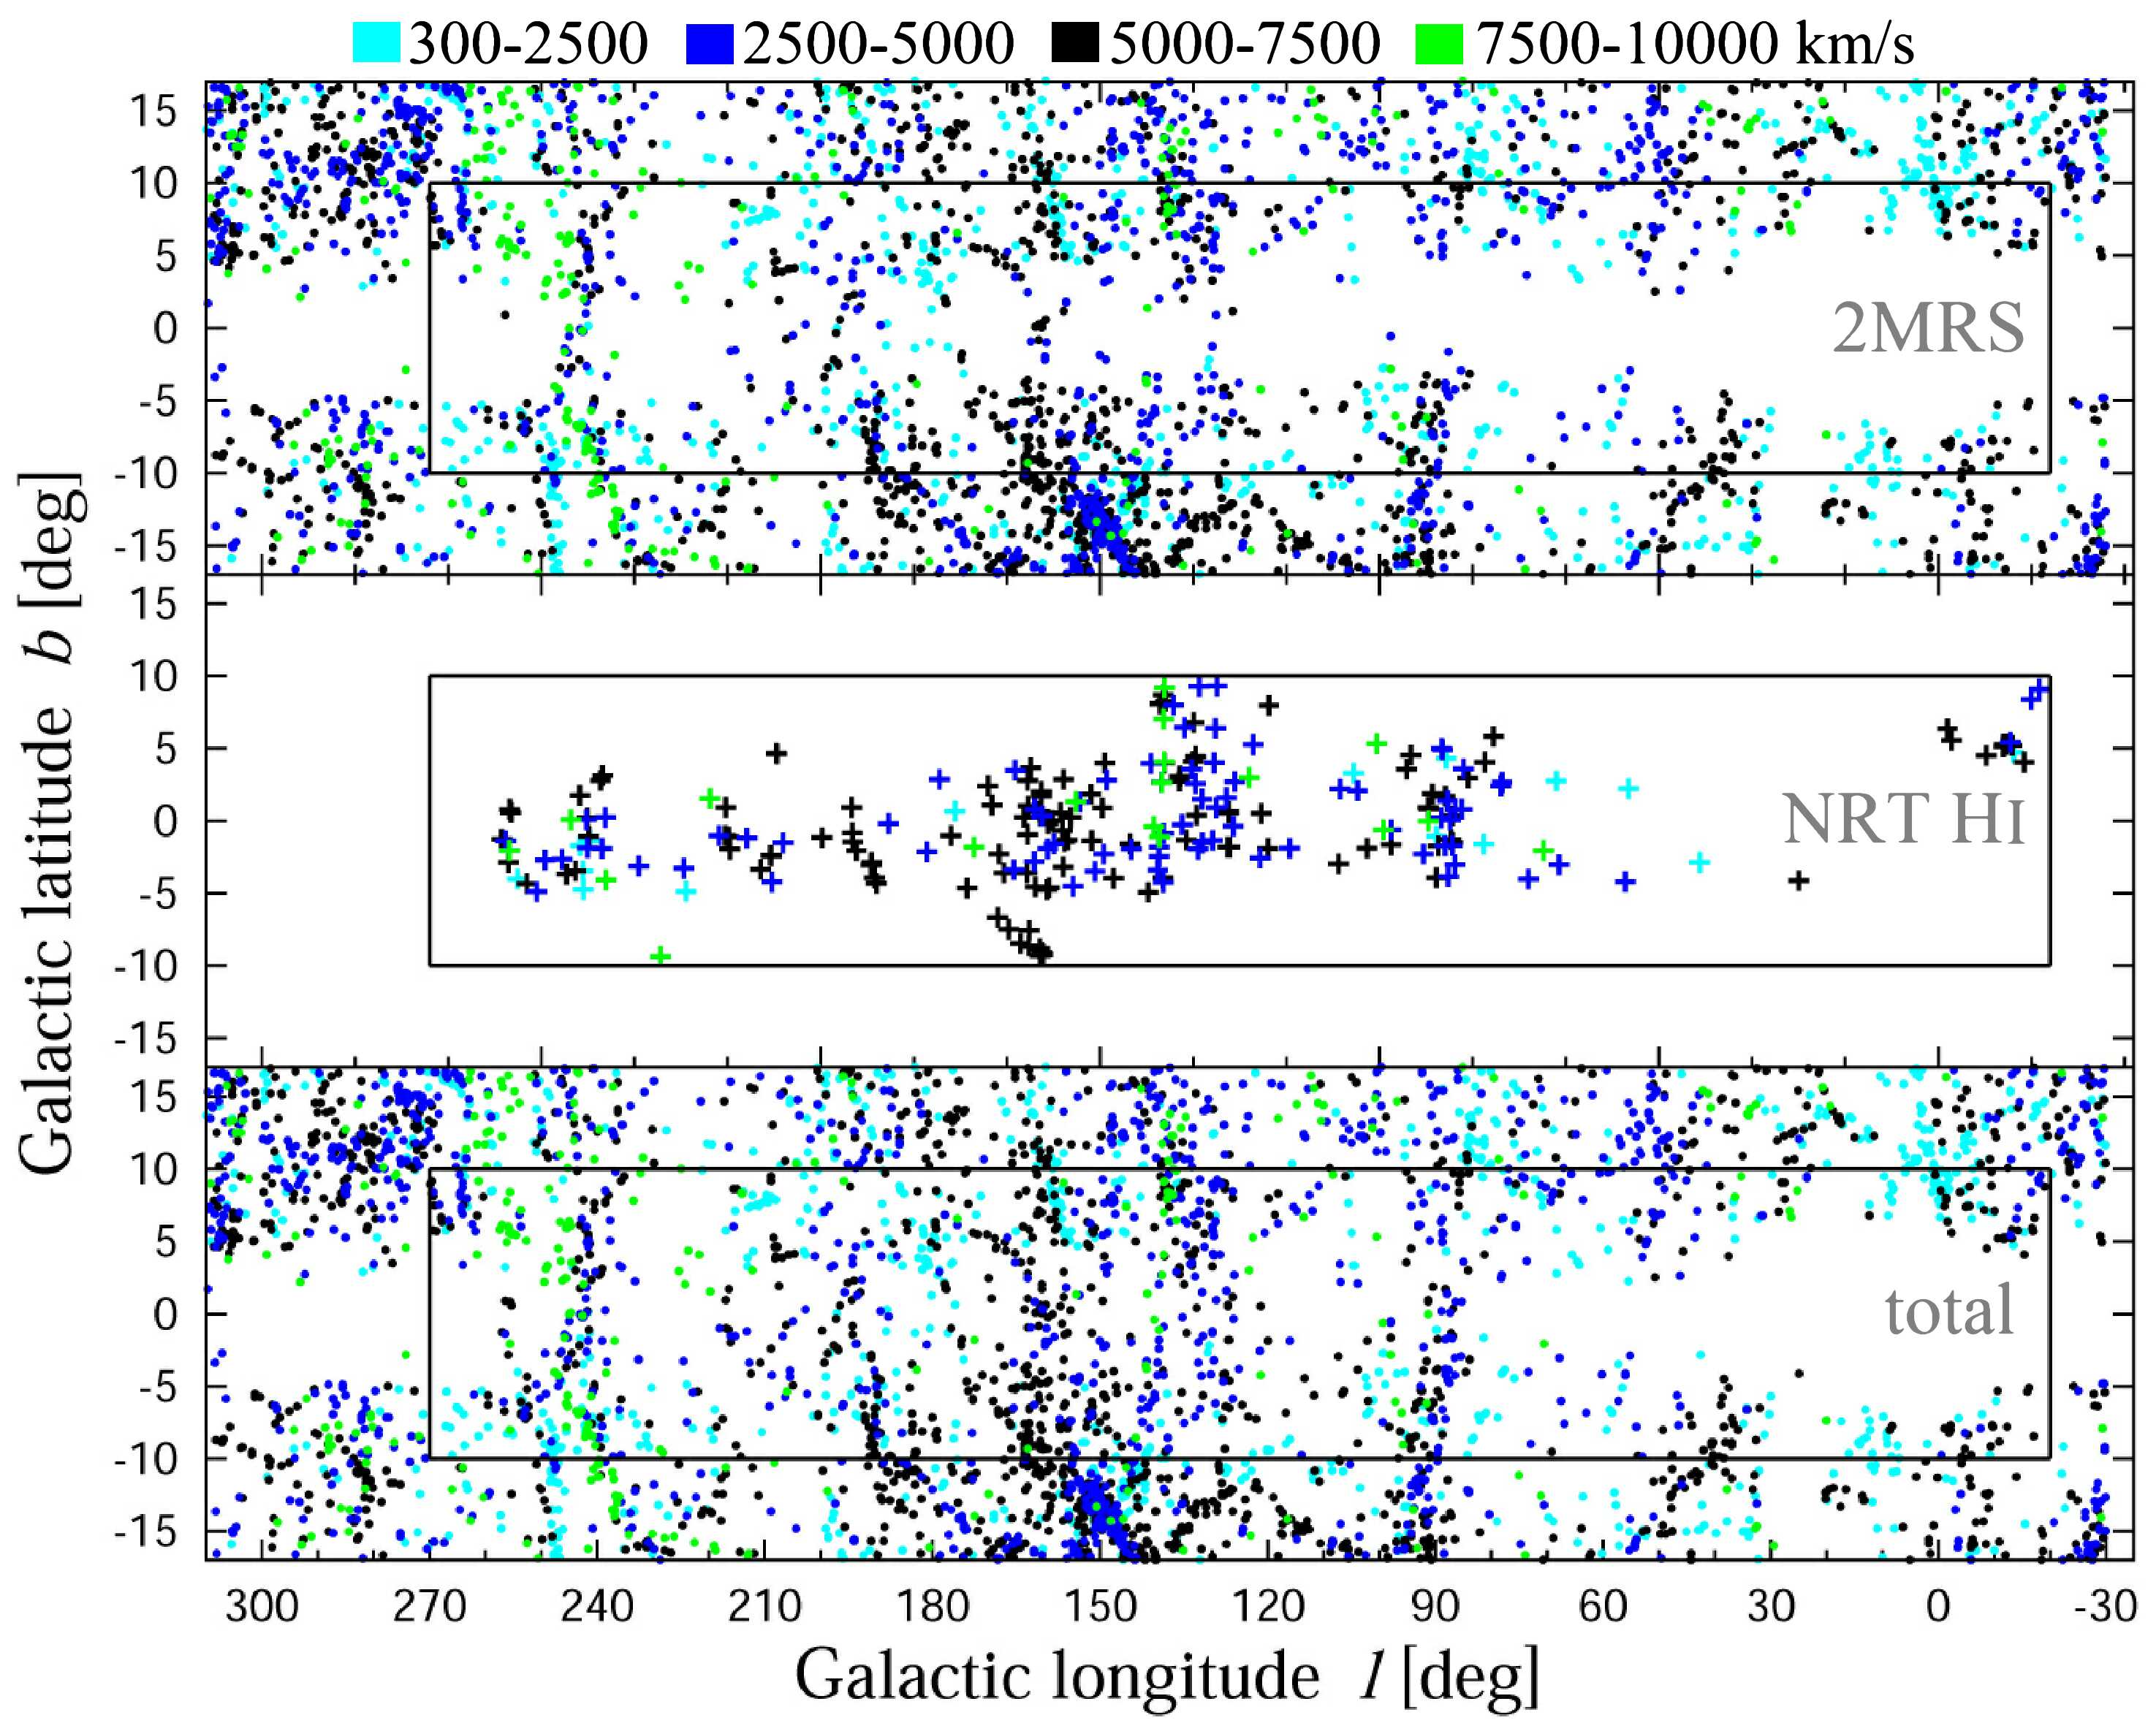
The new H I detections are distributed almost symmetrically about the Galactic equator, irrespective of Galactic latitude (see the middle panel of Fig. 1), confirming that the detection rate is independent of extinction and star density.
To investigate the large-scale structures revealed by these new detections we plot in Fig. 1 their spatial distribution in Galactic coordinates centred on the northern Milky Way. It includes 2MRS data up to latitudes of to test for continuity of the newly identified features with previously known structures (filaments, walls, voids) at higher Galactic latitudes. The outlined rectangular region demarcates the NRT survey area.
The top panel shows the 2MRS galaxies with , as well as data in the strip from the Zcat () compilation by Huchra (priv comm). The middle panel displays the distribution of the 252 NIR-bright 2MASX galaxies detected with the NRT. In the bottom panel the new detections have been merged with previously known data of objects to the completeness limit. In all three panels galaxies are colour-coded by velocity: the km s-1 velocity range is shown in cyan, km s-1 in blue, km s-1 in black and the km s-1 range in green. The black and blue colours coincide with the approximate velocity range of the PPS.
When comparing the bottom and top panels (i.e., the status before and after the NRT observations) the power of revealing previously unknown large-scale structures in the ZoA through H I observations of intrinsically bright (extinction-corrected) NIR galaxies is quite obvious. Several prominent filaments and walls are now seen to cross the ZoA which were previously not – or at most marginally – visible. The most obvious filamentary structures cross the Galactic Plane at (Cygnus), (Cassiopeia), (Perseus), , as well as the Puppis filament at [11]. An underdense region of galaxies is apparent at and , stretching from to 7000 km s-1. The 2MASX finds no galaxies in regions of high stellar densities, such as around the Galactic Bulge, therefore the ZoA for remains unsampled. In the next sections we will discuss only two of the most striking newly revealed features in more detail, namely the ones at and .
3.1 The Perseus extension of the second Perseus-Pisces arm
The first region of interest is seen in the constellation of Cygnus around 90∘. It shows a very prominent filament that can be traced from below the Plane at extending up to the other side of the ZoA at a slight angle to . This filament seems to form part of the second (eastern) PPS arm that emanates southwards from the Perseus A 426 cluster (,b) (150∘,-13∘), then bends backwards towards the Galactic plane (at about ; not shown here) and re-enters the plot at about . Most previous studies of the PPS assumed it to kind of stop and dissolve around as no signature was found of it in earlier optical galaxy searches [12], nor any indication of a continuation on the other side of the obscuring ZoA band. Our data clearly confirms such a continuation. It implies the eastern Perseus-Pisces chain to be considerably larger than evidenced in any previous survey of the PPS complex.
3.2 A potentially massive cluster
The second prominent feature is a concentration of H I-detections at right in the middle of the ZoA (). It lies within a nearly vertical (in Fig. 1) wall-like structure (at km s-1 in velocity space) and can be traced across the full width of the ZoA. It is interesting to note that within this wall, at the core of the galaxy concentration, we find two very strong radio galaxies. Their position and redshifts (6236 and 6655 km s-1 respectively; [13]) confirm that they reside inside the galaxy concentration. These are the head-tail radio source (3C 129) and the double-lobed giant elliptical radio galaxy (3C 129.1). The presence of such radio sources with bent lobe morphology usually is indicative of a rich cluster environment.
Focardi et al (1984) [14] were the first to put forward the idea of an extension of the PPS Complex across the ZoA towards the northern Galactic hemisphere that would link the Perseus cluster (A 426; km s-1) to Abell 569 ( km s-1). It would traverse the Galactic Plane at the location of the two bright radio galaxies, which also coincides with the location where Weinberger (1980) ([15]) found an excess of galaxies in his early optical search (at ). This connection has been much debated over the years (e.g., [16], [17], [18]), but no conclusive results were found due to the lack of (redshift) data in this dust-enshrouded region.
The suspicion that 3C 129 and 3C 129.1 form part of a massive cluster was later substantiated through the identification of the X-ray cluster CIZA J0450.0+4501 ([19]). The radio sources lie within the X-ray emission of the CIZA cluster and are at the same distance. With an X-ray luminosity of herg s-1 this cluster is not among the brightest X-ray sources in ROSAT. For comparison, its flux is about 20% that of the Norma cluster A 3627, the central cluster of the Great Attractor [20] – which, as an aside, also hosts 2 radio sources, the central one a wide-angle tail source and the other also a head-tail source. With regards to the X-ray flux it should be noted, however, that the intervening high gas column density ( cm-2) in the Galaxy may well have reduced the flux of the low energy X-ray photons in the ROSAT keV band, resulting in an underestimate of its luminosity. The cluster might therefore be more massive than its X-ray luminosity suggests. Despite its possible connection with the wider PPS complex, it has not received much attention since.
4 Conclusions and future perspectives
The 252 H I detections in this previously unexplored northern region of the ZoA have revealed new and interesting structures that are clearly associated with the Perseus Pisces Supercluster. These new structures at 90∘ and 160∘ seem to imply that the PPS is more extended than previously thought and potentially much more massive, with the newly identified cluster in the 160∘ filament described in Sect. 3.2. This may well have implications for our understanding of the dynamics and flow-fields observed in this region, such as the tug of war between the PPS and the Great Attactor [21, 22, 23] .
To learn more about the 160∘ cluster’s role in, and its mass contribution to the PPS, and its relation to the observed local flow fields, we recently put in a proposal – and have been allocated time - to conduct a deep H I imaging survey over a area (mosaicked) around this cluster with the Westerbork Synthesis Radio Telescope (WSRT).
Acknowledgements
This work is based upon research supported by the National Research Foundation and Department of Science and Technology. MR is grateful for the bursary provided by the South African SKA Project Office. This publication makes use of data products from the Two Micron All Sky Survey, which is a joint project of the University of Massachusetts and the Infrared Processing and Analysis Center, funded by the National Aeronautics and Space Administration and the National Science Foundation.
References
References
- [1] Kraan-Korteweg R C 2005 Reviews in Modern Astronomy (Reviews in Modern Astronomy vol 18) ed S Röser pp 48–75
- [2] Skrutskie M F, Cutri R M, Stiening R, Weinberg M D, Schneider S, Carpenter J M, Beichman C, Capps R, Chester T, Elias J, Huchra J, Liebert J, Lonsdale C, Monet D G, Price S, Seitzer P, Jarrett T, Kirkpatrick J D, Gizis J E, Howard E, Evans T, Fowler J, Fullmer L, Hurt R, Light R, Kopan E L, Marsh K A, McCallon H L, Tam R, Van Dyk S and Wheelock S 2006 AJ 131 1163–1183
- [3] Jarrett T H, Chester T, Cutri R, Schneider S E and Huchra J P 2003 AJ 125 525–554
- [4] Huchra J, Jarrett T, Skrutskie M, Cutri R, Schneider S, Macri L, Steining R, Mader J, Martimbeau N and George T 2005 Nearby Large-Scale Structures and the Zone of Avoidance (ASP conf. vol 329) ed A P Fairall & P A Woudt p 135
- [5] Huchra J P, Macri L M, Masters K L, Jarrett T H, Berlind P, Calkins M, Crook A C, Cutri R, Erdoǧdu P, Falco E, George T, Hutcheson C M, Lahav O, Mader J, Mink J D, Martimbeau N, Schneider S, Skrutskie M, Tokarz S and Westover M 2012 ApJS 199 26
- [6] Kraan-Korteweg R C and Lahav O 2000 A&A Rev. 10 211–261
- [7] Masters K L, Springob C M and Huchra J P 2008 AJ 135 1738–1748
- [8] Henning P A, Springob C M, Minchin R F, Momjian E, Catinella B, McIntyre T, Day F, Muller E, Koribalski B, Rosenberg J L, Schneider S, Staveley-Smith L and van Driel W 2010 AJ 139 2130–2147
- [9] Donley J L, Staveley-Smith L, Kraan-Korteweg R C, Islas-Islas J M, Schröder A, Henning P A, Koribalski B, Mader S and Stewart I 2005 AJ 129 220–238
- [10] Saintonge A 2007 AJ 133 2087–2096
- [11] Kraan-Korteweg R C and Huchtmeier W K 1992 A&A 266 150–166
- [12] Seeberger R, Huchtmeier W K and Weinberger R 1994 A&A 286 17–24
- [13] Spinrad H 1975 ApJL 199 L1
- [14] Focardi P, Marano B and Vettolani G 1984 A&A 136 178–180
- [15] Weinberger R 1980 A&AS 40 123–127
- [16] Chamaraux P, Cayatte V, Balkowski C and Fontanelli P 1990 A&A 229 340–350
- [17] Lu N Y and Freudling W 1995 ApJ 449 527
- [18] Pantoja C A, Altschuler D R, Giovanardi C and Giovanelli R 1997 AJ 113 905–936
- [19] Ebeling H, Edge A C, Bohringer H, Allen S W, Crawford C S, Fabian A C, Voges W and Huchra J P 1998 MNRAS 301 881–914
- [20] Kraan-Korteweg R C, Woudt P A, Cayatte V, Fairall A P, Balkowski C and Henning P A 1996 Nature 379 519–521
- [21] Scharf C, Hoffman Y, Lahav O and Lynden-Bell D 1992 MNRAS 256 229–237
- [22] van de Weygaert R and Hoffman Y 2000 Cosmic Flows Workshop (Astronomical Society of the Pacific Conference Series vol 201) ed Courteau S and Willick J p 169 (Preprint astro-ph/9909103)
- [23] Erdoǧdu P, Huchra J P, Lahav O, Colless M, Cutri R M, Falco E, George T, Jarrett T, Jones D H, Kochanek C S, Macri L, Mader J, Martimbeau N, Pahre M, Parker Q, Rassat A and Saunders W 2006 MNRAS 368 1515–1526 (Preprint astro-ph/0507166)