neumaier,wecancompute^Relaxedi=(ViR12⊤R11(R11⊤R11)-1)⊤,=(ViR12⊤R11R11-1(R11⊤)-1)⊤,=(ViR12⊤(R11⊤)-1)⊤,=(Vi(R11-1R12)⊤)⊤,whichcanbeevaluatedwithatriangularsolver,hencedoesnotrequireexplicitmatrixinversion.IntheeventthatKispoorlyconditioned,toimprovenumericalstability,weaddasmallridgepenalty.ItissuggestedbyneumaiertoaddapenaltycorrespondingtoscalingadiagonalmatrixDconsistingoftheEuclideannormsofthecolumnsofKby(ri2+ri+1)ϵmachine,inwhichϵmachinedenotesmachineprecision.ThefullrefittingalgorithmisdetailedinAlgorithm3.
Appendix D StockandWatsonApplication
| Group | Brief description | Examples of series | Number |
|---|---|---|---|
| of series | |||
| 1 | GDP components | GDP, consumption, investment | 20 |
| 2 | IP | IP, capacity utilization | 15 |
| 3 | Employment | Sectoral and total employment and hours | 20 |
| 4 | Unemployment rate | Unemployment rate, total and by duration | 7 |
| 5 | Housing | Housing starts, total and by region | 6 |
| 6 | Inventories | NAPM inventories, new orders | 6 |
| 7 | Prices | Price indexes, aggregate and disaggregate; commodity prices | 52 |
| 8 | Wages | Average hourly earnings, unit labor cost | 9 |
| 9 | Interest rates | Treasuries, corporate, term spreads, public-private spreads | 14 |
| 10 | Money | M1, M2, business loans, consumer credit | 8 |
| 11 | Exchange rates | Average and selected trading partners | 5 |
| 12 | Stock prices | Various stock price indexes | 5 |
| 13 | Consumer expectations | Michigan consumer expectations | 1 |
stockdataset.Abriefdescriptionofeachvariable,alongwiththetransformationcodetomakethemapproximatelystationarycanbefoundintheDataAppendixofkoop.
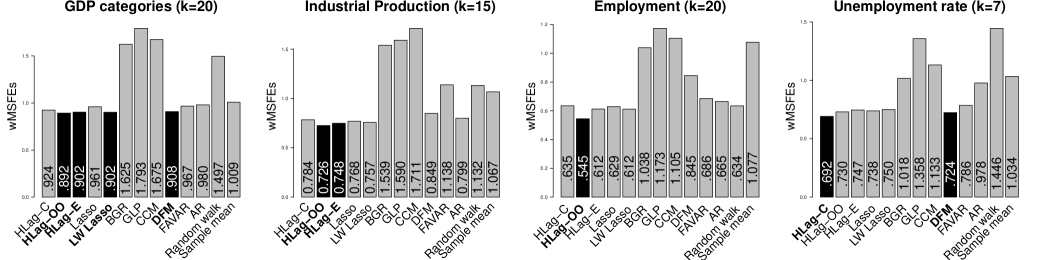
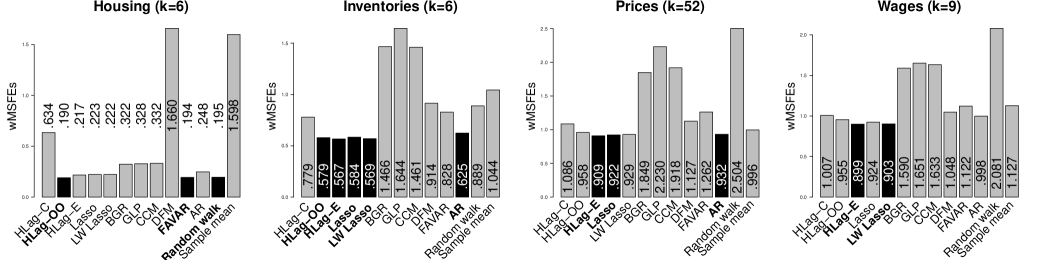
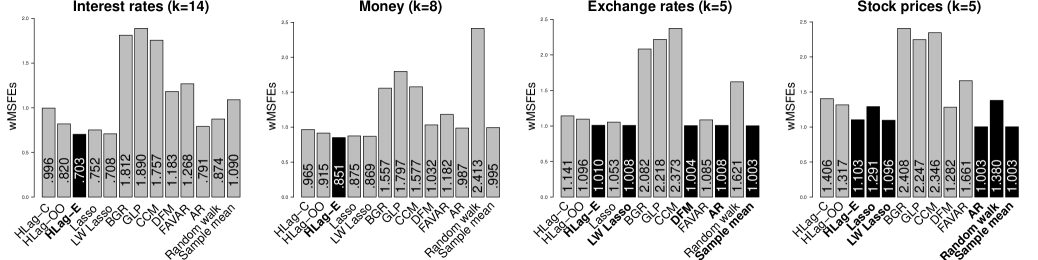
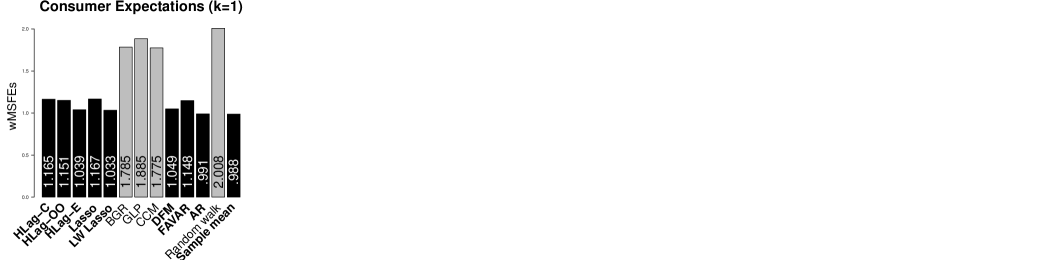
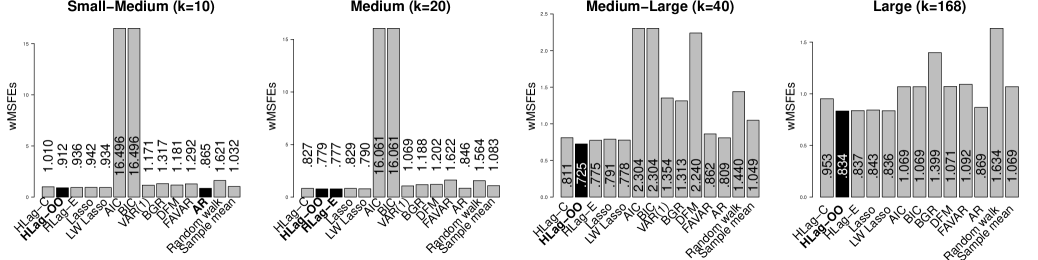
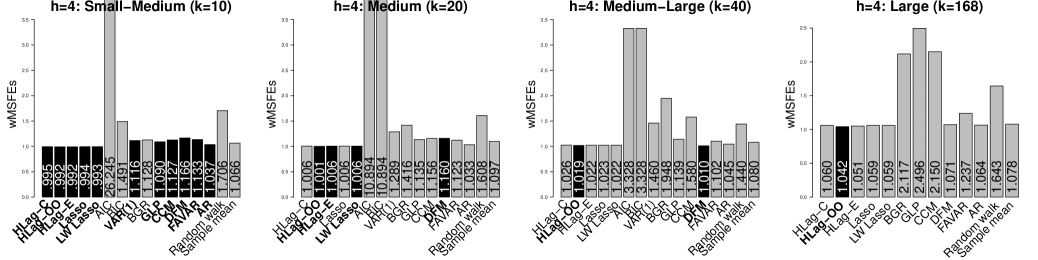
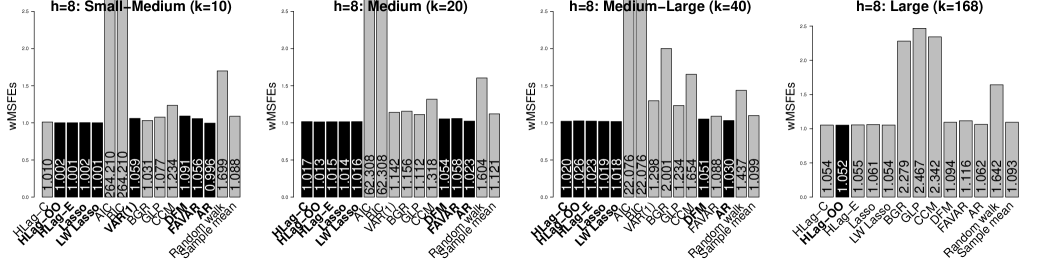
6.ThegoodperformanceoftheHLagmethodsacrossallvariablesisconfirmedbyasub-analysisonthe13macroeconomiccategories.Figure18breaksdowntheresultsoftheLargeVARbythe13macroeconomiccategories.Generallyspeaking,theflexibleelementwiseHLagisthebestperformingforecastingmethod;for10outof13categories,itisincludedintheMCS.Thesecondbestperformingmethodsareown-otherHLagandthelag-weightedlasso(bothfor6outof13categoriesintheMCS).
stock12,wefindmultivariateforecastmethodstoprovidenomeaningfulreductionsoversimpleunivariatemethods(ARorsamplemean).
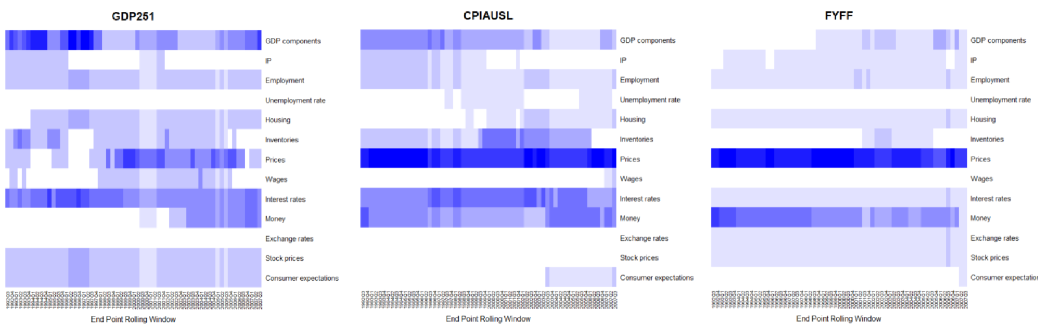
McCracken2016.WehaveperformedthesameempiricalanalysisontheFRED-QDcontainingk=210variablesfromQuarter3,1959toQuarter4,2018(T=238).Similarfindingsareobtained:(i)Own-otherandelementwiseHLagperformcomparabletothelassomethodsandARforsmallVARsizes,butoutperformallothersfortheLargeVARandashortforecasthorizon.(ii)Own-otherHLagisthepreferredforecastmethodforseveralmajormacroeconomicindicatorssuchasnationalincomeandproductaccountsandindustrialproduction.Fordifficulttopredictindicators,suchasexchangerates,gainsovertheARmodelaredifficulttoattain.
Appendix E FinancialApplication
Thefinancialdatasetcontainsinformationontherealizedvariancesofk=16stockmarketindiceslistedinTable7.Alltimeseriesarelog-transformedtomakethemstationary.
| Variable | Description | |
|---|---|---|
| AEX | Amsterdam Exchange Index | |
| AORD | All Ordinaries Index | |
| BFX | Belgium Bell 20 Index | |
| BVSP | BOVESPA Index | |
| DJI | Dow Jones Industrial Average | |
| FCHI | Cotation Assistée en Continu Index | |
| FTSE | Financial Times Stock Exchange Index 100 | |
| GDAXI | Deutscher Aktienindex | |
| HSI | HANG SENG Index | |
| IXIC | Nasdaq stock index | |
| KS11 | Korea Composite Stock Price Index | |
| MXX | IPC Mexico | |
| RUT | Russel 2000 | |
| SPX | Standard & Poor’s 500 market index | |
| SSMI | Swiss market index | |
| STOXX50E | EURO STOXX 50 |