Critical Flow and Dissipation in a Quasi-One-Dimensional Superfluid
Abstract
In one of the most celebrated examples of the theory of universal critical phenomena, the phase transition to the superfluid state of 4He belongs to the same three dimensional universality class as the onset of ferromagnetism in a lattice of classical spins with symmetry. Below the transition, the superfluid density and superfluid velocity increase as power laws of temperature described by a universal critical exponent constrained to be equal by scale invariance. As the dimensionality is reduced towards one dimension (1D), it is expected that enhanced thermal and quantum fluctuations preclude long-range order, thereby inhibiting superfluidity. We have measured the flow rate of liquid helium and deduced its superfluid velocity in a capillary flow experiment occurring in single nm long nanopores with radii ranging down from 20 nm to 3 nm. As the pore size is reduced towards the 1D limit, we observe: i) a suppression of the pressure dependence of the superfluid velocity; ii) a temperature dependence of that surprisingly can be well-fitted by a powerlaw with a single exponent over a broad range of temperatures; and iii) decreasing critical velocities as a function of radius for channel sizes below nm, in stark contrast with what is observed in micron sized channels. We interpret these deviations from bulk behaviour as signaling the crossover to a quasi-1D state whereby the size of a critical topological defect is cut off by the channel radius.
pacs:
47.61.-k, 67.25.bf, 67.25.dg, 67.25.drHelium is the only known element in nature that becomes a superfluid, with its small mass and high symmetry cooperating to prevent solidification at atmospheric pressure as the temperature approaches absolute zero. For 4He, the ability to flow without viscosity below the -transition temperature, , is a paradigmatic manifestation of emergent phenomena and macroscopic quantum coherence, driven by both strong interactions and bosonic quantum statistics. Its superflow with velocity is caused by a quantum-mechanical phase gradient of the wave function and a priori should only be limited by the Landau criterion of superfluidity, due to the roton minimum in the helium excitation spectrum. However, years of experiments VAROQUAUX06 have shown that superfluid 4He exhibits a critical velocity that is well below . The exact microscopic mechanism by which a superfluid dissipates energy remains a major unsolved problem in condensed matter physics.
At a first glance, it would appear that this problem would only be exacerbated as the number of spatial dimensions decreases, as enhanced thermal and quantum fluctuations should push . However, in the one dimensional limit, the universal quantum hydrodynamics of Luttinger liquid theory HALDANE81 ; AFFLECK11 should apply, providing a host of theoretical predictions including the simultaneous algebraic spatial decay of both density-density and superfluid correlation functions. While there is a body of evidence of this exotic behaviour in low dimensional electronic systems ISHII2003 ; YACOBY2005 ; RITCHIE2009 ; LAROCHE2013 and ultracold low density gases CAZALILLA2011 , the analogous behaviour has yet to be confirmed experimentally in a highly-correlated bosonic fluid. Here, the physics of superflow should be qualitatively altered, with the superfluid density acquiring strong system size and frequency dependence EGGEL11 . Furthermore, neutral massflow transport properties should be strongly modified in one dimension, with the superfluid velocity exhibiting non-universal power law dependence on temperature and pressure. This crossover towards one dimension is manifest in the main findings of our work: (I) a suppression of the pressure dependence of for indicative of enhanced dissipation via phase slips, (II) a temperature dependence for that can be described by a powerlaw with a single exponent over a broad range of temperatures, and (III) decreasing critical velocities as a function of radius for channel sizes below nm; behaviour strongly deviant from what is observed in micron sized channels.
In this work, the mass flow rate of superfluid helium is measured in a capillary experiment through channels with radii as small as nm and lengths . To determine the effective dimensionality of this geometry, it is imperative to perform a comparative analysis of all possible relevant length scales. Unlike superconductors and superfluid 3He which undergo a BCS pairing, 4He has a very small coherence length, on the angstrom scale: , with and , making it technically difficult to fabricate a transverse confinement dimension with approaching the truly one dimensional limit, as, for example, nm in the temperature range considered here. For , can also be compared to the thermal de Broglie wavelength, and a thermal length nm, where is the first sound velocity of 4He. An alternative measure of one-dimensionality can be obtained by computing the thermal energy needed to populate transverse angular momentum states for a single helium atom confined inside a long hard cylinder of radius : for . These estimates, which mostly neglect interaction effects, would place our flow experiments in a mesoscopic regime, with confinement length and energy scales on the order of the intrinsic ones in the problem. However, recent ab initio simulations of 4He confined inside nanopores KULCHTSKYY ; POLLET2014 have demonstrated that classical adsorption behaviour leads to an effective phase separation, between a quasi-1D superfluid core of reduced radius and concentric shells of quasi-solid helium near the pore walls. This effect, which is likely also present in our channels, would tend to provide additional confinement, allowing us to approach an effectively quasi-one-dimensional state.
Previous investigations of helium confined at the nanometer scale have focused on porous media such as in Vycor REPPY1999 and more recently in the zeolites and other mesoporous media. These studies have shown a possible new thermodynamic phase of 4He stabilized at low temperature TODA2007 as well a nuclear magnetic resonance signature (NMR) of a one-dimensional crossover for 3He YAGER2013 . While these advances are certainly considerable in the search for a strongly-interacting 1D neutral quantum liquid, our approach differs much in spirit from those cited above. In our experiment, the helium atoms are confined inside a single, nearly cylindrical pore, rather than in an extremely large number of them necessary to gain signal for a macroscopic probe. This lone pore, or channel, is tailor-made from a pristine Si3N4 membrane that can be fabricated with radii ranging from . The main advantage of our approach is that there is no ensemble averaging over pore distributions and/or potential defects of the sample. Its main drawback, however, is that traditional bulk measurement techniques, such as specific heat or NMR most likely cannot be performed in a single nanopore containing only 104 to helium atoms. Taken as a whole, these two approaches are complementary to one another and similar in spirit to “bottom-up vs. top-down” or “single-molecule vs. ensemble averaged” studies in other fields, such as nanoelectronics or molecular biology.


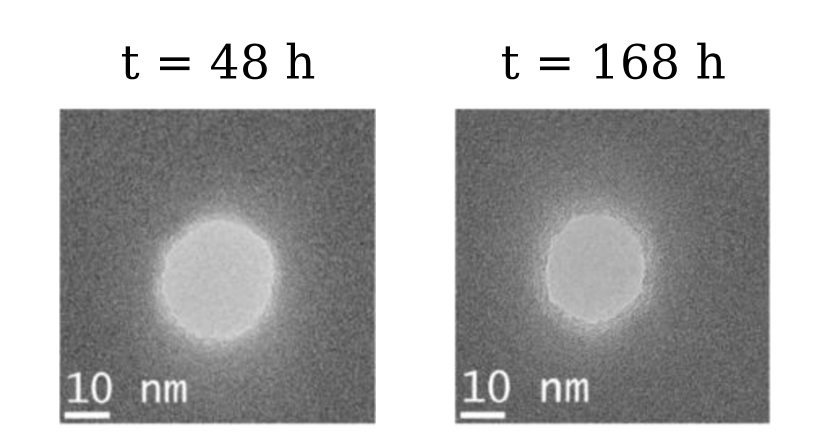
The experiment is configured in a similar fashion, and follows the same procedure as previously reported in Ref. SAVARD2011 . However, the present work is performed in a newly-designed experimental cell made out of coin silver and shown in Fig. 1(A). The single nanopores were fabricated in the Si3N4 membrane using an electron beam from a Field-Effect Transmission Electron Microscope (FE-TEM), with images taken shortly after fabrication shown in Fig. 1. While the single pores have a well-defined diameter, we have observed in previous work that their structure has a tendency to relax at room temperature, with the pore radius decreasing as a function of time (see supplementary information). To circumvent the uncertainty in the pore dimension, Knudsen effusion measurements in the gas phase of helium were conducted at low temperature (77 K) using the protocol discussed in Ref. SAVARD2009 . The respective values obtained for each of the pores were determined to be nm and nm (see supplementary information).
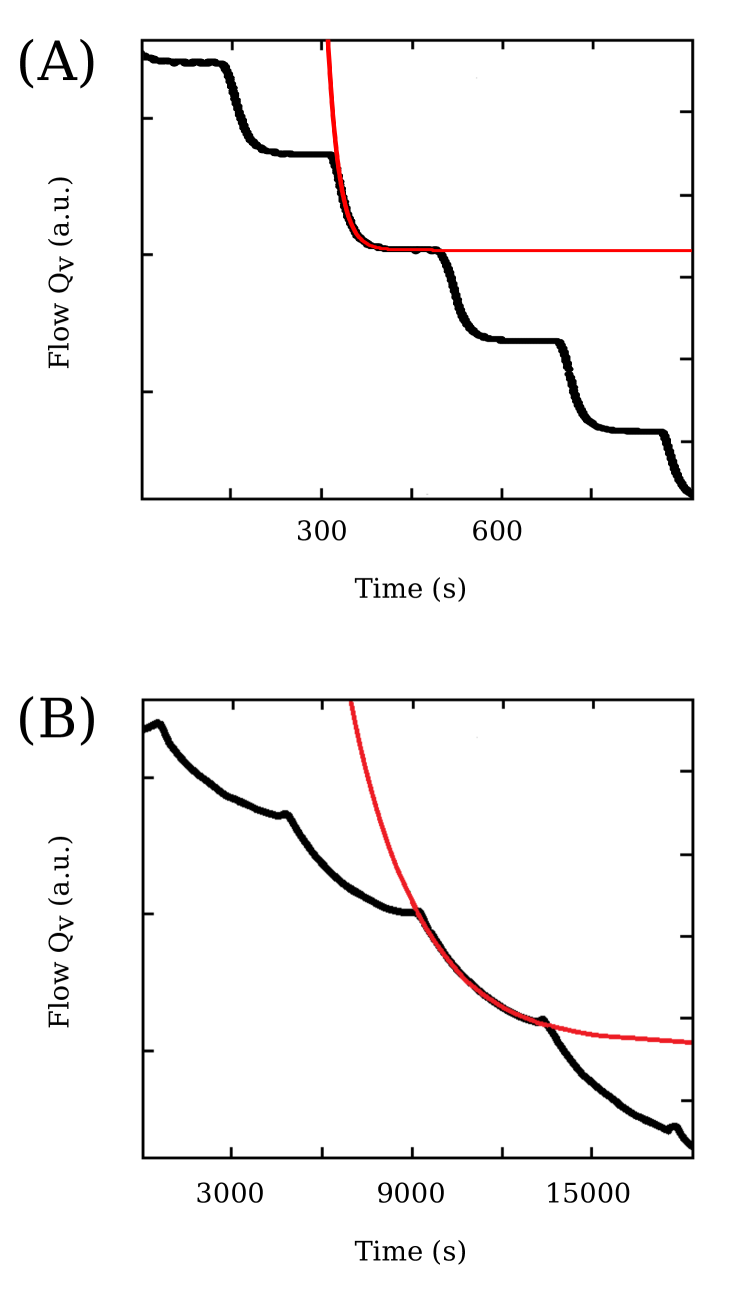
In a second step, the experimental cell was cooled down to liquid helium temperature (below 4.5 K). Above , in the normal phase of helium, the flow through the nanopore is viscously dissipative, and expected to follow the model developed for a short pipe by Langhaar LANGHAAR42 . In this phase, we have conducted pressure sweeps at constant temperature while monitoring the mass flow rate , as shown in Fig. 2(A) and (B). In the absence of a chemical potential difference, the mass flow rate should go to zero. However, we observe a spurious signal as arising from evaporation at the walls of the channel. To determine this offset, the data were fitted with the flow equation for short pipe,
| (1) |
where is the viscosity and is a coefficient to take into account the acceleration of the fluid at the pipe end (see supplementary information). In Fig. 2 (A) and (B), the solid line is a fit to to the data with a radius of nm and nm. These values are in excellent agreement with those determined independently via Knudsen effusion measurements. Importantly, it demonstrates de facto that our experiment can quantitatively determine the mass flow near the -transition in very small channels.
The mass flow was measured as a function of temperature across the superfluid phase transition at several pressures for both pores. These data are displayed in Fig. 2 (C) and (D) with the offset previously discussed subtracted. Previous work in Vycor REPPY1999 have found the superfluid transition to be suppressed to 1.95K, however, the superfluid transition in our channels is observed at the temperature corresponding to the bulk value, 2.17K. This is not surprising since we measure the total conductance of the nanopore channel and of the source reservoir in series, so the onset of superfluidity in the bulk is first observed at . Considering only data below , we can extract the superfluid velocities using the two-fluid model where we assume . Subtracting from the total mass flow using Eq. (1) yields the superfluid portion of the flow with a velocity . The superfluid density is taken from the bulk, as justified by previous work in Vycor (with a similar network pore size), albeit with a lower transition temperature REPPY1999 . The extracted superfluid velocities are shown in Fig. 3 for the lower pressure datasets, where linear response is expected to be a better approximation, and where the datasets were taken over a large range of temperatures. An inspection by eye readily shows that the superfluid velocities are smaller in the pore at similar pressures and temperatures. Such suppression of the flow velocity as the radius is decreased is in stark contrast with the bulk behaviour and shows that dissipation is increasing as the radius of the pore approaches a few nanometers.
Near the bulk superfluid transition, it is well-established that the superfluid density follows a universal powerlaw form , where is a correlation length critical exponent found experimentally to be close to . Considering a slowly-varying quantum-mechanical wavefunction with a phase , the kinetic energy of the superfluid is given by . From scale invariance, we expect that near , the mean square of the superfluid velocity should scale with the correlation length as . This result is strictly speaking valid only at temperatures very closed to , . From this hyperscaling anaysis, there is no reason to expect powerlaw behaviour in the superfluid velocity over a wide range in temperature away from . However, in the data shown in Fig. 3(A), a powerlaw , where is the superfluid critical velocity at , was used to fit all the data. A log-log plot of versus the reduced temperature is shown in Fig. 3(B) for the 3.14 nm pore. For this radius, where very little pressure dependence on the flow is observed, the powerlaw yields an exponent and for the low (482 mbar) and higher (827 mbar) dataset, respectively, and their critical velocity at zero temperature are m/s and m/s. In contrast, the larger pore (7.81 nm) displays a significantly distinct exponent and zero-temperature critical velocity m/s. While not a proof, given the limited range in temperature explored, this non-universal powerlaw behaviour as the dimensionality is reduced is consistent with expectations from quantum hydrodynamics in 1D where increased fluctuations should prohibit long range order.
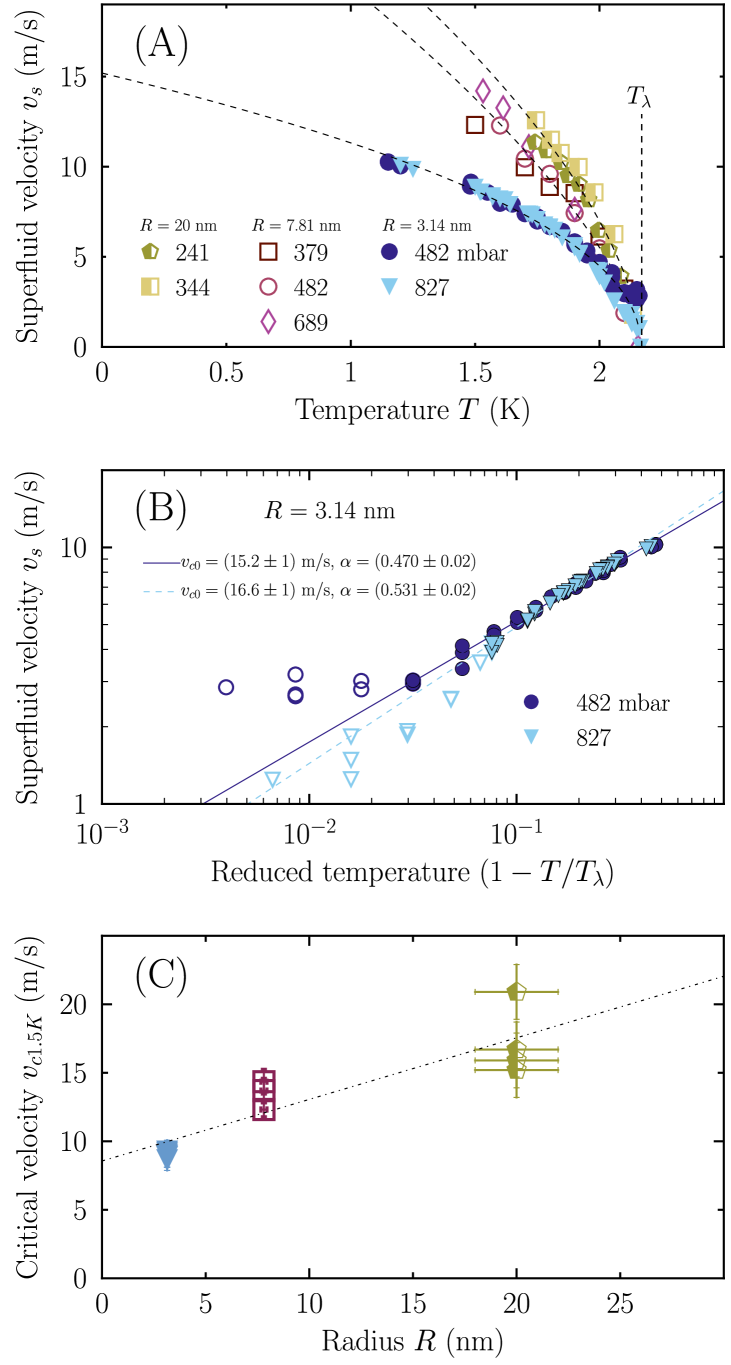
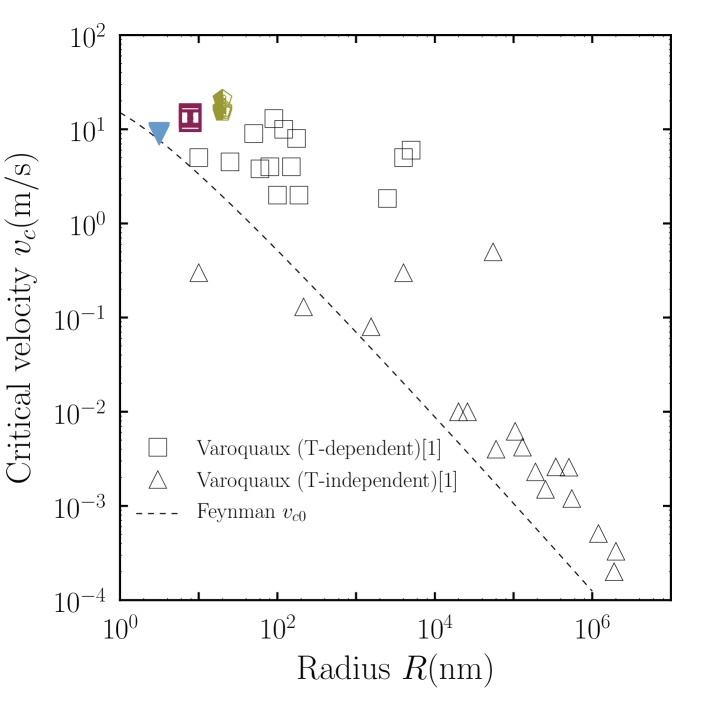
Other important features of the flow data not previously observed are (I) the extremely weak pressure dependence below for the smaller pore, and (II) an overall decrease in critical velocity as the channel size is reduced, in contrast to the behaviour , with the size of the vortex core, predicted by Feynman and found in larger channels (see supplementary information). The former is a hallmark of the macroscopic phase coherence that exists in a superfluid phase, in sharp contrast with the Euler prediction of a classical inviscid fluid, . Using the Gibbs-Duhem relation to convert a pressure to chemical potential difference, energy conservation dictates that there must exist a dissipation mechanism in the channel with a rate such that . From our data, it is clear that the dissipation rate must be flow (pressure) dependent. The question of how energy is dissipated in superfluids has a long history, beginning with the proposal of Anderson ANDERSON that, in analogy with the Josephson effect in superconductors, a steady state non-entropic flow may be achieved at a critical velocity via a mechanism that unwinds the phase of the order parameter in quanta of . Such “phase slips”, occurring at rate , corresponds to a process whereby the amplitude of the order parameter is instantaneously suppressed to zero at some point along the channel, and can be driven by either thermal or quantum fluctuations. Momentum conservation dictates that such events can only occur in the presence of broken translational invariance along the pore KHLEBNIKOV04 .
Microscopically, dissipation occurs through the creation of quantized vortex rings, the topological defects of superfluid hydrodynamics. In our experiments, the size of critical vortex ring, plays a crucial role, and it is determined by the equilibrium condition between the relative frictional force between the normal and superfluid component and the hydrodynamic forces acting on the ring in the presence of flow. Energetically, this manifests as a competition between a positive vortex energy that scales linearly with radius and a negative kinetic core energy scaling like its area. Langer and Fisher LANGER67 found below , exactly the length scale of the smallest pore considered here. When , the maximum size of a vortex ring is constrained by the radius of the channel, and thus the energy barrier for their creation is lowered, leading to increased dissipation and an upper bound on set by the Feynman critical velocity. The suppression in the observed critical velocity at as a function of decreasing radius shown in Fig. 3 can then be interpreted as a crossover to a regime where flow is dominated by the physics of the channel. As the channel radius continues to decrease further, it is expected that backscattering of helium atoms at low temperature in the guise of quantum phase slips will increase, resulting in a continued suppression of the critical velocity.
This argument does not address the actual rate, or probability per unit space time that topological defects are created, and experimental estimates of were first made by Trela and Fairbank Trela , who found for superfluid flow through constrictions with . For the nanoscale pores considered here, we estimate that , well below the flow rate of atoms/s measured in our smaller pore, yet approaching the quantum of mass flow atom/s at one bar differential pressure and fluid density taken at saturated vapour pressure.
The behaviour of superfluid helium flow was studied in capillary channels down to 3 nm radius. For the smaller pore, the superfluid velocity can be well described by a powerlaw and it was found to be significantly smaller than in larger channels. This likely signals the crossing over to a quasi-one-dimensional state whereby increased fluctuations and interaction renormalization are modifying superfluidity. As the channel size is reduced even further, near, or into the sub-nanometer range, we expect to observe physics characteristic of the truly one-dimensional limit. In this regime, the algebraic decay of the superfluid order parameter will manifest itself as a reduction in the superfluid density as a function of channel length and the appearance of non-universal powerlaws in the massflow dependence on pressure ) and temperature ) . Such observations would be strikingly different than that seen due to the macroscopic quantum coherence of bulk helium, and would signal the experimental discovery of a one-dimensional bosonic quantum fluid.
We thank I. Affleck for illuminating discussions and comments. We also thank the (CM)2 facility at Polytechnique Montreal for providing access and help with the TEM. This work was funded by Natural Sciences and Engineering Research Council of Canada (NSERC), the Fonds Québécois de la Recherche sur la Nature et les Technologies FRQNT (Québec) and the Canadian Institute for Advanced Research (CIFAR). All data, analysis details and material recipes presented in this work are available upon request to G.G.
References
- (1) E. Varoquaux, C. R. Phys. 7, 1101 (2006).
- (2) F. D. M. Haldane, J Phys C: Solid State Phys 14, 2585 (1981); Phys. Rev. Lett. 47, 1840 (1981).
- (3) A. Del Maestro, M. Boninsegni, and I. Affleck, Phys. Rev. Lett. 106, 105303 (2011), and references therein.
- (4) H. Ishii, H. Kataura, H. Shiozawa, H. Yoshioka, H. Otsubo, Y. Takayama, T. Miyahara, S. Suzuki, Y. Achiba, M. Nakatake, T. Narimura, M. Higashiguchi, K. Shimada, H. Namatame M. Taniguchi, Nature 426, 540 (2003).
- (5) O. M. Auslaender, H. Steinberg, A. Yacoby, Y. Tserkovnyak, B. I. Halperin, K. W. Baldwin, L. N. Pfeiffer, K. W. West, Science 308, 88-92 (2005).
- (6) Y. Jompol, C. J. B. Ford, J. P. Griffiths, I. Farrer, G. A. C. Jones, D. Anderson, D. A. Ritchie, T. W. Silk, A. J. Schofield, Science 325, 597-601 (2009).
- (7) D. Laroche, G. Gervais, M. P. Lilly and J. L. Reno, Science 343, 631-634 (2014).
- (8) M. A. Cazalilla, R. Citro, T. Giamarchi, E. Orignac, and M. Rigol, Rev. Mod. Phys. 83, 1405 (2011).
- (9) T. Eggel, M. A. Cazalilla, and M. Oshikawa, Phys. Rev. Lett. 107, 275302 (2011).
- (10) B. Kulchytskyy, G. Gervais, and A. Del Maestro, Phys. Rev. B 88, 064512 (2013).
- (11) L. Pollet and A. B. Kuklov, Phys. Rev. Lett. 113, 045301 (2014).
- (12) G. M. Zassenhaus and J. D. Reppy, Phys. Rev. Lett. 83, 4800 (1999), and references therein.
- (13) R. Toda, M. Hieda, T. Matsushita, N. Wada, J. Taniguchi, H. Ikegami, S. Inagaki, and Y. Fukushima, Phys. Rev. Lett. 99, 255301 (2007).
- (14) B. Yager, J. Nyéki, A. Casey, B. P. Cowan, C. P. Lusher, and J. Saunders Phys. Rev. Lett. 111, 215303 (2013).
- (15) M. Savard, G. Dauphinais and G. Gervais, Phys. Rev. Lett. 107, 254501 (2011).
- (16) M. Savard, C. Tremblay-Darveau and G. Gervais, Phys. Rev. Lett. 103, 104502 (2009).
- (17) H. L. Langhaar, J. Appl. Mech. 9, A55-A58 (1942).
- (18) P. W. Anderson, Rev. Mod. Phys. 38, 298 (1966).
- (19) S. Khlebnikov, Phys. Rev. Lett. 93, 090403 (2004).
- (20) J. S. Langer and M. E. Fisher, Phys. Rev. Lett. 19, 560 (1967).
- (21) W. J. Trela and W. M. Fairbank, Phys. Rev. Lett. 19, 822 (1967).
I SUPPLEMENTARY INFORMATION
I.1 Flow measurements
I.1.1 Design
Figure 1(A) shows a CAD drawing of the experimental cell used for the gas flow measurements and Fig. 1(C) and (D) shows a field-emission transmission electron microscope (FE-TEM) images of the nanoholes used. The wafer is installed in a coin silver cell and sealed by an indium o-ring separating two reservoirs (inlet and outlet) in an experimental cell designed such that any mass transfer between the two reservoirs is restricted to occur through the nanohole. Capillaries connect the extremities of the experimental cell to a gas handling system such that pressurized helium can be introduced in the cell, flow through the nanohole, and be pumped from the outlet of the cell by a mass spectrometer, see Fig. 1(B). We use packed silver powder heat exchangers to condense helium before it enters the inlet of the cell and to ensure a good thermal anchor to the cryostat. The temperature was determined using two calibrated ruthenium oxide thermometers apposed on the experimental cell and the 3He pot. The temperature control was achieved with the PID loop of a LakeShore 340 AC resistance bridge. The coordination of the measurement and the PID control were handled in a homemade Python interface.
The drain pressure below the membrane () is kept at vacuum through continuous pumping and helium gas is introduced in the top part of the cell creating a pressure gradient which induces a mass flow . This flow was detected with a Pfeiffer vacuum Smart Test HLT560 calibrated with an external standard leak of atm cc/s %. A cartoon representation of the whole experiment is shown in Fig. 1(B). The two reservoirs are depicted by capillary conductances and in series before and after the nanohole with a conductance . The mass spectrometer is denoted by and measures the volumetric flow when the drain side of the set-up is kept under vacuum, typically below mbar. With our technique, the total conductance of the circuit is measured. The source and drain conductance can be estimated using the infinite pipe approximation for Poiseuille flow ( ms at bar) and Knudsen free-molecular diffusion ( ms at mbar). These conductances are several orders of magnitude larger than the nanohole conductance which has a typical value ms (see Fig. 2(B)). We can therefore neglect the source and drain conductance to a very good approximation.
I.1.2 Experimental procedure
The procedure for making the measurements is as follows: we first empty both sides of the cell at a temperature well above the helium boiling point so as to ensure that no residual helium is present in either reservoir. The mass spectrometer is then connected to the outlet of the cell to determine a background signal that is treated as an offset to the pressure-driven flow of interest in this study. This background signal was found to be always less than pg/s in the liquid phase and less than pg/s in the gas phase. In the liquid phase it is less than the measured mass flow by a few orders of magnitude whereas in the gas phase at extremely low pressures it eventually becomes comparable to the flow signal. In the next step, the whole apparatus is cooled below the -transition so that gaseous helium introduced from the gas handling system condenses and fills the heat exchanger and inlet of the experimental cell. Once condensation is achieved, the higher pressure above the membrane forces the liquid helium to flow through the nanohole. When atoms reach the very low pressures in the drain reservoir, they evaporate and are pumped out to the mass spectrometer. The volumetric flow signal is then monitored as the temperature of the cell is slowly increased. The measurement is then repeated at different pressure gradients across the nanopore. The volumetric flow is converted into a mass flow using . The factor of ten here comes from the transformation of liters to cubic meters and mbars to Pascals. Finally, is in Kelvin and the specific gas constant for helium is in Joules per kilogram Kelvin .
I.1.3 Time constants and flow
In analogy with an electrical circuit with a time constant , the time required for the mass flow signal to stabilize upon a pressure of temperature variation is inversely proportional to the conductance of the nanohole. Figure 4 shows measurements of the volumetric flow versus time and a fit of the signal with an exponential decay function of the form . The time constant for the superfluid flow through the smallest nanopore is typically of order of 2000 seconds. We have verified that waiting over a period of time longer than did not improved the accuracy of the fit in a significant fashion.
I.2 Radii determination
I.2.1 Nanopore structural stability
The nanopores used in the present study were fabricated by focusing a TEM-FE beam on nm thick membranes as in Ref. SAVARD2009 ; SAVARD2011 . For the smaller nanopores, we have have found that it had a tendency to relax during post-fabrication. An example of such relaxation is shown in Fig. 5 where the nanopore was imaged at different times following the fabrication. While this structural relaxation is more acute for the smaller pore, we have found that the relaxation process stopped at cryogenic temperature, below 5 K. This was verified by performing Knudsen effusion measurements before and after long period of time during which the membrane was kept at helium temperature. However, because of the deadtime between the fabrication and the cooling procedure in the cryostat, this relaxation process causes an uncertainty in the radii determination of the pore. For this reason we have developed two independent ways to determine the radii in situ using both Knudsen effusion and classical fluid dynamics.
I.2.2 Radius determination from Knudsen effusion
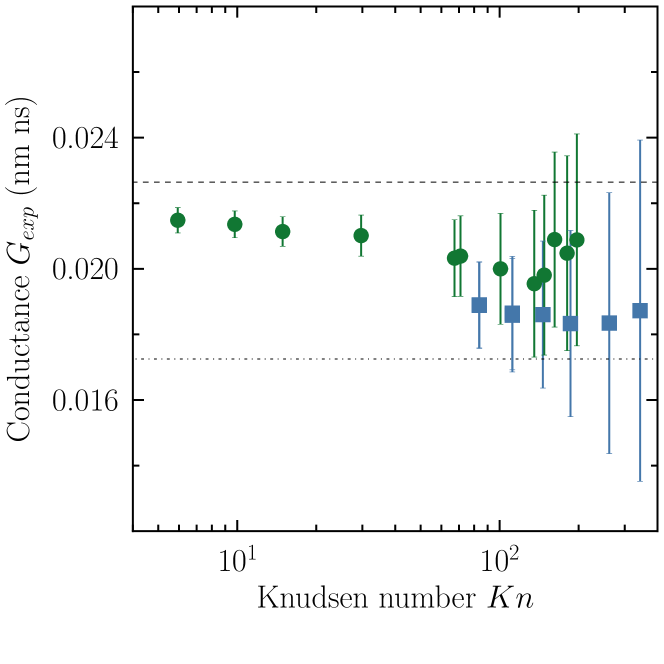
The methodology is similar to that reported in Ref. SAVARD2009 where the conductance of the nanopore is measured as a function of the Knudsen number (defined here as the ratio of the atom’s mean free path to the nanopore diameter). For the smaller nanopore, the Knudsen number is sufficiently high that we can therefore neglect the contribution from the viscous regime. The Knudsen conductance is given by where is the radius of the nanopore, its length and the opening angle of the nanopore (when the nanopore is a cylinder). The opening angle of other nanopores with similar dimensions were measured using a TEM tomography technique in KIM2006 and was found to be close to 30∘. In our case, an angle near 15∘ was found to best fit the Knudsen effusion data. While this angle is consistent with the profile reconstructed from the TEM picture, the uncertainty in its precise determination will lead to an uncertainty in the radius. The Clausing factor is a number between 0 and 1 that express the probability for an atom to go from one side of the nanopore to the other by bouncing on the walls. Figure 6 shows the value of the conductance as a fonction of Knudsen number . The data at higher have larger uncertainties because they correspond to very low pressures/flow regimes. The radius of the nanopore and its uncertainty were extracted from the minimization of and for which nm and and where is the weighted average of the measured values. The deviation here corresponds here to three standard deviation from . The extracted values for the radii are nm and nm.
.
I.2.3 Radius determination from the viscous normal flow
Pressure sweeps were performed in the normal phase of the liquid helium and the data were fitted against a slightly modified model of short pipe viscous flow from Langhaar LANGHAAR42 ,
| (2) |
.
The last term, , is required here because we observe a spurious signal as . This signal is believed to arise from evaporation at the walls on the drain side. The free parameters in Eq.(2) are the radius , the mass flow offset , and which is a geometry-dependent factor accounting for the acceleration of the fluid at the nanopore boundary. The best fit values were determined using a least squares method, evaluating over a cube in parameter space in order to find a global minimum. In Fig. 2 (A) and (B), the solid line is a fit to to the data with a radius of nm and nm. These values are in excellent agreement with those determined independently via the Knudsen effusion measurements discussed above.
It is interesting to note that, as and are nearly constant in the normal phase, for sufficiently small values of the influence of the parameter becomes negligible: . This is the case for the smaller nanopore of radius nm, but not for the larger nanopore of nm. The parameter was determined from a fit using Knudsen effusion data and found to be equal to 4.7. We have verified that modifications in arising from a variation of between 0 and 10 was negligable, i.e. the value of had little or no influence on the data.
I.3 Critical velocities
In the two-fluid model proposed by Landau and Tisza the total mass current is given by and total density is given by the sum of the superfluid and normal component . Per symmetry of the pore, we consider the flow to be in the axial direction of the nanohole so . The normal part is well-modeled by the function given in equation (1), with here replaced by . The superfluid velocities are given by . The values from our work are reported in Fig. 7 at 1.5 K, per previous convention in the literature. Finally, we have made the assumption that the superfluid velocities were reaching the critical velocities, i.e. the superfluid velocity was only limited by dissipation.
References
- (1) E. Varoquaux, C. R. Phys. 7, 1101 (2006).
- (2) M. J. Kim, M. Wanunu, D. C. Bell, and A. Meller, Advanced Materials 18, 3149-3153 (2006).