Defect chemistry in layered transition-metal oxides from screened hybrid density functional calculations
Abstract
We report a comprehensive first-principles study of the thermodynamics and transport of intrinsic point defects in layered oxide cathode materials \ceLiMO2 (M=Co, Ni), using density-functional theory and the Heyd-Scuseria-Ernzerhof screened hybrid functional. We find that \ceLiCoO2 has a complex defect chemistry; different electronic and ionic defects can exist under different synthesis conditions, and \ceLiCoO2 samples free of cobalt antisite defects can be made under Li-excess (Co-deficient) environments. A defect model for lithium over-stoichiometric \ceLiCoO2 is also proposed, which involves negatively charged lithium antisites and positively charged small (hole) polarons. In \ceLiNiO2, a certain amount of Ni3+ ions undergo charge disproportionation and the concentration of nickel ions in the lithium layers is high. Tuning the synthesis conditions may reduce the nickel antisites but would not remove the charge disproportionation. In addition, we find that \ceLiMO2 cannot be doped - or -type; the electronic conduction occurs via hopping of small polarons and the ionic conduction occurs via migration of lithium vacancies, either through a monovacancy or divacancy mechanism, depending on the vacancy concentration.
I Introduction
Layered transition-metal oxides \ceLiMO2 (M=Co, Ni) have been studied intensively for lithium-ion battery intercalation cathodes.Whittingham (2004); Kalyani and Kalaiselvi (2005) It has been reported that \ceLiCoO2 synthesized by conventional high temperature (800∘C) procedures possesses the -type layered structure with excellent ordering of the Li+ and Co3+ ions and good structural stability. The material synthesized at low temperatures (400∘C), however, yields a significant disordering of the Li+ and Co3+ ions and exhibits poor electrochemical performance.Gummow et al. (1992) It has also been shown that experimental studies of the magnetic properties of \ceLiCoO2 always reveal localized magnetic moments, and the commercially available, high-temperature synthesized \ceLiCoO2 is often made deliberately with Li-excess.Chernova et al. (2011) The electronic state of Co and the nature of charge-compensating defects in \ceLiCoO2 are still not fully understood, although several defect models for the lithium over-stoichiometric (i.e., Li-excess) \ceLiCoO2 have been proposed.Carewska et al. (1997); Levasseur et al. (2000, 2003); Hertz et al. (2008); Carlier et al. (2013) Regarding \ceLiNiO2, it is known that the compound with all Ni in a valence state is extremely hard to synthesize because of the difficulty of stabilizing Ni3+ at high temperatures.Kalyani and Kalaiselvi (2005); Dutta et al. (1992); Hirano et al. (1995); Kanno et al. (1994) In fact, it is now believed that stoichiometric \ceLiNiO2 does not actually exist, and the compound has always been found to have a significant concentration of Ni ions at the Li sites.Barra et al. (1999); Chappel et al. (2002); Kalyani and Kalaiselvi (2005); Chernova et al. (2011) The off-stoichiometry and cation mixing have been found to be detrimental to \ceLiNiO2’s electrochemical performance.Kalyani and Kalaiselvi (2005); Whittingham (2004); Chernova et al. (2011)
In order to understand the experimental observations and resolve the conflicting defect models and interpretations, apparently one needs to have a detailed understanding of the materials’ defect chemistry, which can be achieved through first-principles computational studies. In fact, calculations based on density-functional theory (DFT) have been proven to be an important tool in investigations of point defects in battery cathode materials. In such calculations, certain aspects can be isolated and studied more easily than in experiments. A proper and comprehensive treatment of defects based on DFT not only can provide a quantitative understanding of the thermodynamics and transport of the defects but also shed light on the electronic and ionic conduction mechanisms and help develop strategies for improving the materials’ performance.Hoang and Johannes (2011, 2012); Johannes et al. (2012)
There have been numerous computational studies of layered \ceLiMO2.Anisimov et al. (1991); Van der Ven and Ceder (2000); Kang and Ceder (2006); Wang et al. (2007); Laubach et al. (2009); Ensling et al. (2010); Chevrier et al. (2010); Chen et al. (2011) All these studies have, however, focused mainly on the bulk properties and Li diffusion, with much less attention paid to the defect chemistry. A systematic DFT study of point defects in \ceLiMO2 has only recently been carried out by Koyama et al., Koyama et al. (2012, 2013) providing useful information on defect formation in the studied materials. This work, however, has three major limitations. Firstly, the DFT calculations were carried out using the GGA method,Dudarev et al. (1998); Anisimov et al. (1991, 1993); Liechtenstein et al. (1995) an extension of the generalized-gradient approximation (GGA) for the exchange-correlation functional, Perdew et al. (1996) in which the on-site Coulomb interaction parameter for the transition metal was assumed to be the same in different chemical environments. Secondly, the authors did not address the spurious long-range Coulomb interactions between charged defects in calculations using the supercell approach.Van de Walle and Neugebauer (2004); Freysoldt et al. (2009, 2011) These interactions often significantly alter the calculated total energies, leading to inaccurate defect formation energies. Thirdly, and most importantly, the authors did not fully investigate the dependence of defect formation energies on the atomic chemical potentials, which can be used to represent the synthesis conditions, resulting in an incomplete and inaccurate picture of the defect chemistry.
In this article, we present a comprehensive DFT study of the structure, energetics, and migration of intrinsic point defects in layered \ceLiMO2 using a hybrid Hartree-Fock/DFT method, specifically the Heyd-Scuseria-Ernzerhof (HSE06) screened hybrid functional.Heyd et al. (2003); Paier et al. (2006); Heyd et al. (2006) Compared to the GGA method, the hybrid functional improves the transferability of calculations across compounds by treating all orbitals on the same footing, thus improving the accuracy of defect formation energies. We find that \ceLiCoO2 has a surprisingly complex defect chemistry. Different electronic and ionic defects such as small polarons, antisite defects, and lithium vacancies can exist with high concentrations in the material when synthesized under different conditions. In \ceLiNiO2, a certain amount of Ni3+ ions undergo charge disproportionation, and nickel antisites have a low formation energy and hence high concentration. We will discuss how our results for \ceLiMO2 can explain the experimental observations, help understand the mechanisms for electronic and ionic conduction, assist in defect characterization and defect-controlled synthesis and ultimately aid in the rational design of cathode materials with improved electrochemical performance. Comparison with previous theoretical works will be made where appropriate.
II Methodology
II.1 Computational details
The presented calculations were based on DFT using the HSE06 hybrid functional, Heyd et al. (2003); Paier et al. (2006); Heyd et al. (2006) and the projector augmented wave method, Blöchl (1994); Kresse and Joubert (1999) as implemented in the VASP code. Kresse and Hafner (1993); Kresse and Furthmüller (1996, 1996) The GGA+ method Dudarev et al. (1998); Anisimov et al. (1991, 1993); Liechtenstein et al. (1995) was used only for comparison in some specific bulk calculations, with values set to 4.91 eV (for Co) and 6.70 (Ni), taken from Zhou et al. Zhou et al. (2004) Calculations for bulk \ceLiMO2 in the -type layered structure were performed using a 777 Monkhorst-Pack -point mesh.Monkhorst and Pack (1976) The structural optimization allowed for Jahn-Teller distortion in \ceLiNiO2. Intrinsic point defects were treated within the supercell approach, in which a defect is included in a finite volume of the host material and this structure is periodically repeated. For defect calculations, we used hexagonal (331) supercells, which correspond to 108 atoms/cell; integrations over the Brillouin zone were carried out using the point. The plane-wave basis-set cutoff was set to 500 eV. Convergence with respect to self-consistent iterations was assumed when the total energy difference between cycles was less than 10-4 eV and the residual forces were less than 0.01 eV/Å. In the defect calculations, the lattice parameters were fixed to the calculated bulk values, but all the internal coordinates were fully relaxed. The migration of selected defects in \ceLiMO2 was studied using the climbing-image nudged elastic-band (NEB) method.Henkelman et al. (2000) All calculations in \ceLiMO2 were performed with spin polarization and the ferromagnetic spin configuration.
II.2 Defect formation energies
The formation energy of a defect is a crucial factor in determining its concentration. In thermal equilibrium, the concentration at temperature can be obtained via the relation Van de Walle and Neugebauer (2004)
| (1) |
where is the number of high-symmetry sites in the lattice per unit volume on which the defect can be incorporated, and is the number of equivalent configurations (per site). It follows from this equation that defects with low formation energies will easily form and occur in high concentrations.
The formation energy of a defect X in charge state is defined as Van de Walle and Neugebauer (2004); Hoang and Johannes (2011)
| (2) | |||||
where and are, respectively, the total energies of a supercell containing the defect X in charge state and of a supercell of the perfect bulk material; is the atomic chemical potential of species (and is referenced to its standard state), and denotes the number of atoms of species that have been added (0) or removed (0) to form the defect. is the electronic chemical potential, referenced to the valence-band maximum in the bulk (). is the correction term to align the electrostatic potentials of the bulk and defect supercells and to account for finite-cell-size effects on the total energies of charged defects.Van de Walle and Neugebauer (2004) To correct for the finite-size effects, we adopted the approach of Freysoldt et al. in which the correction term to the formation energy is determined without empirical parameters.Freysoldt et al. (2009, 2011) This approach has proven to be effective for studies of defects in solids.Hoang and Van de Walle (2013); Komsa et al. (2012)
The atomic chemical potentials are variables and subject to thermodynamic constraints, which can be used to represent the synthesis conditions.Van de Walle and Neugebauer (2004); Hoang and Johannes (2011) The stability of \ceLiMO2 requires
| (3) |
where is the formation enthalpy. This condition places a lower bound on the value of . Additionally, one needs to avoid precipitating bulk Li and M, or forming O2 gas. This sets an upper bound on the chemical potentials: 0.Van de Walle and Neugebauer (2004) In our work, the zero reference state of is chosen to be half of the total energy of an isolated O2 molecule at 0 K.
There are further thermodynamic constraints imposed by competing LiMO phases which usually place stronger bounds on . For example, in order to avoid the formation of Li2O, a competing phase of \ceLiCoO2,
| (4) |
By taking into account the constraints imposed by all possible competing phases, one can define the range of Li, M, and O chemical potential values in which \ceLiMO2 is stable.
The electronic chemical potential , hereafter also referred to as the Fermi level, is not a free parameter either. In principle, eqns (1) and (2) can be written for every intrinsic defect and impurity in the material. The complete problem, including free-carrier concentrations in valence and conduction bands, if present, can then be solved self-consistently by imposing the charge neutrality condition:Van de Walle and Neugebauer (2004)
| (5) |
where and are the concentration and charge of defect or impurity Xi; and are free electron and hole concentrations; the summation is over all defects and impurities.
III Results
III.1 Bulk properties
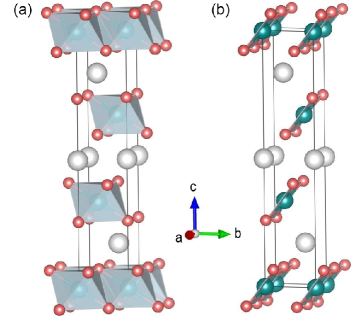
Layered oxides \ceLiMO2 were reported to crystallize in space group . The experimental lattice parameters are Å and Å (M=Co);Laubach et al. (2009) and Å and Å (M=Ni).Li et al. (1993) Figure 1 shows the relaxed structures of \ceLiMO2 in hexagonal representations. The calculated lattice parameters in \ceLiCoO2 are Å and Å; the CoO bond length is 1.91 Å. In \ceLiNiO2, Å and Å, taken as an average hexagonal unit cell; there are four short NiO bonds (1.88 Å) and two long NiO bonds (2.13 Å) due to the Jahn-Teller distortion associated with low-spin Ni3+, in reasonable agreement with the experimental values of 1.91 and 2.07 Å in Li0.98Ni1.02O2 reported by Delmas et al.Delmas et al. (1997) The calculated magnetic moment is 0 for Co, indicating that Co3+ is in the low-spin state in \ceLiCoO2; and 0.85 for Ni, i.e., Ni3+ is also in the low-spin state in \ceLiNiO2. The calculated formation enthalpies at 0 K are 6.96 eV (M=Co) and 6.10 eV (M=Ni), in agreement with the experimental values of 7.03 eV (M=Co) and 6.15 eV (M=Ni). Wang and Navrotsky (2004)
The implementation of finite-cell-size corrections in the Freysoldt approach requires values for the static dielectric constant.Freysoldt et al. (2009, 2011) The electronic contribution to the static dielectric constant can be obtained from the real part of the dielectric function for . The ionic contribution, on the other hand, can be calculated using density functional perturbation theory. Wu et al. (2005); Gajdoš et al. (2006) Since the ionic contribution only depends on the Born effective charges and the vibrational modes, which are usually well described in GGA, Paier et al. (2009) this term can be calculated using GGA or GGA. We find the electronic contributions are 4.67 (for M=Co) and 5.11 (M=Ni), obtained from HSE06 calculations, whereas the ionic contributions are 8.35 (for M=Co) and 10.34 (M=Ni), obtained from GGA calculations. The calculated total static dielectric constants are thus 13.02 for \ceLiCoO2 and 15.45 for \ceLiNiO2.
| HSE06 | GGA | |||
|---|---|---|---|---|
| VBM | CBM | VBM | CBM | |
| \ceLiCoO2 | 62% | 81% | 56% | 79% |
| \ceLiNiO2 | 34% | 65% | 24% | 48% |
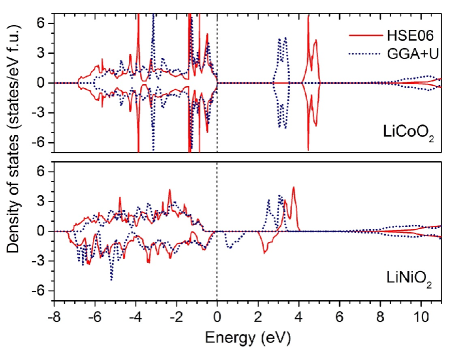
Figure 2 shows the total electronic densities of states of \ceLiMO2, obtained in calculations using HSE06 where the default Hartree-Fock mixing parameter value =0.25 was used, and GGA where =4.91 eV for Co and 6.70 eV for Ni. At first glance, both methods give quite similar electronic densities of states, except that the HSE06 band gap and valence-band width are larger. The calculated band gaps are 4.11 and 1.93 eV for M=Co and Ni, respectively, in HSE06, and 2.74 eV and 0.30 eV in GGA. The HSE06 band gap for \ceLiCoO2 is in good agreement with that of 4.2 eV reported by Ensling et al.,Ensling et al. (2010) obtained in calculations using the B3LYP hybrid functional. Upon further examination, we find that the nature of the electronic states at the valence-band maximum (VBM) and conduction-band minimum (CBM) can be dependent on the method used, especially in the case of \ceLiNiO2. Table 1 lists the percentage of transition-metal character at the VBM and CBM in \ceLiMO2 from HSE06 and GGA. The VBM and CBM in \ceLiCoO2 are predominantly transition-metal 3 states in both HSE06 and GGA. In \ceLiNiO2, the VBM has a significantly larger contribution from O 2 states, with 34% from the Ni atom and 32% from each O atom (HSE06), or 24% from the Ni atom and 38% from each O atom (GGA). In both compounds, the Li 2 state is high up in the conduction band, suggesting that Li donates one electron to the lattice and becomes Li+. This information about the electronic structure will become very useful when we discuss defects in \ceLiMO2 since the formation of a defect often involves removing (adding) electrons from (to) the VBM (CBM).Hoang and Johannes (2011)
There are discrepancies in the experimental band gap values for \ceLiCoO2 reported in the literature. Ghosh et al.Ghosh et al. (2007) obtained a band gap of 1.7 eV from optical spectroscopy. With ultraviolet-visible spectroscopy, Kushida et al.Kushida and Kuriyama (2002) found 2.1 eV. Rosolen et al.Rosolen and Decker (2001) reported a direct band gap of 2.5 eV with photocurrent spectra. Using a combination of bremsstrahlung isochromat spectroscopy and x-ray photoemission spectroscopy measurements, van Elp et al.van Elp et al. (1991) obtained a band gap of 2.70.3 eV. The discrepancies suggest that the experimental band gap value could be sensitive to the quality of the samples which in turn depends on the synthesis conditions. For \ceLiNiO2, Anisimov et al.Anisimov et al. (1991) described the material as a small-gap insulator and cited a band gap value of 0.4 eV from inverse photoemission. Molenda et al.,Molenda et al. (2002) on the other hand, reported a band gap of 0.5 eV. Apparently, our HSE06 calculations significantly overestimate the band gap values for \ceLiMO2. It has also been observed in some other complex oxides that HSE06 tends to overestimate the band gaps.Scanlon and Watson (2011a, b) However, it should also be noted again that no stoichiometric samples of LiNiO2 exist from which to measure the gap. All known samples are defected at some level and this changes both the chemical composition and the long range structural order, as evidenced by the local, rather than cooperative, observed Jahn-Teller distortion.Rougier et al. (1995) This obviously complicates comparison between calculated and observed bulk properties, including the band gap. Although this issue needs further investigations from both the computational and experimental sides, it does not play a crucial role in our discussion of the energetics of point defects in \ceLiMO2. In fact, it has been observed that the defect formation energy at the Fermi level determined by the charge neutrality condition (5) is usually not sensitive to the calculated band gap, as long as the physics near the band edges is well reproduced by the calculations.Hoang and Van de Walle (2013); Roy et al. (2013)
III.2 Chemical potentials and phase stability
| System | Crystal structure | This work | Experiments |
|---|---|---|---|
| \ceLi2O | cubic | 5.75 | 6.21a |
| \ceLi2O2 | hexagonal | 5.84 | 6.56a |
| \ceCoO | hexagonal | 3.13 | 2.46a |
| \ceCo3O4 | cubic | 9.94 | 9.43a |
| \ceLiCoO2 | trigonal | 6.96 | 7.03b |
| \ceLi6CoO4 | tetragonal | 20.62 | |
| \ceNiO | cubic | 2.89 | 2.48b |
| \ceLiNiO2 | monoclinic | 6.10 | 6.15b |
| \ceLi2NiO2 | trigonal | 8.76 | |
| \ceLi2NiO3 | monoclinic | 9.10 |
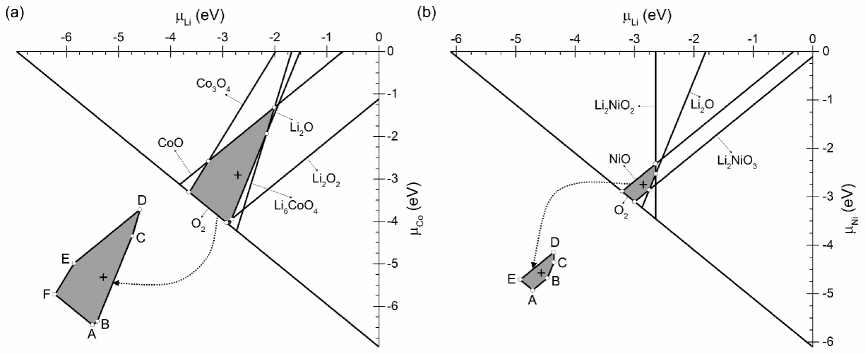
Figure 3 shows the atomic chemical-potential diagrams associated with \ceLiMO2. In order to construct these diagrams, we explored and calculated all possible LiMO phases available in the Materials Project database.Jain et al. (2013) As mentioned in Sec. 2.2, the zero reference state of the oxygen chemical potential is chosen to be half of the total energy of an isolated O2 molecule. In our calculations, the OO bond in an O2 molecule is 1.21 Å, and the calculated binding energy with respect to spin-polarized O atoms is 5.16 eV, in excellent agreement with the experimental binding energy of 5.12 eV.Chase, Jr. (1998) The range of Li, M, and O chemical potential values in which the host materials \ceLiMO2 are thermodynamically stable, i.e., the shaded regions in Fig. 3, are defined by the competing LiMO phases that can be in thermodynamic equilibrium with \ceLiMO2. The calculated formation enthalpies (at 0 K) of these phases and those of \ceLiMO2 are listed in Table 2.
Each point in the diagrams in Fig. 3 corresponds to a specific set of Li, M, and O chemical potential values. Points AF in Fig. 3(a) and points AE in Fig. 3(b) represent limiting cases where the host materials \ceLiMO2 are thermodynamically stable and in equilibrium with different competing phases. For example, point A in Fig. 3(a) is where \ceO2, \ceLi2O2, and \ceLiCoO2 are in equilibrium; point B is where \ceLi2O2, \ceLi2O, and \ceLiCoO2 are in equilibrium. These two limiting cases can be regarded as representing Li-excess (Co-deficient) environments. The environments at points A, B, and F in Fig. 3(a) and points A and E in Fig. 3(b) can also be considered as highly oxidizing, given the very high oxygen chemical potential.
As can be seen from Fig. 3, the stability region of \ceLiCoO2 is much larger than that of \ceLiNiO2. For example, the oxygen chemical potential goes from 1.82 eV to 0 eV in \ceLiCoO2, whereas in \ceLiNiO2 it goes from 0.56 eV to 0 eV. We note that =1.82 eV corresponds to O2 gas at 1200∘C and 0.2 atm; =0.56 eV corresponds to O2 gas at 250∘C and 0.2 atm.Chase, Jr. (1998) Our results thus indicate that stoichiometric \ceLiCoO2 can be stable at much higher temperatures than stoichiometric \ceLiNiO2. We note that \ceLiNiO2 would be unstable toward competing LiNiO phases if the Jahn-Teller distortion were not allowed. The rhombohedral-to-monoclinic distortion lowers the total energy and hence the formation enthalpy of \ceLiNiO2 by 0.42 eV per formula unit, stabilizing the monoclinic phase.
III.3 Defect structure and energetics
We investigated various intrinsic point defects in \ceLiMO2 in all possible charge states. These defects include hole and electron polarons, hereafter denoted as and ; lithium vacancies () and interstitials (Lii); lithium antisites (LiM); transition-metal antisites (MLi) and vacancies (); oxygen vacancies (); and MO2 vacancies (). We also considered defect complexes such as lithium divacancies (), antisite defect pairs (MLiLiM), and a complex of MLi and .
| Defect | (eV) | (eV) | Constituents | (eV) | |||||||
|---|---|---|---|---|---|---|---|---|---|---|---|
| A | B | C | D | E | F | X | |||||
| \ceLiCoO2 | 0.89 | 0.89 | 1.35 | 1.59 | 1.18 | 0.81 | 1.15 | 0.10 | |||
| 1.65 | 1.65 | 1.20 | 0.96 | 1.37 | 1.74 | 1.40 | 0.32 | ||||
| 1.19 | 1.28 | 1.49 | 1.42 | 0.55 | 0.55 | 1.15 | 0.70 | ||||
| 1.69 | 1.78 | 2.45 | 2.60 | 1.33 | 0.97 | 1.90 | 0.40 | ||||
| Co | 2.08 | 2.08 | 1.20 | 0.96 | 0.55 | 0.55 | 1.41 | ||||
| Co | 3.19 | 3.19 | 1.85 | 1.38 | 1.38 | 1.75 | 2.27 | Co | 0.54 | ||
| Co | 3.40 | 3.40 | 2.97 | 2.97 | 2.15 | 1.79 | 2.98 | ||||
| Li | 1.36 | 1.36 | 1.79 | 1.79 | 2.60 | 2.97 | 1.77 | ||||
| Li | 0.89 | 0.89 | 1.78 | 2.01 | 2.42 | 2.42 | 1.56 | Li | 1.36 | ||
| Li | 0.92 | 0.92 | 2.26 | 2.73 | 2.73 | 2.36 | 1.84 | Li | 2.23 | ||
| Co- | 2.76 | 2.84 | 2.17 | 1.86 | 0.59 | 0.59 | 2.05 | Co | 0.51 | ||
| CoLi-LiCo | 2.34 | 2.34 | 2.34 | 2.34 | 2.34 | 2.34 | 2.34 | Co | 1.99 | ||
| \ceLiNiO2 | 0.51 | 0.51 | 0.51 | 0.51 | 0.51 | 0.51 | 0.28, 0.21 | ||||
| 0.51 | 0.51 | 0.51 | 0.51 | 0.51 | 0.51 | 0.26, 0.28 | |||||
| 1.08 | 1.32 | 1.42 | 1.42 | 0.87 | 1.22 | 0.56, 0.66 | |||||
| 1.15 | 1.39 | 1.49 | 1.49 | 0.93 | 1.29 | 0.45 | |||||
| Ni | 0.96 | 0.96 | 0.76 | 0.53 | 0.53 | 0.75 | |||||
| Ni | 1.01 | 1.01 | 0.82 | 0.59 | 0.59 | 0.80 | Ni | 0.45 | |||
| Ni | 1.70 | 1.70 | 1.50 | 1.27 | 1.27 | 1.49 | Ni | 0.23 | |||
| Li | 1.29 | 1.29 | 1.48 | 1.71 | 1.71 | 1.49 | |||||
| Li | 0.79 | 0.79 | 0.98 | 1.22 | 1.21 | 1.00 | Li + | 1.01 | |||
| Li | 0.68 | 0.68 | 0.88 | 1.11 | 1.11 | 0.89 | Li + 2 | 1.63 | |||
| Ni- | 1.87 | 2.11 | 2.02 | 1.79 | 1.23 | 1.80 | Ni | 0.17 | |||
| NiLi-LiNi | 1.19 | 1.19 | 1.19 | 1.19 | 1.19 | 1.19 | Ni | 1.57 | |||
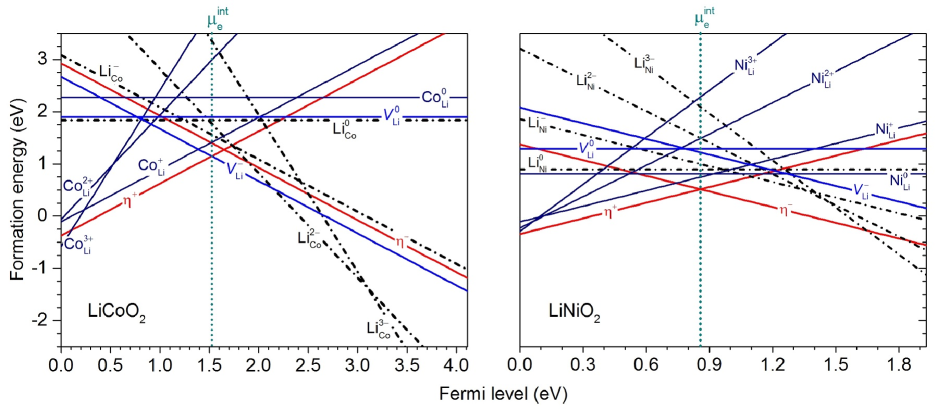
Figure 4 shows the calculated formation energies of selected point defects in \ceLiMO2, obtained at point X in the thermodynamically allowed regions of the chemical potential diagrams, marked by a cross in Figs. 3(a) and 3(b). The slope in the formation energy plots indicates the charge state. Positively charged defects have positive slopes; negatively charged defects have negative slopes. We find that charged defects have positive formation energies only near midgap. Therefore, any attempt to deliberately shift the Fermi level to the VBM or CBM, e.g., via doping with acceptors or donors, will result in positively or negatively charged intrinsic defects having negative formation energies, i.e., the intrinsic defects will form spontaneously and counteract the effects of doping. This indicates that intrinsic point defects in \ceLiMO2 cannot act as sources of band-like electrons and holes, and the material cannot be made -type or -type. In the absence of electrically active impurities that can shift the Fermi-level position or when such impurities occur in much lower concentrations than charged intrinsic defects, the Fermi level is determined by the charge neutrality condition (5), hereafter this position is denoted as , and is almost exclusively defined by the positively and negatively charged point defects with the lowest formation energies.Hoang and Van de Walle (2009); Wilson-Short et al. (2009); Hoang and Johannes (2011); Hoang et al. (2012) With the chosen sets of atomic chemical potentials, is 1.52 eV above the VBM in \ceLiCoO2, determined by the hole polaron and the negatively charged lithium vacancy , or 0.88 eV above the VBM in \ceLiNiO2, determined by and the electron polaron .
The results presented in Fig. 4 are, however, not the only scenario that may occur in \ceLiMO2. As it is clear from eqn. (2), the defect formation energy and hence concentration depend on the chemical potentials. We therefore list in Table 3 the calculated formation energies of the most relevant point defects in \ceLiMO2 for different sets of atomic chemical potentials which correspond to points AF and X in Fig. 3(a) for M=Co and points AE and X in Fig. 3(b) for M=Ni, obtained at the Fermi-level position determined by the charge neutrality condition. With the allowed ranges of the atomic chemical potentials, we find that is in the range of 1.191.96 eV in \ceLiCoO2, which is always far away from both the VBM and CBM. In \ceLiNiO2, is always at 0.88 eV. The results summarized in Table 3 clearly show that the point defect landscapes in \ceLiMO2 can be very different under different thermodynamic conditions. In the following, we analyze in detail the structure and energetics of the defects.
Small polarons. The formation of involves removing an electron from the system which results in a low-spin M4+ ion at the M3+ lattice site. The calculated magnetic moment of the M4+ ion is 1.13 for M=Co or 0.07 for M=Ni. The local lattice geometry near the M4+ ion is slightly distorted with the six neighboring O atoms moving toward M4+. In \ceLiCoO2, the CoO bond length at the Co4+ site is 1.88 Å, as compared to 1.91 Å of the other CoO bonds. In \ceLiNiO2, there are four NiO bonds of 1.86 Å, as compared to 1.88 Å of the other four short NiO bonds, and two NiO bonds of 1.90 Å, as compared to 2.13 Å of the other long NiO bonds, i.e., the Jahn-Teller distortion almost completely vanishes at the Ni4+ site. The creation of , on the other hand, corresponds to adding an electron to the system which results in a high-spin M2+ ion at the M3+ lattice site. The magnetic moment of the M2+ ion is 2.66 for M=Co or 1.66 for M=Ni. The high-spin state of M2+ is lower in energy than the low-spin state by 0.54 eV in the case of M=Co. We note that in bulk \ceLiMO2, the M3+ ion is most stable in its low-spin state. The local geometry near the M2+ ion is also slightly distorted, but with the neighboring O atoms moving away from M2+; the six CoO bonds at the Co2+ site in \ceLiCoO2 are now 2.03 Å and the NiO bonds at the Ni2+ site in \ceLiNiO2 are now 2.00 Å (four bonds) and 2.12 Å (two bonds). The calculated formation energies of and in \ceLiCoO2 are in the ranges of 0.811.59 eV and 0.961.74eV, respectively, depending on the specific set of the atomic chemical potentials. In \ceLiNiO2, the formation energy of and is always 0.51 eV, independent of the atomic chemical potentials.
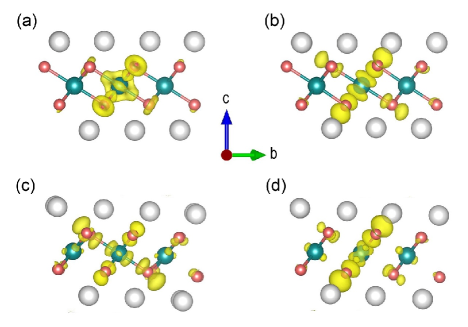
In forming the polarons, the removed or added electron can be regarded as becoming self-trapped in the local lattice distortion, which acts as a potential well, induced by its own presence. Since the distortion is found to be mainly limited to the neighboring O atoms of the M4+ or M2+ ion, these hole and electron polarons can be considered as small polarons.Stoneham et al. (2007); Shluger and Stoneham (1993) Figure 5 shows the charge density of the polarons in \ceLiMO2. Most of the positive (hole) or negative (electron) charge resides on the transition metal, but significant charge is also on surrounding oxygens, particularly in the case of \ceLiNiO2. The features of are necessarily related to the nature of the VBM from which the electrons are removed to form the polarons, and those of are related to the nature of the CBM to which electrons are added. The stability of a polaron in a given material can be assessed through its self-trapping energy,Shluger and Stoneham (1993); Varley et al. (2012); Nagaraja et al. (2012) defined as the difference between the formation energy of the free hole or electron and that of the hole or electron polaron. In \ceLiCoO2, we find the self-trapping energies of and are 0.36 and 1.35 eV, respectively; in \ceLiNiO2, the self-trapping energies are 0.36 and 0.65 eV for and . Our HSE06 calculations using a smaller-than-default Hartree-Fock mixing parameter, particularly, =0.15, also show that the polarons are stable, though with smaller self-trapping energies: 0.12 and 0.62 eV for and in \ceLiCoO2, and 0.16 and 0.28 eV for and in \ceLiNiO2. GGA calculations with =6.70 eV, on the other hand, cannot stabilize a hole polaron in \ceLiNiO2. This is because the VBM in GGA is predominantly delocalized O 2 states: the Ni atom contributes only 24% whereas each O atom contributes 38%; see Table 1. We note that Koyama et al. also found in GGA calculations with =5 eV that the hole in \ceLiNiO2 is delocalized.Koyama et al. (2012)
Vacancies and interstitials. The formation of involves removing a Li+ ion, which causes inward movement of the four neighboring Li atoms by 0.11 Å toward the void formed by the removed Li+. The calculated formation energy of can be as low as 0.55 eV and as high as 1.49 eV in \ceLiCoO2, depending on the atomic chemical potentials; in \ceLiNiO2, it is in the range of 0.871.42 eV. is created by removing a Li atom, which is in fact a Li+ ion and an electron from a neighboring M atom, leading to the formation of a void at the site of the removed Li+ and an M4+ at the neighboring M site. There is a slight distortion in the local geometry near the M4+ ion and the magnetic moment at this site is 1.13 (M=Co) or 0.05 (M=Ni), similar to those for the hole polarons. is thus a complex of and with a binding energy of 0.40 eV (M=Co) or 0.45 (M=Ni). This defect structure also suggests that for each Li atom removed from \ceLiMO2 cathodes, e.g., during delithiation, the material is left with one negatively charged lithium vacancy and one hole polaron.
For lithium interstitials, the lowest-energy configuration is Li, created by adding Li+ into the system. The addition of Li+ to a Li layer results in a significant rearrangement of the Li+ in that layer with at least two Li+ moving away from their original octahedral sites and toward the tetrahedral sites. Because of this large rearrangement, Li has a rather high formation energy, 2.253.19 eV (M=Co) or 1.441.99 eV (M=Ni). With that high formation energy, lithium interstitials are not likely to form in \ceLiCoO2, which is consistent with experiments where no extra Li was found at the tetrahedral sites even in lithium over-stoichiometric Li1+xCoO2 ().Levasseur et al. (2000)
Other vacancies include , , and , created by removing O, M, and MO2 units, respectively. The oxygen vacancies can be stable as , , and whose formation energies are 2.08 eV or higher in \ceLiCoO2 and 1.43 eV or higher in \ceLiNiO2. We find that some neighboring Co3+ ions of the oxygen vacancy in \ceLiCoO2 possess an intermediate-spin (IS) state with a calculated magnetic moment of 1.73 , as compared to 0 of low-spin Co3+ and 3.12 of high-spin Co3+. However, with the high calculated formation energy in \ceLiCoO2, oxygen vacancies (and the associated IS Co3+) are unlikely to form. This may explain why there has been no experimental evidence for the presence of oxygen vacancies in \ceLiCoO2.Hertz et al. (2008) We note that the IS Co3+ has been proposed to be present in associated with oxygen vacancies in Li-excess Li1+xCoO2 by Levasseur et al.Levasseur et al. (2003) to explain for the observed paramagnetism. Several authors have also reported in their theoretical works that the IS state can be stabilized either in the bulkKoyama et al. (2012); Carlier et al. (2013) or at the surface;Qian et al. (2012) however, these authors did not comment on the energetics of the oxygen vacancy. Regarding the transition-metal vacancies, can be stable as , , , or with calculated formation energies of 2.78 eV or higher in \ceLiCoO2 and 2.63 eV or higher in \ceLiNiO2. Finally, can be stable as or whose formation energies are found to be 4.98 eV or higher in \ceLiCoO2 and 2.96 eV or higher in \ceLiNiO2. is in fact a complex of and with a binding energy of 1.88 eV (M=Co) or 0.37 eV (M=Ni). These vacancies all have very high calculated formation energies and are therefore not included in Fig. 4 and Table 3.
Antisite defects. Lithium antisites LiM are created by replacing M at an M site with Li. Li is Li+ replacing M3+. Due to the Coulombic interaction, the six nearest Li+ ion neighbors of Li are pulled closer to the negatively charged defect with the LiLi distance being 2.67 Å, compared to 2.85 Å of the equivalent CoLi distance in bulk \ceLiCoO2; in \ceLiNiO2 the average LiLi distance is 2.72 Å, compared with 2.89 Å of the equivalent NiLi distance in the bulk. Li, on the other hand, can be regarded as a complex of Li and with the distance between the two defects being 2.76 Å (M=Co) or 2.92 Å (M=Ni). The binding energy of Li with respect to Li and is 1.36 eV (M=Co) or 1.01 eV (M=Ni). Similarly, Li is a complex of Li and two , with the binding energy being 2.23 eV (M=Co) or 1.63 eV (M=Ni). Among the lithium antisites, the calculated formation energy of Li in \ceLiCoO2 can be as low as 0.89 eV and that of Li in \ceLiNiO2 can be as low as 0.68 eV, the values obtained at points A and B in the chemical potential diagrams in Figs. 3(a) and 3(b).
Transition-metal antisites MLi are created in a similar way by replacing Li at a Li site with M. We find that in M the transition metal is stable as high-spin M2+ with the calculated magnetic moment of 2.69 (M=Co) or 1.70 (M=Ni). The calculated formation energy of Co is as low as 0.55 eV in \ceLiCoO2 and that of Ni is as low as 0.53 eV in \ceLiNiO2; see Table 3. For M, we find that Co can be regarded as replacing Li+ with high-spin Co3+ which has a calculated magnetic moment of 3.13 . This defect has the formation energy in the range of 1.793.40 eV, which is much higher than that of Co. Ni, on the other hand, consists of Ni and , but these two defects are not stable as a unit because of the repulsive Coulomb interaction; the binding energy Ni with respect to Ni and is 0.23 eV. Finally, M can be regarded as a complex of M and with a binding energy of 0.54 eV (M=Co) or 0.45 eV (M=Ni). We find the energy of high-spin CoLi is significantly lower than that of metastable, low-spin CoLi, by 1.23, 0.92, 0.25, or 0.29 eV when charge state of the defect is 0, 1+, 2+, or 3+, respectively.
Defect complexes. The defects presented above can be categorized into elementary intrinsic defects (e.g., , , , M, and Li) and defect complexes (e.g., ) whose structure and energetics can be interpreted in terms of those of the former. In addition to the polaron-containing complexes, we also considered lithium divacancies. consists of two on the nearest-neighboring sites. This defect has a calculated formation energy of 1.653.53 eV in \ceLiCoO2 or 4.795.91 eV in \ceLiNiO2. In both compounds, it has a negative binding energy of 0.55 (M=Co) or eV (M=Ni), indicating that at the lithium concentration in our calculations the divacancy is unstable toward its individual constituents. is a complex of two and two with a binding of 0.99 eV (M=Co) or 1.13 eV (M=Ni) with respect to its individual constituents. Its calculated formation energy is in the range of 1.735.01 eV (M=Co) or 1.622.74 eV (M=Ni). Other defect complexes include MLi and M. The antisite defect pair is a complex of M, Li, and with a binding energy of 1.99 eV (M=Co) or 1.57 eV (M=Ni), and has a formation energy of 2.34 eV (M=Co) or 1.19 eV (M=Ni). M, on the other hand, has a binding energy of 0.51 (M=Co) or 0.17 eV (M=Ni) and a formation energy as low as 0.59 eV (M=Co) or 1.23 (M=Ni). The structure and energetics of some of these complexes are summarized in Table 3.
We note that a defect complex is not necessarily stable as a single unit, even if it has a finite, positive binding energy and a low formation energy; as discussed in Ref. Van de Walle and Neugebauer (2004), if the binding energy is smaller than the formation energy of the constituents, entropy favors the formation of individual defects.
Koyama et al.Koyama et al. (2012, 2013) also reported the calculated formation energies of intrinsic defects in \ceLiMO2. In their GGA+ calculations, =5 eV was used for both Co and Ni in all compounds, and corrections for finite-supercell-size effects were not included. Their results, assuming equilibrium with Li2O and O2 gas at 627∘C and 0.2 atm, appear to indicate that hole and electron polarons are the dominant defects in \ceLiCoO2 with a formation energy of 0.68 eV, whereas Ni is the dominant defect in \ceLiNiO2 with a formation energy of about 0.04 eV; see Figs. S2(a) and S2(b) in the Supporting Information of Ref. Koyama et al. (2012). Given the same equilibrium assumption, which translates into a set of the atomic chemical potentials that actually corresponds a point between points B and C along the Li2O line in Fig. 3(a), our calculations show that and are the dominant defects in \ceLiCoO2 but with a calculated formation energy of 1.27 eV. In \ceLiNiO2, the mentioned assumption translates into a set of atomic chemical potentials corresponding to a point on the Li2O line in Fig. 3(b) but much higher than point C and well beyond the region where \ceLiNiO2 is stable. In other words, the assumption that \ceLiNiO2 is in equilibrium with Li2O and O2 gas at 627∘C and 0.2 atm cannot be realized. This explains why the results for \ceLiNiO2 reported by Koyama et al. are qualitatively different from ours.
III.4 Defect migration
Migration of selected intrinsic point defects in \ceLiMO2 were investigated. For the electronic defects, the migration of a small polaron between two positions and can be described by the transfer of the lattice distortion over a one-dimensional Born-Oppenheimer surface.Iordanova et al. (2005a, b); Maxisch et al. (2006) To estimate the energy barrier, we computed the energies of a set of cell configurations linearly interpolated between and and identify the energy maximum. For the ionic defects, the NEB methodHenkelman et al. (2000) was used to estimate the migration barrier for the lithium vacancy via a monovacancy or divacancy mechanism. In the monovacancy mechanism, the migration path of the isolated is calculated by moving a Li+ ion from a nearby lattice site into the vacancy. In the divacancy mechanism, the defect structure was used and the migration path of one of the two lithium vacancies in the defect complex is calculated by moving a Li+ ion from a nearby lattice site into the vacancy.
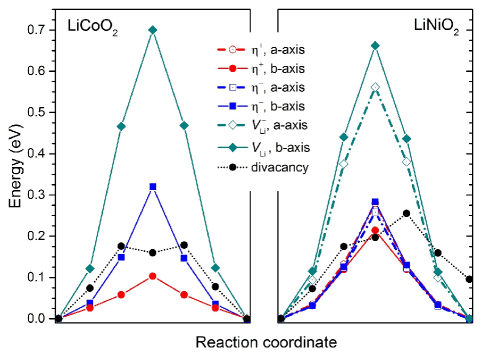
Figure 6 shows the calculated migration barriers for the small hole and electron polarons and lithium vacancies in \ceLiMO2. We find that the migration barriers of the polarons are low: 0.10 and 0.32 eV for the hole and electron polarons in \ceLiCoO2, respectively, and as low as 0.21 and 0.26 eV for the hole and electron polarons in \ceLiNiO2; see also Table 3. For the vacancies, the monovacancy mechanism gives rather high barriers: 0.70 eV in \ceLiCoO2 and as low as 0.56 eV in \ceLiNiO2. The divacancy mechanism, however, gives much lower barriers: 0.18 and 0.26 eV for the lithium vacancies in \ceLiCoO2 and \ceLiNiO2, respectively. We note that the migration paths along - and -axis in \ceLiNiO2 are slightly different and the migration path of the divacancy is not symmetric because of the Jahn-Teller distortion. Our results for the vacancies in \ceLiCoO2 are in agreement with those of Van der Ven and Ceder where migration barriers of about 0.8 and 0.2 eV were found for the monovacancy and divacancy mechanisms, respectively.Van der Ven and Ceder (2000)
IV Discussion
It emerges from our results for \ceLiCoO2 that defect landscapes in this compound are sensitive to the atomic chemical potentials, i.e., the experimental conditions during synthesis. At points A and B in the chemical-potential diagram, cf. Fig. 3(a), which represent highly oxidizing, Li-excess (Co-deficient) environments, the dominant intrinsic point defects are and Li. These two defects have a relatively low calculated formation energy (0.89 eV) and can exist as Li, a defect complex of Li and two . With a binding energy of 2.23 eV with respect to its individual constituents, and a formation energy of 0.92 eV, Li is expected to be stable as a unit. At points C and D, the dominant defects are Co and , which have a formation energy of 1.20 eV (at C) or 0.96 eV (at D). The defect complex of Co and , i.e., Co, is not expected to be stable as a unit because of its small binding energy (0.54 eV). At points E and F, the dominant defects are Co and , which have a low formation energy (0.55 eV). These two defects may form as Co, a defect complex of Co and which has a formation energy of 0.59 eV and a binding energy of 0.51 eV, although the complex is not expected to be stable as a unit. At point X, the dominant defects are and , which have a formation energy of 1.15 eV. These two defects may form as , a defect complex of and which has a formation energy of 1.90 eV, but this complex is, again, not expected to be stable as a unit because of its small binding energy (0.40 eV). Finally, the dominant defects could also be and , if the atomic chemical potentials correspond to a point between B and C along the \ceLi2O line in Fig. 3(a), as discussed in Sec. 3.3. The two defects in this case, however, have a relatively high formation energy (1.27 eV).
In the above mentioned defect scenarios, there are always low-spin Co4+ ions (in form of ) and/or high-spin Co2+ (in form of ) associated with the dominant defects in \ceLiCoO2, in addition to low-spin Co3+ ions. Our results are thus consistent with the fact that experimental studies of the magnetic properties always reveal localized magnetic moments.Chernova et al. (2011)
Cobalt antisites have been found in \ceLiCoO2 samples, especially those synthesized at low temperatures.Gummow et al. (1992) However, it should be noted that defect landscapes in \ceLiCoO2 may not have a simple dependence on the synthesis temperature. The oxygen chemical potential, which is usually controlled via controlling oxygen partial pressure and temperature, is just one of several variables that define defect formation energies and thus concentrations. Other variables include Li and Co chemical potentials, which involve the actual amount of Li and Co participating in the reaction that forms \ceLiCoO2. In fact, we find that defect formation energies are sensitive to the Co:Li ratio. Besides, when synthesized at lower temperatures, some processes may be kinetically hindered. Overall, in order to avoid forming Co antisites one has to move away from points CF and their nearby regions in the chemical-potential diagrams. Also, because of the difficulty in controlling the amount of volatile Li in the synthesis reaction, points A and B and their nearby region most likely represent the environments where one can obtain \ceLiCoO2 samples with good electrochemical performance. This may explain why \ceLiCoO2 in commercial applications is often made deliberately Li-excess.Chernova et al. (2011) Our results thus provide guidelines for defect-controlled synthesis and defect characterization.
In light of the results for \ceLiCoO2, let us re-examine a defect model for lithium over-stoichiometric \ceLiCoO2 which can be realized in experiments by using a reaction mixture with the Li:Co molar ratio of greater than 1, i.e., in Li-excess (Co-deficient) environments. This case is associated with the scenario obtained at points A and B in Fig. 3(a) as mentioned earlier. It has been suggested by several authors that the excess Li+ goes into the Co3+ site, thus forming Li, and the chemical formula of the over-stoichiometric \ceLiCoO2 can be written as Li1+δCo1-δO2-δ, where Li is charge-compensated by oxygen vacancy . The paramagnetism experimentally observed in this material is thought to be due an IS state of Co3+ that is associated with the oxygen vacancy.Levasseur et al. (2003); Carlier et al. (2013) Our studies, however, show that the dominant intrinsic defects in this case should be Li and . Besides, oxygen vacancies and hence the associated IS Co3+ are unlikely to occur in bulk \ceLiCoO2 because the vacancy formation energy is high. We suggest that the chemical formula should be written as Li1+δCo1-δO2 or, more explicitly, as [Li+]1+δ[Co4+]2δ[Co3+]1-3δ[O2-]2 where each Li is associated with two (i.e., Co4+), assuming that there are no extrinsic defects (impurities) in the material. The presence of low-spin Co4+ in our defect model is consistent with experimental data reported by Hertz et al.,Hertz et al. (2008) after their results have been corrected for an error in the magnetic moment calculations. Chernova et al. (2011) We note that the formation energy of oxygen vacancies can be lower at the surface or interface, given that the bonding environment there is less constrained than in the bulk. In that case, oxygen vacancies and the associated IS Co3+ ions may actually exist.
Regarding \ceLiNiO2, there are three major observations that can be drawn from our results. Firstly, \ceLiNiO2 is less stable than \ceLiCoO2, as suggested by the chemical-potential diagrams in Fig. 3. Stoichiometric \ceLiNiO2 can only be stable at much lower temperatures than stoichiometric \ceLiCoO2. Secondly, and are always the dominant intrinsic point defects and have a relatively small formation energy (0.51 eV), independent of the atomic chemical potentials. This indicates that a certain amount of Ni3+ ions in \ceLiNiO2 undergo charge disproportionation: 2Ni3+ Ni4+ + Ni2+, where Ni4+ and Ni2+ are stable in form of and . Finally, nickel antisites Ni have a low formation energy, as low as 0.53 eV and only as high as 0.96 eV. This low formation energy is thus consistent with the high concentration of Ni in the Li layers as reported in experiments.Barra et al. (1999); Chappel et al. (2002); Kalyani and Kalaiselvi (2005); Chernova et al. (2011) These individual issues, separately or in combination, must probably be responsible for the experimental observations reported in the literature, which include the difficulties in synthesizing \ceLiNiO2 at high temperatures, the absence of long-range Jahn-Teller distortion and magnetic ordering, and the poor electrochemical performance.Whittingham (2004); Dutta et al. (1992); Hirano et al. (1995); Kanno et al. (1994); Chernova et al. (2011); Kalyani and Kalaiselvi (2005); Barra et al. (1999); Chappel et al. (2002) Our results also suggest that tuning the synthesis conditions would not remove the charge disproportionation from \ceLiNiO2. The concentration of nickel antisite defects can be reduced by, e.g., synthesizing the material under the environments associated with points A and B in Fig. 3(b); however, even at these two points the formation energy of Ni in \ceLiNiO2 is still quite low (0.96 eV), unlike in \ceLiCoO2 where the formation energy of Co can be as high as 2.08 eV, cf. Table 3.
Let us now turn our discussion to the mechanisms for electronic and ionic conduction. The electronic or ionic conductivity resulted from hopping of a defect X carrying charge can be defined as , where and are the defect’s mobility and concentration, respectively.Elliot (1998) Let us assume that contains both thermally activated and athermal defect concentrations. The athermal defects can be, e.g., pre-existing small polarons or lithium vacancies, or those polarons and vacancies formed during delithiation. Eqn. (1) can then be rewritten as
| (6) |
where is the athermal defect concentration and is a prefactor. The mobility of the defects can also be assumed to be thermally activated, so
| (7) |
where is a prefactor and is the migration barrier. When the athermal defect concentration is small, e.g., at high temperatures and in nearly fully lithiated \ceLiMO2, the observed temperature dependence of the conductivity will be dominated by the second term in eqn. (6) and shows an effective, intrinsic activation energy
| (8) |
which includes both the formation energy and migration barrier. When the athermal defect concentration is large, e.g., at low temperatures and/or in partially delithiated LixMO2 (), the contribution to the electrical conductivity will be dominated by the athermal term in eqn. (6), and the activation energy will include only the migration part, i.e., .
As mentioned in Sec. 3.3, our results indicate that intrinsic point defects cannot act as sources of band-like electrons and holes, and there are no (or negligible) free holes or electrons in \ceLiMO2. The electronic conduction thus has to proceed via hopping of and/or . For the ionic conduction, lithium vacancies are most likely to be the charge-carrying defects, because other ionic defects either have very high formation energies and/or are expected to be immobile. From the calculated formation energies and migration barriers for the polarons and lithium vacancies listed in Table 3, one can easily estimate the activation energies of the electronic and ionic conductivities using the above formulae for . For example, the activation energy associated with in LixCoO2 can be as low as 0.10 eV, which is the migration barrier of ; in nearly fully lithiated \ceLiCoO2, the intrinsic activation energy can be as low as 0.99 eV, which is the lowest calculated formation energy plus the migration barrier of , cf. Table 3. We find that the contribution to the electronic conductivity from hopping of is almost always dominant, except at point D in Fig. 3(a) in the case of nearly fully lithiated \ceLiCoO2 where the intrinsic activation energy associated with is lower than that associated with by 0.40 eV. In \ceLiNiO2, and have comparable contributions to the electronic conductivity.
In nearly fully lithiated \ceLiMO2, the calculated formation energy of lithium divacancies is very high, therefore is expected to predominantly contribute to the ionic conductivity. The intrinsic activation energy associated with the diffusion of via a monovacancy mechanism can be as low as 1.25 eV (M=Co) or 1.43 eV (M=Ni), which is the lowest calculated formation energy value plus the migration barrier, cf. Table 3. In LixMO2, on the other hand, the lithium vacancy concentration is high and vacancy agglomerates such as divacancies and trivacancies may become energetically favorable. The migration of lithium vacancies in this case is expected to occur via a divacancy mechanism, and the activation energy can then be as low as 0.18 eV (M=Co) or 0.26 eV (M=Ni), which is the calculated vacancy migration barrier, cf. Fig. 6.
V Conclusions
We have carried out DFT studies of the bulk properties and intrinsic point defects in layered \ceLiMO2, using the HSE06 screened hybrid density functional. We find that stoichiometric \ceLiCoO2 is stable in a large region in the chemical-potential diagram, whereas the stability region of Jahn-Teller distorted \ceLiNiO2 is much smaller. \ceLiNiO2 without the Jahn-Teller distortion is not stable toward competing LiNiO phases.
LiCoO2 has a complex defect chemistry, resulting partly from the ability of Co ions to be stable in different charge and spin states. Different electronic and ionic defects such as small hole and electron polarons, lithium and transition-metal antisite defects, and lithium vacancies can form with high concentrations under different synthesis conditions. Cobalt antisites can be eliminated by synthesizing \ceLiCoO2 under Li-excess (Co-deficient) environments. In the lithium over-stoichiometric \ceLiCoO2, negatively charged lithium antisites are charge-compensated by positively charged small (hole) polarons. Oxygen vacancies have high formation energies and are thus not likely to form in the interior of the material.
In Jahn-Teller distorted \ceLiNiO2, both small hole and electron polarons are always the dominant intrinsic point defects and have a low formation energy, indicating that a certain amount of Ni3+ ions undergo charge disproportionation. Nickel antisites also have a low formation energy and hence high concentration. Our results suggest that tuning the synthesis conditions may lower the concentration of nickel antisites but would not remove the charge disproportionation.
Finally, we find that intrinsic point defects in layered oxides \ceLiMO2 cannot act as sources of band-like electrons and holes, and the materials cannot be doped - or -type. The electronic conduction proceeds via hopping of small polarons, and the ionic conduction proceeds via migration of lithium vacancies through either a monovacancy or a divacancy mechanism. In \ceLiCoO2, the activation energy associated with hole polarons can be as low as 0.10 eV, and that associated with lithium vacancies can be as low as 0.18 eV. In \ceLiNiO2, the lower limit of the activation energy for hole polarons is higher (0.210.28 eV) partly because of associated Jahn-Teller fluctuations and 0.26 eV for migration of lithium vacancies.
Acknowledgements.
We acknowledge helpful discussions with Noam Bernstein, and the use of computing facilities at the DoD HPC Center and the Center for Computationally Assisted Science and Technology (CCAST) at North Dakota State University. This work was supported, in part, by the U.S. Department of Energy (Grant Nos. DE-FG52-08NA28921 and DE-SC0001717), National Science Foundation EPSCoR (Award No. EPS-0814442), and CCAST. Funding for M.D.J. was provided by the U.S. Office of Naval Research through the Naval Research Laboratory’s Basic Research Program.References
- Whittingham (2004) M. S. Whittingham, Chem. Rev. 104, 4271 (2004) .
- Kalyani and Kalaiselvi (2005) P. Kalyani and N. Kalaiselvi, Sci. Tech. Adv. Mater. 6, 689 (2005).
- Gummow et al. (1992) R. Gummow, M. Thackeray, W. David, and S. Hull, Mater. Res. Bull. 27, 327 (1992).
- Chernova et al. (2011) N. A. Chernova, G. M. Nolis, F. O. Omenya, H. Zhou, Z. Li, and M. S. Whittingham, J. Mater. Chem. 21, 9865 (2011).
- Carewska et al. (1997) M. Carewska, S. Scaccia, F. Croce, S. Arumugam, Y. Wang, and S. Greenbaum, Solid State Ionics 93, 227 (1997).
- Levasseur et al. (2000) S. Levasseur, M. Menetrier, E. Suard, and C. Delmas, Solid State Ionics 128, 11 (2000).
- Levasseur et al. (2003) S. Levasseur, M. Menetrier, Y. Shao-Horn, L. Gautier, A. Audemer, G. Demazeau, A. Largeteau, and C. Delmas, Chem. Mater. 15, 348 (2003).
- Hertz et al. (2008) J. T. Hertz, Q. Huang, T. McQueen, T. Klimczuk, J. W. G. Bos, L. Viciu, and R. J. Cava, Phys. Rev. B 77, 075119 (2008).
- Carlier et al. (2013) D. Carlier, J.-H. Cheng, C.-J. Pan, M. Menetrier, C. Delmas, and B.-J. Hwang, J. Phys. Chem. C 117, 26493 (2013) .
- Dutta et al. (1992) G. Dutta, A. Manthiram, J. Goodenough, and J.-C. Grenier, J. Solid State Chem. 96, 123 (1992).
- Hirano et al. (1995) A. Hirano, R. Kanno, Y. Kawamoto, Y. Takeda, K. Yamaura, M. Takano, K. Ohyama, M. Ohashi, and Y. Yamaguchi, Solid State Ionics 78, 123 (1995).
- Kanno et al. (1994) R. Kanno, H. Kubo, Y. Kawamoto, T. Kamiyama, F. Izumi, Y. Takeda, and M. Takano, J. Solid State Chem. 110, 216 (1994).
- Barra et al. (1999) A.-L. Barra, G. Chouteau, A. Stepanov, A. Rougier, and C. Delmas, Eur. Phys. J. B 7, 551 (1999).
- Chappel et al. (2002) E. Chappel, M. D. Núñez Regueiro, S. de Brion, G. Chouteau, V. Bianchi, D. Caurant, and N. Baffier, Phys. Rev. B 66, 132412 (2002).
- Hoang and Johannes (2011) K. Hoang and M. Johannes, Chem. Mater. 23, 3003 (2011).
- Hoang and Johannes (2012) K. Hoang and M. D. Johannes, J. Power Sources 206, 274 (2012).
- Johannes et al. (2012) M. D. Johannes, K. Hoang, J. L. Allen, and K. Gaskell, Phys. Rev. B 85, 115106 (2012).
- Anisimov et al. (1991) V. I. Anisimov, J. Zaanen, and O. K. Andersen, Phys. Rev. B 44, 943 (1991).
- Van der Ven and Ceder (2000) A. Van der Ven and G. Ceder, Electrochem. Solid-State Lett. 3, 301 (2000).
- Kang and Ceder (2006) K. Kang and G. Ceder, Phys. Rev. B 74, 094105 (2006).
- Wang et al. (2007) L. Wang, T. Maxisch, and G. Ceder, Chem. Mater. 19, 543 (2007) .
- Laubach et al. (2009) S. Laubach, S. Laubach, P. C. Schmidt, D. Ensling, S. Schmid, W. Jaegermann, A. Thien, K. Nikolowski, and H. Ehrenberg, Phys. Chem. Chem. Phys. 11, 3278 (2009).
- Ensling et al. (2010) D. Ensling, A. Thissen, S. Laubach, P. C. Schmidt, and W. Jaegermann, Phys. Rev. B 82, 195431 (2010).
- Chevrier et al. (2010) V. L. Chevrier, S. P. Ong, R. Armiento, M. K. Y. Chan, and G. Ceder, Phys. Rev. B 82, 075122 (2010).
- Chen et al. (2011) H. Chen, C. L. Freeman, and J. H. Harding, Phys. Rev. B 84, 085108 (2011).
- Koyama et al. (2012) Y. Koyama, H. Arai, I. Tanaka, Y. Uchimoto, and Z. Ogumi, Chem. Mater. 24, 3886 (2012) .
- Koyama et al. (2013) Y. Koyama, H. Arai, I. Tanaka, Y. Uchimoto, and Z. Ogumi, J. Power Sources 244, 592 (2013).
- Dudarev et al. (1998) S. L. Dudarev, G. A. Botton, S. Y. Savrasov, C. J. Humphreys, and A. P. Sutton, Phys. Rev. B 57, 1505 (1998).
- Anisimov et al. (1993) V. I. Anisimov, I. V. Solovyev, M. A. Korotin, M. T. Czyżyk, and G. A. Sawatzky, Phys. Rev. B 48, 16929 (1993).
- Liechtenstein et al. (1995) A. I. Liechtenstein, V. I. Anisimov, and J. Zaanen, Phys. Rev. B 52, R5467 (1995).
- Perdew et al. (1996) J. P. Perdew, K. Burke, and M. Ernzerhof, Phys. Rev. Lett. 77, 3865 (1996).
- Van de Walle and Neugebauer (2004) C. G. Van de Walle and J. Neugebauer, J. Appl. Phys. 95, 3851 (2004).
- Freysoldt et al. (2009) C. Freysoldt, J. Neugebauer, and C. G. Van de Walle, Phys. Rev. Lett. 102, 016402 (2009).
- Freysoldt et al. (2011) C. Freysoldt, J. Neugebauer, and C. G. Van de Walle, phys. status solidi (b) 248, 1067 (2011).
- Heyd et al. (2003) J. Heyd, G. E. Scuseria, and M. Ernzerhof, J. Chem. Phys. 118, 8207 (2003).
- Paier et al. (2006) J. Paier, M. Marsman, K. Hummer, G. Kresse, I. C. Gerber, and J. G. Ángyán, J. Chem. Phys. 124, 154709 (2006).
- Heyd et al. (2006) J. Heyd, G. E. Scuseria, and M. Ernzerhof, J. Chem. Phys. 124, 219906 (2006).
- Blöchl (1994) P. E. Blöchl, Phys. Rev. B 50, 17953 (1994).
- Kresse and Joubert (1999) G. Kresse and D. Joubert, Phys. Rev. B 59, 1758 (1999).
- Kresse and Hafner (1993) G. Kresse and J. Hafner, Phys. Rev. B 47, 558 (1993).
- Kresse and Furthmüller (1996) G. Kresse and J. Furthmüller, Phys. Rev. B 54, 11169 (1996).
- Kresse and Furthmüller (1996) G. Kresse and J. Furthmüller, Comput. Mat. Sci. 6, 15 (1996).
- Zhou et al. (2004) F. Zhou, M. Cococcioni, C. Marianetti, D. Morgan, and G. Ceder, Phys. Rev. B 70, 235121 (2004).
- Monkhorst and Pack (1976) H. J. Monkhorst and J. D. Pack, Phys. Rev. B 13, 5188 (1976).
- Henkelman et al. (2000) G. Henkelman, B. P. Uberuaga, and H. Jónsson, J. Chem. Phys. 113, 9901 (2000).
- Hoang and Van de Walle (2013) K. Hoang and C. G. Van de Walle, Solid State Ionics 253, 53 (2013).
- Komsa et al. (2012) H.-P. Komsa, T. T. Rantala, and A. Pasquarello, Phys. Rev. B 86, 045112 (2012).
- Momma and Izumi (2011) K. Momma and F. Izumi, J. Appl. Cryst. 44, 1272 (2011).
- Li et al. (1993) W. Li, J. Reimers, and J. Dahn, Solid State Ionics 67, 123 (1993).
- Delmas et al. (1997) C. Delmas, J. Peres, A. Rougier, A. Demourgues, F. Weill, A. Chadwick, M. Broussely, F. Perton, P. Biensan, and P. Willmann, J. Power Sources 68, 120 (1997).
- Wang and Navrotsky (2004) M. Wang and A. Navrotsky, Solid State Ionics 166, 167 (2004).
- Wu et al. (2005) X. Wu, D. Vanderbilt, and D. R. Hamann, Phys. Rev. B 72, 035105 (2005).
- Gajdoš et al. (2006) M. Gajdoš, K. Hummer, G. Kresse, J. Furthmüller, and F. Bechstedt, Phys. Rev. B 73, 045112 (2006).
- Paier et al. (2009) J. Paier, R. Asahi, A. Nagoya, and G. Kresse, Phys. Rev. B 79, 115126 (2009).
- Ghosh et al. (2007) P. Ghosh, S. Mahanty, M. Raja, R. Basu, and H. Maiti, J. Mater. Res. 22, 1162 (2007).
- Kushida and Kuriyama (2002) K. Kushida and K. Kuriyama, Solid State Commun. 123, 349 (2002).
- Rosolen and Decker (2001) J. Rosolen and F. Decker, J. Electroanal. Chem. 501, 253 (2001).
- van Elp et al. (1991) J. van Elp, J. L. Wieland, H. Eskes, P. Kuiper, G. A. Sawatzky, F. M. F. de Groot, and T. S. Turner, Phys. Rev. B 44, 6090 (1991).
- Molenda et al. (2002) J. Molenda, P. Wilk, and J. Marzec, Solid State Ionics 146, 73 (2002).
- Scanlon and Watson (2011a) D. O. Scanlon and G. W. Watson, J. Mater. Chem. 21, 3655 (2011a).
- Scanlon and Watson (2011b) D. O. Scanlon and G. W. Watson, Phys. Chem. Chem. Phys. 13, 9667 (2011b).
- Rougier et al. (1995) A. Rougier, C. Delmas, and A. Chadwick, Solid State Comm 94, 123 (1995).
- Roy et al. (2013) A. Roy, A. Janotti, and C. G. Van de Walle, Appl. Phys. Lett. 102, 033902 (2013).
- Chase, Jr. (1998) M. W. Chase, Jr., NIST-JANAF Themochemical Tables, Fourth Edition (J. Phys. Chem. Ref. Data, Monograph 9, 1998) pp. 1–1951.
- Jain et al. (2013) A. Jain, S. P. Ong, G. Hautier, W. Chen, W. D. Richards, S. Dacek, S. Cholia, D. Gunter, D. Skinner, G. Ceder, and K. A. Persson, APL Materials 1, 011002 (2013).
- Hoang and Van de Walle (2009) K. Hoang and C. G. Van de Walle, Phys. Rev. B 80, 214109 (2009).
- Wilson-Short et al. (2009) G. B. Wilson-Short, A. Janotti, K. Hoang, A. Peles, and C. G. Van de Walle, Phys. Rev. B 80, 224102 (2009).
- Hoang et al. (2012) K. Hoang, A. Janotti, and C. G. Van de Walle, Phys. Rev. B 85, 064115 (2012).
- Stoneham et al. (2007) A. M. Stoneham, J. Gavartin, A. L. Shluger, A. V. Kimmel, D. Muñoz Ramo, H. M. Rønnow, G. Aeppli, and C. Renner, J. Phys.: Condens. Matter 19, 255208 (2007).
- Shluger and Stoneham (1993) A. L. Shluger and A. M. Stoneham, J. Phys.: Condens. Matter 5, 3049 (1993).
- Varley et al. (2012) J. B. Varley, A. Janotti, C. Franchini, and C. G. Van de Walle, Phys. Rev. B 85, 081109 (2012).
- Nagaraja et al. (2012) A. R. Nagaraja, N. H. Perry, T. O. Mason, Y. Tang, M. Grayson, T. R. Paudel, S. Lany, and A. Zunger, J. Am. Ceram. Soc. 95, 269 (2012).
- Qian et al. (2012) D. Qian, Y. Hinuma, H. Chen, L.-S. Du, K. J. Carroll, G. Ceder, C. P. Grey, and Y. S. Meng, J. Am. Chem. Soc. 134, 6096 (2012) .
- Iordanova et al. (2005a) N. Iordanova, M. Dupuis, and K. M. Rosso, J. Chem. Phys. 122, 144305 (2005a).
- Iordanova et al. (2005b) N. Iordanova, M. Dupuis, and K. M. Rosso, J. Chem. Phys. 123, 074710 (2005b).
- Maxisch et al. (2006) T. Maxisch, F. Zhou, and G. Ceder, Phys. Rev. B 73, 104301 (2006).
- Elliot (1998) S. Elliot, The Physics and Chemistry of Solids (John Wiley & Sons Ltd., 1998) p. 185.