State-selective intersystem crossing in nitrogen-vacancy centers
Abstract
The intersystem crossing (ISC) is an important process in many solid-state atomlike impurities. For example, it allows the electronic spin state of the nitrogen-vacancy (NV) center in diamond to be initialized and read out using optical fields at ambient temperatures. This capability has enabled a wide array of applications in metrology and quantum information science. Here, we develop a microscopic model of the state-selective ISC from the optical excited state manifold of the NV center. By correlating the electron-phonon interactions that mediate the ISC with those that induce population dynamics within the NV center’s excited state manifold and those that produce the phonon sidebands of its optical transitions, we quantitatively demonstrate that our model is consistent with recent ISC measurements. Furthermore, our model constrains the unknown energy spacings between the center’s spin-singlet and spin-triplet levels. Finally, we discuss prospects to engineer the ISC in order to improve the spin initialization and readout fidelities of NV centers.
pacs:
63.20.kd,63.20.kp,78.47.-p,42.50.MdI Introduction
The nitrogen-vacancy (NV) center in diamond has recently been applied to a diverse range of room-temperature applications in metrology and quantum information science. NV centers have been used to sense such quantities as the temperature and magnetic fields of living cells Kucsko et al. (2013); Le Sage et al. (2013), the magnetic field of a single electron spin Grinolds et al. (2013), the magnetic field noise of a few molecules Ermakova et al. (2013); Sushkov et al. , an electric field equivalent to a single electron at a distance of 35 nm Dolde et al. (2011), and pressures of up to 60 GPa Doherty et al. (2014). NV centers can also function as room-temperature quantum registers, where the electronic spin can be coherently coupled to the nitrogen nucleus Dutt et al. (2007) by decoherence-protected gates van der Sar et al. (2012) and proximal nuclear spins with second-long coherence times Maurer et al. (2012) can serve as storage qubits. These applications depend on the optical initialization and readout of the NV center’s electronic spin, techniques which are enabled by the intersystem crossing (ISC) mechanism.
The ISC mechanism, which refers to nonradiative transitions between states of different spin multiplicity, has been previously investigated both theoretically Manson et al. (2006) and by indirect experimental methods, such as measurements of spin-resolved fluorescence lifetimes Toyli et al. (2012); Batalov et al. (2008); Robledo et al. (2011a) and spin dynamics under nonresonant optical excitation Manson et al. (2006); Robledo et al. (2011a); Tetienne et al. (2012). While the previous theoretical investigation of the ISC mechanism established that it involves both spin-orbit and electron-phonon interactions, it did not provide a detailed microscopic model of the mechanism. Recently, the ISC rates from each of the fine structure states of the center’s optical excited level have been measured at cryogenic temperatures Goldman et al. . These new measurements complete a comprehensive experimental picture of the ISC from the optical excited level, thereby motivating new theoretical efforts to develop a detailed model of the ISC mechanism.
In this paper, we present such a microscopic model of the state-selective ISC from the optical excited state manifold of the NV center. We show that the electron-phonon interactions that mediate the ISC are closely linked with those that induce population dynamics within the NV center’s excited state manifold and those that produce the phonon sidebands (PSBs) of its optical transitions. This correspondence enables us to use recent measurements of the phonon-induced population mixing rate Goldman et al. and the PSB of the visible transition Kehayias et al. (2013) as experimental inputs to our model, and we quantitatively demonstrate that our model is consistent with recent ISC measurements. Additionally, our model constrains the unknown energy spacings between the center’s spin-singlet and spin-triplet levels to spectral regions that may be probed in future measurements. The identification of these energy spacings will resolve the most significant unknown aspect of the center’s electronic structure. Finally, we discuss how our new understanding yields prospects to engineer the ISC to improve the spin initialization and readout fidelities of NV centers at room temperature.
This work is structured as follows: In Sec. II, we describe the NV center, present the formalism of our model of the ISC mechanism, and explicitly calculate the ISC rates from different states in the manifold. We also calculate the phonon-induced mixing rate between and , which enables us to extract the NV-phonon coupling strength from prior experimental observations. In Sec. III, we compare the results of our model to recently measured state-selective ISC rates at cryogenic temperatures, which enables us to place bounds on the energy spacing between the spin-triplet and -singlet states. In Sec. IV, we extend our model to higher temperature and show that it is consistent with previous observations of spin-dependent fluorescence lifetimes. We conclude in Sec. V by suggesting future theoretical and experimental directions.
II ISC Model
II.1 Level Structure of NV Center
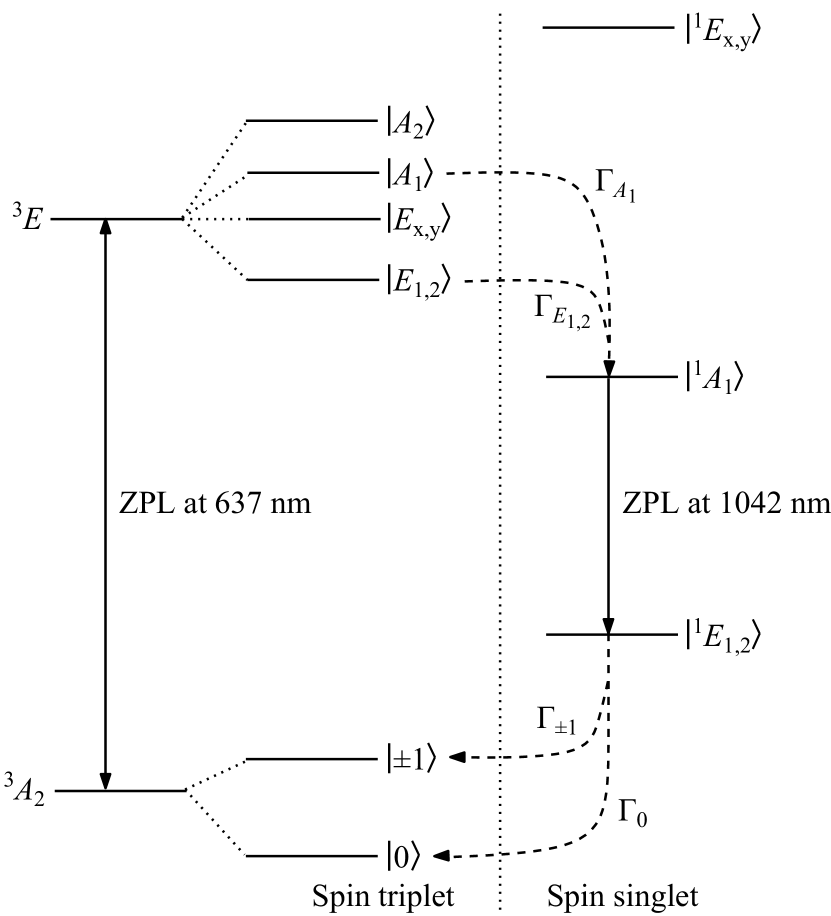
The NV center is a point defect of symmetry that consists of a substitutional nitrogen atom adjacent to a vacancy in the diamond lattice. In the negative charge state, six electrons occupy the four dangling orbitals of the nitrogen and the vacancy’s three nearest-neighbor carbon atoms Maze et al. (2011); Doherty et al. (2011). The four atomic orbitals linearly combine to form four symmetry-adapted molecular orbitals (, , , ), such that the ground electronic configuration is . The ground electronic state (labeled ) is an orbital-singlet, spin-triplet manifold (see Fig. 1 for the NV center’s electronic structure). Within , there is a doublet of states with spin projection along the N-V axis (labeled ) located 2.87 GHz above one state with (labeled ). The ground electronic configuration also contains an orbital-singlet, spin-singlet state that is higher in energy than the orbital-doublet, spin-singlet states . The and singlet states are coupled by an optical transition with a zero-phonon line (ZPL) at 1042 nm Rogers et al. (2008). The first excited electronic configuration () consists of the optical excited orbital-doublet, spin-triplet manifold , as well as the orbital doublet, spin-singlet states . The manifold is coupled to the ground state manifold by an optical transition with a ZPL at 637 nm. The two orbital states and three spin states of the manifold combine to give a total of six fine structure states: two (labeled and ) have zero spin angular momentum projections, while the other four (labeled , , , and ) are entangled states of nonzero spin and orbital angular momentum projections.
The spin dynamics of the NV center under optical illumination are driven by radiative transitions between states of the same spin multiplicity as well as nonradiative ISCs between states of different spin multiplicity (see Fig. 1). There are two distinct ISCs: from the optical excited manifold to the higher energy singlet state , and from the lower energy singlet states to the ground manifold. The ISC from the manifold may occur from either with rate or from with rate Goldman et al. . While direct ISCs from and are not forbidden, their rates have been established to be negligible compared to and at cryogenic temperatures Goldman et al. . This hierarchy reflects the directness of the physical process that couples each state to the singlet states: the ISCs from and are respectively mediated by first- and second-order processes, as discussed in Secs. II.3 and II.4, and the lowest-order allowed ISC processes from and would be third-order, as discussed in Ref. Goldman et al., . The ISC from the manifold is thus highly state-selective. The ISC to the manifold occurs from to either with rate or with rate . The ratio appears to vary between centers with observed values in the range 1.1–2 Robledo et al. (2011a); Tetienne et al. (2012). While further investigations are required, it is clear that there is no strong state selectivity of the ISC to the manifold.
Under optical excitation, the radiative transitions between the and manifolds conserve electronic spin-projection, whereas the highly state-selective ISC transitions from the manifold to preferentially depopulate and , and the ISC transitions from to the manifold serve to repopulate the ground state for the next optical cycle. The preferential nonradiative depopulation of and gives rise to optical spin readout because these states have lower quantum yield Doherty et al. (2013). Since the nonradiative repopulation of the manifold from does not appear to be comparably state-selective, the preferential nonradiative depopulation of and is also predominately responsible for the optical initialization of the electronic spin into Doherty et al. (2013). Given the central role of the ISC from the optical excited manifold to in the NV optical-spin cycle, we focus our attention on developing a microscopic model of this ISC.
II.2 ISC Mechanism
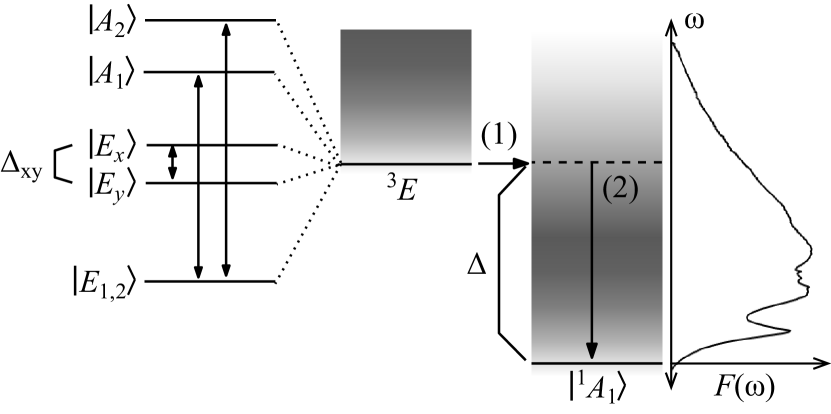
ISCs from the manifold to the state occur in two stages (see Fig. 2): (1) an energy-conserving transition from the initial state within the manifold to a resonant excited vibrational level of the state, and (2) relaxation of the excited vibrational level to the ground (or thermally occupied) vibrational level of . The first stage requires a change in both the electron spin and orbital states as well as the lattice vibrational state, and is thus mediated by a combination of spin-orbit (SO) and electron-phonon interactions. The second stage is mediated by phonon-phonon interactions, which enables the vibrational excitation to dissipate into propagating phonon modes. As the vibrational relaxation occurs on picosecond timescales Huxter et al. (2013), the ISC rate is defined by the initial electronic transition.
The model of these transitions requires the description of the quasi-continuum of vibronic levels of the and electronic states. Coulombic interactions between the NV center’s electrons and proximal nuclei induce a local -symmetric deformation of the diamond lattice. Because this Coulomb force depends on the electronic charge density, the equilibrium lattice configuration depends on the NV center’s electronic orbital state Gali et al. (2011); Zhang et al. (2011). Adopting the Born-Oppenheimer and harmonic approximations, the dependence of the NV center’s energy on the positions of proximal nuclei can be modeled as a series of quadratic potentials centered on a common electronic state-dependent equilibrium point. Thus, the vibronic levels of each electronic state take the direct product form: and , where and are the vibrational levels of and , respectively, with vibrational energies Bransden and Joachain (2003); Stoneham (2001). Here, denotes the set of occupation numbers of all vibrational modes of the specified electronic state. The vibrational level and energy are then given by and , respectively, where is the energy of the vibrational mode.
Electron-phonon interactions with -symmetric phonon modes do not couple electronic states, but allow transitions between the vibrational levels of each electronic state. As a consequence, there exist non-zero overlaps of different vibrational levels of and . Since the state belongs to the same electronic configuration as the ground manifold, their electron densities are similar, and thus the vibrational overlaps are expected to be well approximated by those between the and manifolds that are observed in the visible emission PSB Kehayias et al. (2013).
Electron-phonon interactions with -symmetric phonon modes couple electronic orbital states. Consequently, they can drive spin-conserving transitions between the states of the manifold (see Fig. 2). The interactions with -symmetric phonons within the manifold are described by Maze et al. (2011)
| (1) |
where
| (2) |
and are the creation and annihilation operators of an -symmetric phonon with wavevector and polarization 111In group theoretical terms, the polarizations correspond to the first and second rows of the irreducible representation. Geometrically, phonons of these polarizations induce strain of symmetry, as defined in Ref. Maze et al., 2011, which distorts the lattice in directions that are perpendicular to the N-V axis., and is the associated phononic coupling rate.
The SO interaction has two components. The axial SO interaction [, where () is the -component of the electronic spin (orbital angular momentum)] defines observable aspects of the fine structure but does not couple states with to spin-singlet states. On the contrary, the transverse SO interaction [] cannot be directly observed in the fine structure Doherty et al. (2011); Maze et al. (2011), but gives rise to the coupling
| (3) |
In the following subsections, we explicitly calculate the ISC rates from and the phonon-induced mixing rate between different states. We perform this calculation by treating and as time-dependent perturbations to the vibronic states of and defined by electron-phonon interactions with -symmetric phonons. The vibrational overlap function of the visible emission PSB is used to approximate the vibrational overlaps between states in the manifold and . We perform the calculations in the low-temperature limit applicable to the cryogenic temperatures at which the state-selective ISC rates were recently measured Goldman et al. , where only the ground vibrational levels of the manifold are populated prior to the ISC transitions to . We extend our calculations to higher temperatures in Sec IV.
II.3 ISC Rate from
Transverse SO interaction directly couples with the resonant excited vibrational states of . Consequently, this rate can be calculated by the application of first-order Fermi’s golden rule
| (4) |
where is the energy spacing between and (neglecting fine structure of ). The ISC rate is proportional to the overlap between (the ground vibrational state of ) and (an excited vibrational level of that is separated from by an energy spacing ). We perform the sum over in order to define a vibrational overlap function
| (5) |
where is the density of excited vibrational states that are resonant with and the average is over all such states.
We substitute the vibrational overlap function, which encapsulates all relevant information about the quasi-continuum of vibrational modes, into Eq. 4 to find
| (6) |
II.4 ISC Rate from
An analogous first-order ISC process is not responsible for the ISC transition from ; cannot decay to because there is no SO coupling between these states, and we expect decay to to be negligible because the energy spacing (1190 meV Acosta et al. (2010)) is large compared to the extent of the phonon sideband ( meV Davies (1974); Kehayias et al. (2013)). Instead, ISC decay from is the result of a second-order process wherein phonons of symmetry couple to and is SO-coupled to . We calculate the ISC rate from using second-order Fermi’s golden rule and find
| (7) |
where is the energy of a phonon of wavevector . The two distinct terms within the sum correspond to phonon emission and absorption.
We introduce the -independent phonon energy , over which we integrate to pull out the polarization-specific phonon spectral density
| (8) |
In the linear dispersion regime, where the wavelength of acoustic phonons is much larger than the lattice spacing, the coupling strength for interactions mediated by deformations of the lattice is given by the standard deformation potential ( Weiss (2008)) and the phonon density of states is described by the Debye model (). The total spectral density is therefore
| (9) |
where parameterizes the coupling strength between the states of the manifold and -symmetric acoustic phonons.
We insert this spectral density and the appropriate vibrational overlap functions to find
| (10) |
where
| (11) |
is the thermal occupation of a phonon mode of energy . We assume a cutoff energy for acoustic phonons.
To illustrate the range of phonon energies that contribute to , we define a rate that is mediated only by -symmetric phonons of energy , such that . The contributions to due to phonon emission and absorption are shown in Fig. 3. The dominant contribution to comes from high-energy phonon modes, whose thermal occupations are negligible at K. This conclusion is valid for all values of because the vibrational overlap function changes slowly on the scale of meV. We may therefore neglect thermal occupation of the mediating phonon modes and take the low-temperature limit of when working at cryogenic temperatures, assertions that we will justify in Sec. III.2.
In the low-temperature limit, the ISC rate from is given by
| (12) |
The range of phonon modes that contribute to is bounded either by the cutoff energy , or by the fact that for at low temperature [see Sec. IV.1].
If second-order ISC processes that use as intermediate states are taken into account, as described in the appendix, then is modified to
| (13) |
We note that this secondary ISC process only contributes significantly to the total ISC rate from because it interferes coherently with the primary ISC process, which uses as the intermediate state.
II.5 Phonon-Induced Mixing Rate
We now explicitly calculate the phonon-induced mixing rates between the states in the manifold. Doing so will enable us to extract the value of , which parameterizes the NV-phonon coupling strength, from a temperature-dependent measurement of the mixing rate Goldman et al. .
We use a technique similar to that used to calculate the ISC rate from in the previous section. We begin with the mixing rate between and . The dominant contribution to the mixing rate in the low-strain regime ( GHz for the experiment in question Goldman et al. ) is from a two-phonon Raman processes wherein one phonon is emitted and another is absorbed Fu et al. (2009). Following Ref. Fu et al., 2009, we use second-order Fermi’s golden rule to find that this mixing rate is
| (14) |
We substitute the expression for the spectral density in the acoustic limit (Eq. 9). We keep only the highest-order term in because the integrand in Eq. II.5 is only appreciable for and, as in the previous section, we define an mixing rate
| (15) |
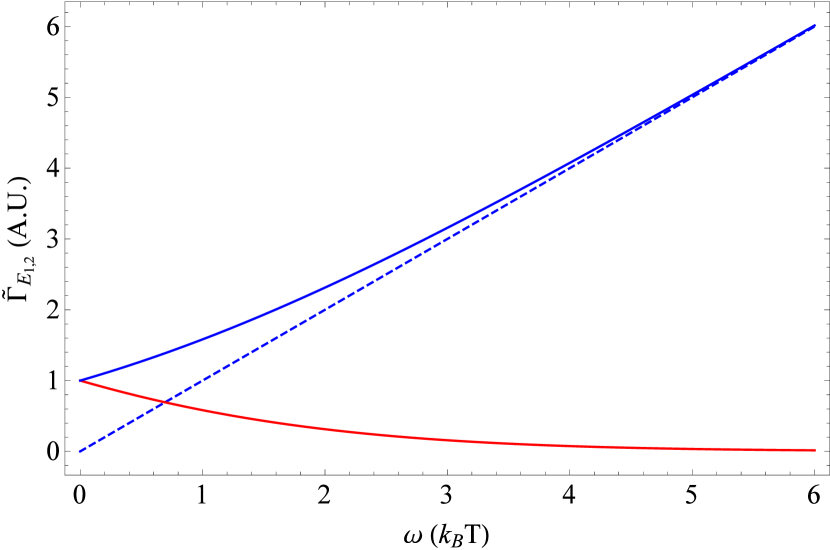
that is mediated only by phonons of energies and . As is shown in Fig. 4, contributions to the total mixing rate are dominated by phonon modes with energy of order . Higher-energy phonons have significantly larger spectral densities, but the emission-absorption Raman process requires that the phonon mode of energy have non-negligible thermal occupation. Unlike with the ISC rate from , which is mediated mainly by high-energy phonons, the contributions to the mixing rate from phonon modes with energies larger than approximately 20 meV are exponentially suppressed at cryogenic temperatures, so we need not impose a cutoff energy for the available phonon modes.
We therefore find the total mixing rate
| (16) |
The numeric constant is given by the integral
| (17) |
where and .
The mixing rates due to other processes are negligible. There are two alternate two-phonon processes, wherein both phonons are either absorbed or emitted, but they do not conserve energy and contribute negligibly, respectively. There is a direct one-phonon emission process, for which we calculate a transition rate
| (18) |
where the approximation is true for . This one-phonon rate is negligible when the strain splitting is small. For example, we calculate that a strain splitting of at least GHz is required to produce a measurable ( MHz) one-phonon mixing rate at 5 K, whereas this analysis assumes GHz to match Ref. Goldman et al., . We note that a mixing rate that scales as rather than would be more difficult to suppress using standard liquid helium cryogenic techniques with K. This consideration may explain why a previous measurement of phonon-induced mixing Fu et al. (2009) found that the mixing rate was increased for NV centers with higher strain splittings (44 to 81 GHz, compared with 8 and 9 GHz) and did not appear to asymptote to a constant value at low temperatures to the same degree. The effect of the one-phonon mixing process may be even more substantial for NV centers, such as those formed by nitrogen implantation or placed inside nanofabricated structures, where damage to the local crystalline structure may induce a large strain splitting.
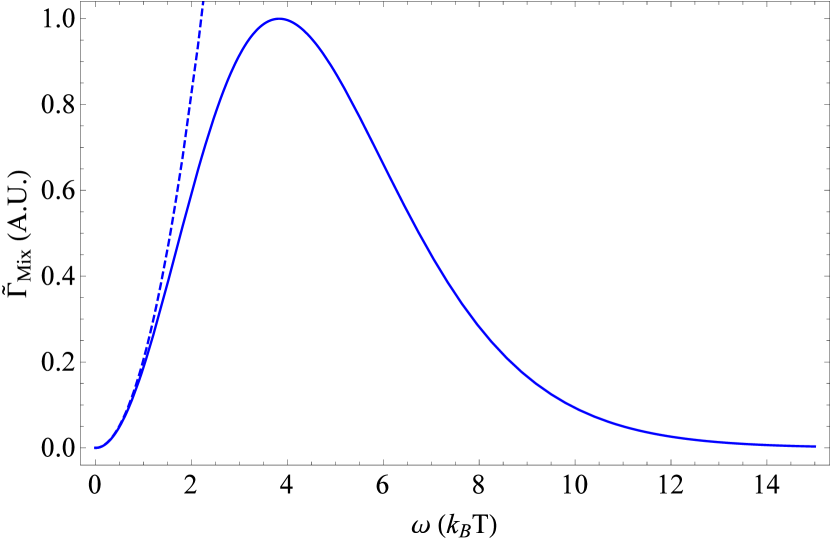
We now calculate the phonon-induced mixing rate between and . This calculation is similar to that of the mixing rate. Instead of coupling and splitting the energies of and , phonons of symmetry couple and with and . The fact that the intermediate electronic state ( or ) is not degenerate with the initial or final state ( or ), gives rise to a resonance condition when the energy of the emitted phonon is equal to the splitting between the initial and intermediate electronic states. This resonance condition, however, is irrelevant because the mixing process is dominated by phonons with energy GHz, as shown in Fig. 4. Because the typical phonon energy is large compared to the 10 GHz splitting between or and , the mixing rate between and is unaffected by the detuning of the intermediate state and is also given by Eq. 16. The mixing rate between and is also given by Eq. 16 for the same reasons, although mixing between these two states cannot be observed directly using the techniques employed in Ref. Goldman et al., because the ISC rates from both states are the same.
Further, both and are coupled to both and by a one-phonon process, whose rate in all four cases is given by Eq. 18 with replaced by the appropriate energy splitting. For the reverse process, from and to and , we replace with , but the result is the same in the limit . Thus, the cyclicity of the nominally closed system, like that of the cycling transition, may be degraded in NV centers with high strain splittings.
III Comparison to Measurements
III.1 ISC Rate from

We now compare the results of the preceding calculations to the measured state-selective ISC rates Goldman et al. , with the goal of extracting the previously unknown energy spacing between the spin-singlet and spin-triplet levels. We first compare the calculated ISC rate from , which depends on the transverse SO coupling rate and the vibrational overlap function , with the measured MHz.
Most of the uncertainty in our theoretical prediction of is the result of the lack of precision with which is known. The axial SO coupling rate GHz has been measured precisely through spectroscopy of the manifold Bassett et al. (2014), but cannot be determined through similar methods. An approximate theoretical argument implies that . Due to the similar mass and charge of nitrogen and carbon atoms, the symmetric structure of the NV center is only a small departure from the symmetric structure of a vacancy in the diamond lattice. Given that precisely in symmetry, it is expected that in the slightly perturbed symmetry of the NV center Manson et al. . This argument is supported by preliminary ab initio calculations that estimate the ratio Doherty ; Maze et al. (2011). To reflect the uncertainty in the value of , we select a confidence band of .
We extract the vibrational overlap function from spectroscopy of the emission PSB conducted at 4 K Kehayias et al. (2013). As we describe in Sec. IV.1, is, in principle, temperature-dependent. However, the dominant and lowest-energy feature in the one-phonon spectrum extracted from the PSB occurs at K Kehayias et al. (2013). Because phonons with such large energies are negligibly occupied at temperatures below 26 K, we assume that is effectively temperature-independent for our analysis of the low-temperature ISC rate.
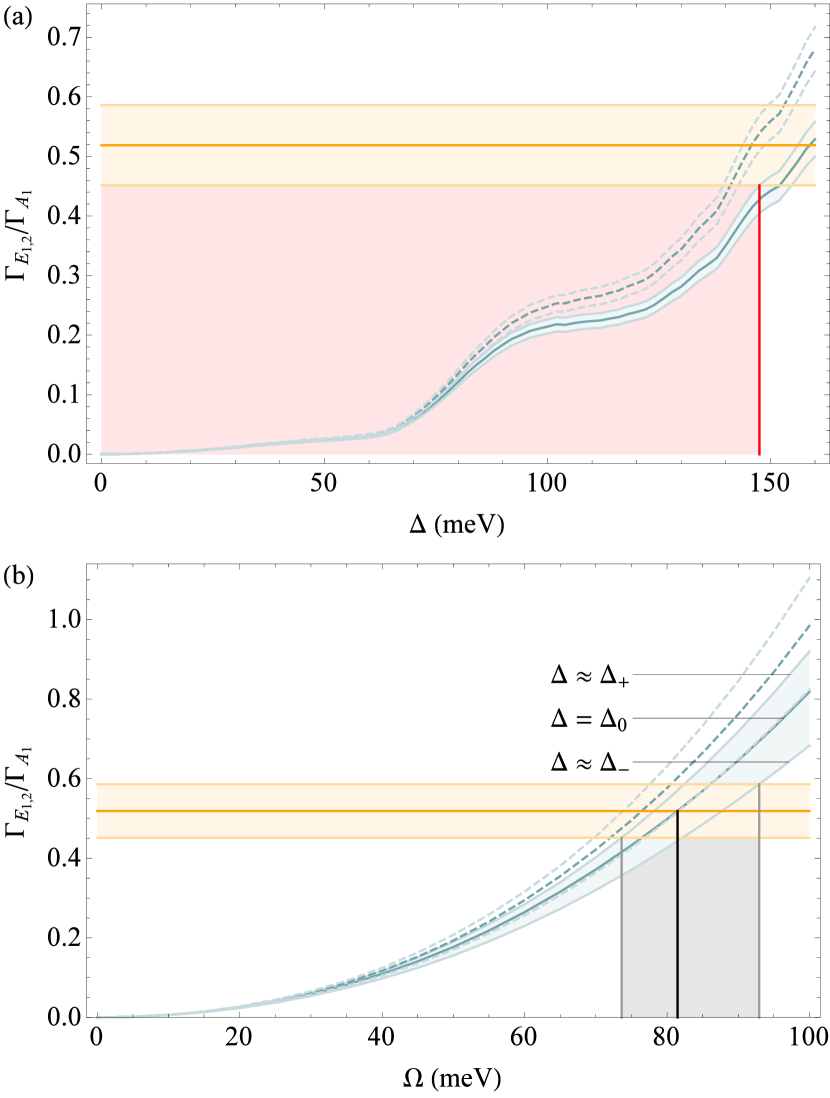
In Fig. 5, we compare the measured and predicted values of in order to extract , the previously unknown energy splitting. This analysis confines to two regions: around 43 meV, and from meV to meV with a central value of meV. We exclude values of below 148 meV because the predicted ISC rate from would be significantly lower than the observed rate, as explained in Sec. III.2. The uncertainty in is dominated by the uncertainty in , so a precise calculation of the ratio could narrow the bounds on considerably.
III.2 ISC Rate from
We also compare the measured and predicted ratios of the ISC rates from and . This ratio, which is given by
| (19) |
has the advantage of being insensitive to the uncertainty in , which limits the precision of our determination of . It is, however, sensitive to uncertainty concerning the range of acoustic -symmetric phonon modes that contribute to . We use the expression for derived in the low-temperature limit (Eq. 12), which we will justify at the end of this section. We use the value of extracted from a measurement of as a function of temperature Goldman et al. .
We analyze the ratio in both of the regions identified by our analysis of : and . In the first region, shown in fig. 6, the predicted ratio is significantly lower than the measured ratio, even when we assume no acoustic cutoff energy (). This inconsistency excludes values of up to 148 meV, which eliminates the region entirely. In the second region, we do not assume an infinite cutoff energy, but instead find the cutoff energy that would make the predicted ratio consistent with measurement, as shown in fig. 6. Our analysis predicts an acoustic phonon cutoff energy between 74 and 93 meV. This range coincides with a sharp and significant decline in the phonon spectral density extracted from the absorption PSB of the optical transition Tri ; Davies (1974). This agreement implies that the range of the predicted phonon cutoff energy is physically sensible, despite being near the upper limit of the acoustic phonon regime Pavone et al. (1993); Warren et al. (1967). Our approximate expression for the phonon spectral density (Eq. 9) is derived in the acoustic limit, but any correction that should be made to this approximation is swept into the phenomenological cutoff . Hence, we conclude that the second region is fully consistent with the observed ISC rates.
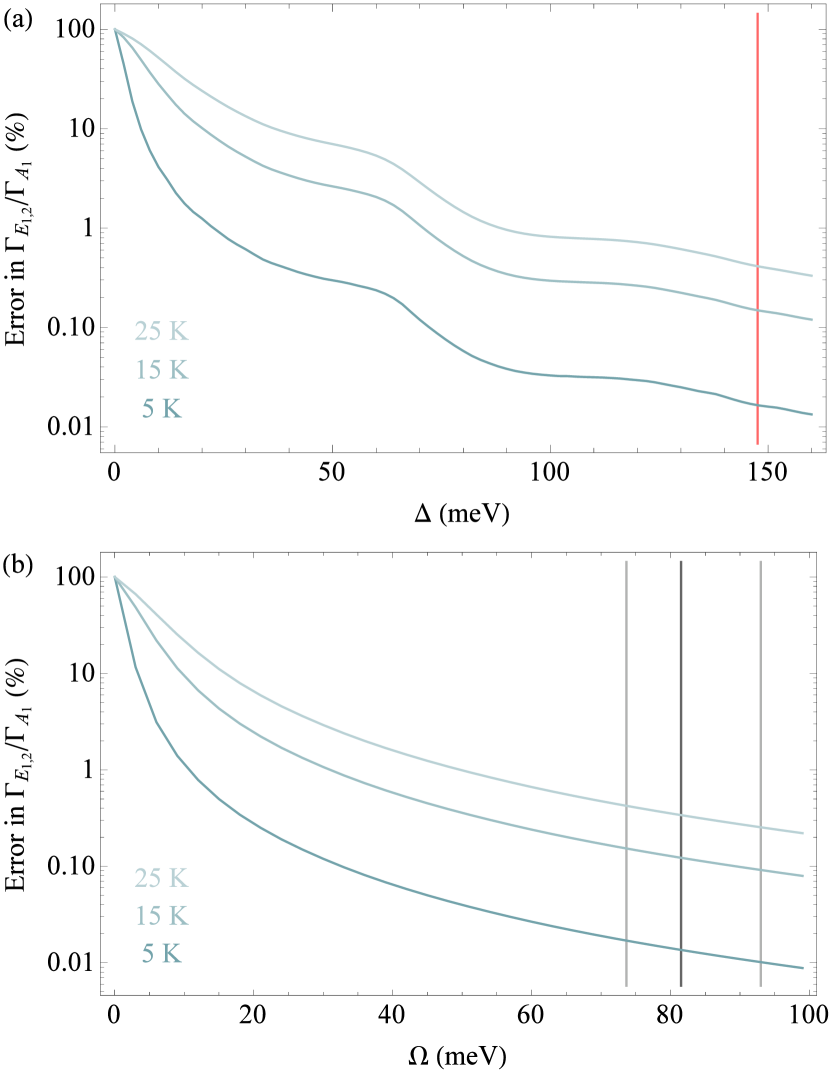
We now support the assumption made in Sec. II.4 that we may neglect thermal occupation of the -symmetric phonon modes that mediate the ISC from . In Fig. 7, we calculate the error due to neglecting the contribution to due to stimulated emission and absorption of phonons. While this assumption would not be valid if either or were small, we see that the resulting error is less than for the values of and extracted from our analyses of and .
IV Extension to High Temperatures
IV.1 Method
We scale our model up to higher temperatures to compare the predicted lifetimes of the states with to measurements conducted at temperatures between 295 K and 700 K Toyli et al. (2012); Batalov et al. (2008); Robledo et al. (2011a). In Secs. II.3 and II.4, we calculated the ISC rates from and in the low-temperature limit.
Extension of the ISC model to higher temperatures requires three modifications to the ISC calculation: Because of phonon-induced orbital averaging Rogers et al. (2009), which is significant even at K Goldman et al. , the observed ISC rate will be the average ISC rate from all states with . The -symmetric phonon modes that mediate the ISC transition from have non-negligible thermal occupation. We must therefore consider ISC contributions due to stimulated and spontaneous emission into these modes, as well as absorption from these modes. The -symmetric phonon modes that are primarily responsible for shifting the lattice from its equilibrium configuration to its equilibrium configuration have non-negligible thermal occupation, so the vibrational overlap function becomes broader and flatter at higher temperatures.
To address modification , we calculate the orbitally averaged ISC rate
| (20) |
where is given by Eq. 6.
To address modification , we use as given by Eq. II.4, which includes contributions due to both phonon absorption and emission, instead of Eq. 12, which is calculated in the low-temperature limit.
To address modification , we calculate the temperature-dependent vibrational overlap function using the procedure given in Ref. Davies, 1974. We first extract the low-temperature one-phonon spectral density by numerically deconvolving the low-temperature phonon sideband , which was used in Secs. II.3 and II.4 to calculate the low-temperature ISC rates from and . The resulting is shown in red in Fig. 4 of Ref. Kehayias et al., 2013, whose measurement of we use throughout our analysis.
The temperature-dependent one-phonon vibrational overlap function is given by
| (21) |
Temperature-dependent multi-phonon vibrational overlap functions can be calculated recursively using
| (22) |
and then summed to find the total temperature-dependent vibrational overlap function
| (23) |
Here,
| (24) |
is the temperature-dependent Huang-Rhys factor, where is the low-temperature Huang-Rhys factor for the transition Kehayias et al. (2013).
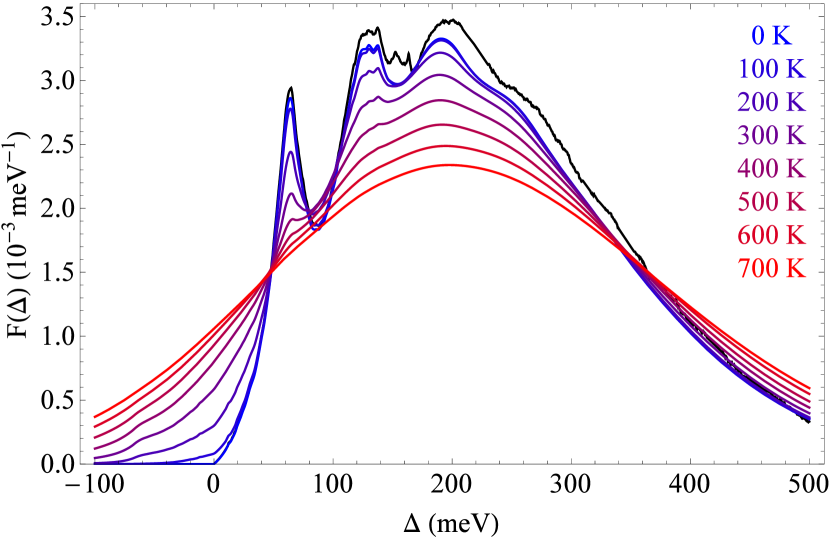
In Fig. 8, we plot the calculated for temperatures between 0 and 700 K. We note a slight discrepancy between the measured low-temperature and the calculated at 0 K. There is a degree of imprecision inherent in this method of generating , but it should be sufficient to calculate the temperature trend of the theoretical ISC rates.
IV.2 Results
We now numerically calculate the orbitally averaged ISC rate for the states (Eq. 20) using the temperature-dependent expressions for (Eq. II.4) and (Eq. 23, plotted in Fig. 8). We convert this ISC rate to the observed fluorescence lifetime using
| (25) |
where MHz is the radiative decay rate of states in the manifold Goldman et al. . We use as numeric inputs the range of and the associated values of , extracted from the analyses shown in Figs. 5 and fig. 6, that produce the measured ratio at low temperature.
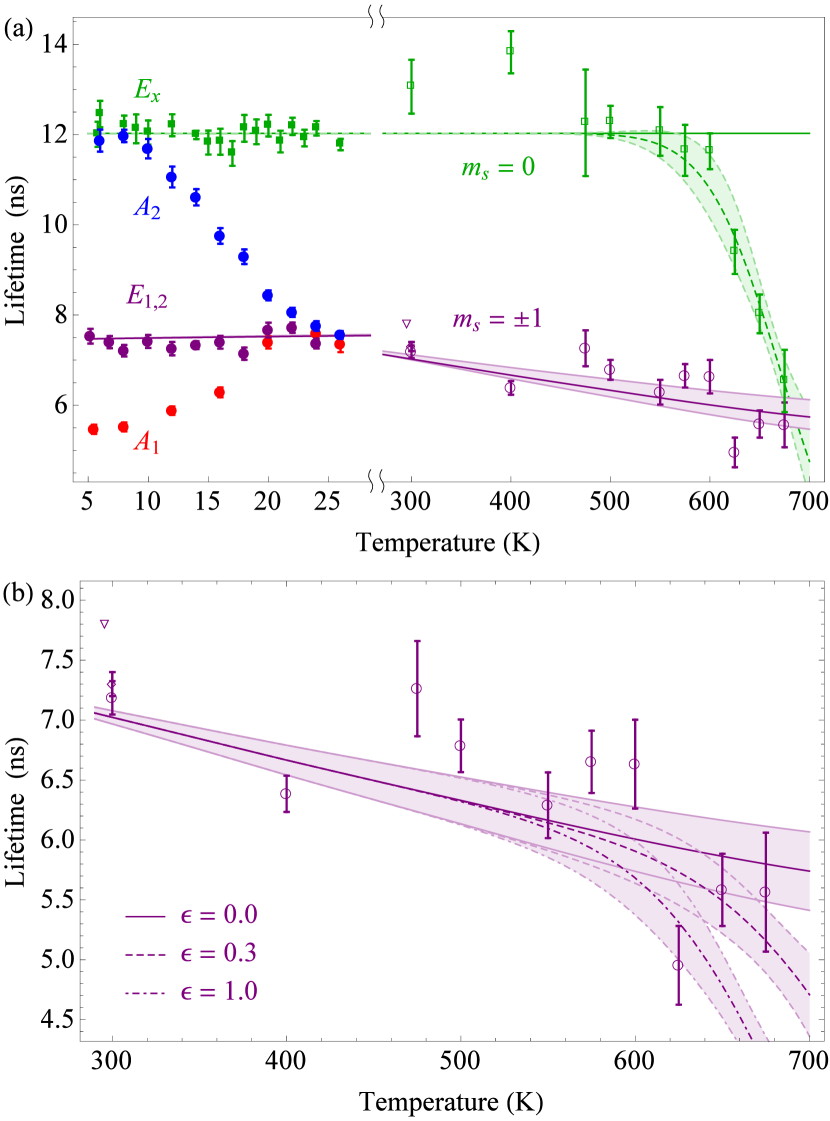
We plot the results of this calculation (purple), as well as the predicted temperature-independent lifetime of the states (solid green), in fig. 9. We observe that the predicted lifetimes are consistent with experimental observations Toyli et al. (2012); Batalov et al. (2008); Robledo et al. (2011a) for temperatures below 600 K. Above 600 K, it is clear that a temperature-dependent decay process for the states switches on. This process may also shorten the average lifetime of the states above 600 K, but the evidence for this assertion is not conclusive. This process has been previously attributed to a multi-phonon nonradiative relaxation from to and described by a Mott-Seitz model Toyli et al. (2012). We fit the high-temperature lifetime of the states (dashed green) using the Mott-Seitz model and the lifetime of 12.0 ns that has been measured at low temperature Goldman et al. to obtain the temperature-dependent decay rate from the states due to this high-temperature mechanism 222In terms of the Mott-Seitz formula given in Ref. Toyli et al., 2012, the high-temperature decay rate is given by , where is the frequency factor and is the energy barrier for the nonradiative process. We find eV and , which differ significantly from the values given in Ref. Toyli et al., 2012. This disagreement is not unexpected, however, because we assume a low-temperature lifetime of 12.0 ns whereas Toyli et al. fit a low-temperature lifetime of ns. Our fit therefore exhibits a sharper turn-on, resulting in a higher value of ; the frequency factor , which sets the vertical scaling and is extremely sensitive to , is correspondingly much larger.. To incorporate into the predicted lifetime of the states, we make the replacement in Eq. 25, where parameterizes how strongly the high-temperature decay mechanism couples to the states relative to the states. The predicted high-temperature lifetimes are shown in fig. 9. It is not obvious from the three relevant data points whether this high-temperature mechanism induces decay out of the states as it does out of the states.
The previous explanation given for the high-temperature decay is inconsistent with the model outlined in this work because there is no SO coupling between and and because phonons cannot couple to , which is SO-coupled to . Instead, we propose that one of two mechanisms may be responsible. First, this mechanism may be a SO-mediated transition from to the excited spin-singlet states. are SO-coupled to just as is SO-coupled to , so this mechanism would be exactly analogous to the ISC mechanism from . This mechanism may induce decay from the states because are coupled to by a spin-spin interaction Maze et al. (2011); Doherty et al. (2011). Because and exhibit a level anticrossing when the strain-induced splitting is approximately 7 GHz Robledo et al. (2011b), the spin-spin-mediated decay rate out of the states would be highly sensitive to crystal strain, making it difficult to predict a value of for this mechanism. Alternatively, this mechanism may be a direct nonradiative transition to the ground state. -symmetric phonons couple the states of the and manifolds. Consequently, the calculation of this rate would be similar to that of the ISC rate from , except that this mechanism would be a first-order process that does not involve SO coupling in addition to phononic coupling. This mechanism would be spin-conserving and couple to all states equally, implying .
While the theory of these two possible high-temperature decay mechanisms is beyond the scope of this work, we emphasize that they can be distinguished by further high-temperature spin-resolved fluorescence lifetime experiments, which could reduce the uncertainty in the parameter and measure the variation of with strain.
V Conclusion
We have presented a microscopic model of the ISC mechanism, which is mediated by spin-orbit coupling and, for some initial states, the emission of an -symmetric phonon. We have quantitatively shown the model’s predictions to be consistent with experimental observations, and have used this comparison to place bounds on the singlet-triplet energy spacing, an important but previously unknown property of the NV center’s level structure.
The bounds we place on have implications for efforts to engineer the ISC rate, which could increase the measurement readout visibility between and by increasing the ISC rate out of the states. We estimate that the ISC rate increases by MHz/meV as decreases. Because it is the competition of with MHz that gives rise to the fluorescence contrast between and , our finding suggests that a large ( meV) reduction in would be needed to achieve an appreciable improvement in nonresonant readout fidelity.
The application of isotropic hydrostatic pressure can induce large shifts ( meV Doherty et al. (2014)), but the direction of this shift corresponds to an increase in , which would reduce the ISC rate. Conversely, the application of uniaxial strain (specifically along the crystal axis) can induce energy shifts that reduce , but the structural integrity of bulk diamond under unavoidable shear forces limits these shifts to meV Davies and Hamer (1976); Rogers et al. (2014). It may be possible, however, to induce a suitably large shift in diamond nanofabricated structures MacQuarrie et al. (2013); Ovartchaiyapong et al. (2014), wherein the application of a small local force may cause a large strain at the NV center. One could measure this shift in the ISC rate either by the techniques employed in Ref. Goldman et al., or by measuring the visibility of ground state optically detected magnetic resonance (ODMR) as in Ref. Doherty et al., 2014. By identifying methods of strain application that maximize ODMR visibility, such an experiment could significantly enhance the spin initialization and readout techniques upon which room-temperature NV center applications depend.
Acknowledgments
The authors would like to thank J. Maze, A. Gali, E. Togan, A. Akimov, D. Sukachev, Q. Unterreithmeier, A. Zibrov, and A. Palyi for stimulating discussions and experimental contributions. This work was supported by NSF, CUA, the DARPA QUEST program, AFOSR MURI, ARC, Element Six, and the Packard Foundation. A. K. acknowledges support from the Alexander von Humboldt Foundation.
Appendix
We now consider the contribution to due to an ISC process that uses as intermediate states instead of . In this process, are SO-coupled to , and phonons of symmetry couple to . We modify Eq. II.4, with which we begin our calculation of , to include the contribution of this secondary process, finding
| (26) |
where is an excited vibrational level of that is separated from by an energy spacing and is the energy splitting. We add the two contributions’ amplitudes instead of their magnitudes because the final states arrived at by both processes are identical for given values of , , and . The two terms have opposite signs because the phonon is emitted first (second) for the mechanism using () as an intermediate state, making the detuning denominator negative (positive).
Because the energy spacing ( meV Acosta et al. (2010)) is large compared to the extent of the phonon sideband ( meV Davies (1974); Kehayias et al. (2013)), we make the simplifying assumption that is only appreciable for . We use this approximation, the expression for the phonon spectral density in the acoustic regime given by Eq. 9, and the identity operator to find
| (27) |
References
- Kucsko et al. (2013) G. Kucsko, P. C. Maurer, N. Y. Yao, M. Kubo, H. J. Noh, P. K. Lo, H. Park, and M. D. Lukin, Nature (London) 500, 54 (2013).
- Le Sage et al. (2013) D. Le Sage, K. Arai, D. R. Glenn, S. J. DeVience, L. M. Pham, L. Rahn-Lee, M. D. Lukin, A. Yacoby, A. Komeili, and R. L. Walsworth, Nature (London) 496, 486 (2013).
- Grinolds et al. (2013) M. S. Grinolds, S. Hong, P. Maletinsky, L. Luan, M. D. Lukin, R. L. Walsworth, and A. Yacoby, Nature Phys. 9, 215 (2013).
- Ermakova et al. (2013) A. Ermakova, G. Pramanik, J.-M. Cai, G. Algara-Siller, U. Kaiser, T. Weil, Y.-K. Tzeng, H. C. Chang, L. P. McGuinness, M. B. Plenio, B. Naydenov, and F. Jelezko, Nano Lett. 13, 3305 (2013).
- (5) A. O. Sushkov, N. Chisholm, I. Lovchinsky, M. Kubo, P. K. Lo, S. D. Bennett, D. Hunger, A. Akimov, R. L. Walsworth, H. Park, and M. D. Lukin, arXiv:1311.1801 .
- Dolde et al. (2011) F. Dolde, H. Fedder, M. W. Doherty, T. Nöbauer, F. Rempp, G. Balasubramanian, T. Wolf, F. Reinhard, L. C. L. Hollenberg, F. Jelezko, and J. Wrachtrup, Nature Phys. 7, 459 (2011).
- Doherty et al. (2014) M. W. Doherty, V. V. Struzhkin, D. A. Simpson, L. P. McGuinness, Y. Meng, A. Stacey, T. J. Karle, R. J. Hemley, N. B. Manson, L. C. L. Hollenberg, and S. Prawer, Phys. Rev. Lett. 112, 047601 (2014).
- Dutt et al. (2007) M. V. G. Dutt, L. Childress, L. Jiang, E. Togan, J. Maze, F. Jelezko, A. S. Zibrov, P. R. Hemmer, and M. D. Lukin, Science 316, 1312 (2007).
- van der Sar et al. (2012) T. van der Sar, Z. H. Wang, M. S. Blok, H. Bernien, T. H. Taminiau, D. M. Toyli, D. A. Lidar, D. D. Awschalom, R. Hanson, and V. V. Dobrovitski, Nature (London) 484, 82 (2012).
- Maurer et al. (2012) P. C. Maurer, G. Kucsko, C. Latta, L. Jiang, N. Y. Yao, S. D. Bennett, F. Pastawski, D. Hunger, N. Chisholm, M. Markham, D. J. Twitchen, J. I. Cirac, and M. D. Lukin, Science 336, 1283 (2012).
- Manson et al. (2006) N. B. Manson, J. P. Harrison, and M. J. Sellars, Phys. Rev. B 74, 104303 (2006).
- Toyli et al. (2012) D. M. Toyli, D. J. Christle, A. Alkauskas, B. B. Buckley, C. G. Van de Walle, and D. D. Awschalom, Phys. Rev. X 2, 031001 (2012).
- Batalov et al. (2008) A. Batalov, C. Zierl, T. Gaebel, P. Neumann, I.-Y. Chan, G. Balasubramanian, P. R. Hemmer, F. Jelezko, and J. Wrachtrup, Phys. Rev. Lett. 100, 077401 (2008).
- Robledo et al. (2011a) L. Robledo, H. Bernien, T. van der Sar, and R. Hanson, New J. Phys. 13, 025013 (2011a).
- Tetienne et al. (2012) J.-P. Tetienne, L. Rondin, P. Spinicelli, M. Chipaux, T. Debuisschert, J.-F. Roch, and V. Jacques, New J. Phys. 14, 103033 (2012).
- (16) M. L. Goldman, A. Sipahigil, M. W. Doherty, N. Y. Yao, S. D. Bennett, M. Markham, D. J. Twitchen, N. B. Manson, A. Kubanek, and M. D. Lukin, arXiv:1406.4065 .
- Kehayias et al. (2013) P. Kehayias, M. W. Doherty, D. English, R. Fischer, A. Jarmola, K. Jensen, N. Leefer, P. Hemmer, N. B. Manson, and D. Budker, Phys. Rev. B 88, 165202 (2013).
- Maze et al. (2011) J. R. Maze, A. Gali, E. Togan, Y. Chu, A. Trifonov, E. Kaxiras, and M. D. Lukin, New J. Phys. 13, 025025 (2011).
- Doherty et al. (2011) M. W. Doherty, N. B. Manson, P. Delaney, and L. C. L. Hollenberg, New J. Phys. 13, 025019 (2011).
- Rogers et al. (2008) L. J. Rogers, S. Armstrong, M. J. Sellars, and N. B. Manson, New J. Phys. 10, 103024 (2008).
- Doherty et al. (2013) M. W. Doherty, N. B. Manson, P. Delaney, F. Jelezko, J. Wrachtrup, and L. C. L. Hollenberg, Phys. Rep. 528, 1 (2013).
- Huxter et al. (2013) V. M. Huxter, T. A. A. Oliver, D. Budker, and G. R. Fleming, Nature Phys. 9, 744 (2013).
- Gali et al. (2011) A. Gali, T. Simon, and J. E. Lowther, New J. Phys. 13, 025016 (2011).
- Zhang et al. (2011) J. Zhang, C.-Z. Wang, Z. Z. Zhu, and V. V. Dobrovitski, Phys. Rev. B 84, 035211 (2011).
- Bransden and Joachain (2003) B. H. Bransden and C. J. Joachain, Physics of Atoms and Molecules, 2nd ed. (Prentice Hall, Harlow, 2003).
- Stoneham (2001) A. M. Stoneham, Theory of Defects in Solids (Oxford University Press, Oxford, 2001).
- Note (1) In group theoretical terms, the polarizations correspond to the first and second rows of the irreducible representation. Geometrically, phonons of these polarizations induce strain of symmetry, as defined in Ref. \rev@citealpnumMaze2011, which distorts the lattice in directions that are perpendicular to the N-V axis.
- Acosta et al. (2010) V. M. Acosta, A. Jarmola, E. Bauch, and D. Budker, Phys. Rev. B 82, 201202 (2010).
- Davies (1974) G. Davies, J. Phys. C 7, 3797 (1974).
- Weiss (2008) U. Weiss, Quantum Dissipative Systems, 3rd ed. (World Scientific, Hackensack, NJ, 2008) pp. 69–74.
- Fu et al. (2009) K.-M. C. Fu, C. Santori, P. E. Barclay, L. J. Rogers, N. B. Manson, and R. G. Beausoleil, Phys. Rev. Lett. 103, 256404 (2009).
- Bassett et al. (2014) L. C. Bassett, F. J. Heremans, D. J. Christle, C. G. Yale, G. Burkard, B. B. Buckley, and D. D. Awschalom, Science 345, 1333 (2014).
- (33) N. B. Manson, L. J. Rogers, M. W. Doherty, and L. C. L. Hollenberg, arXiv:1011.2840 .
- (34) M. W. Doherty, Ph.D. thesis, University of Melbourne, 2012.
- (35) The bounds meV and meV shown in Fig. 5 take into account both the large uncertainty in and the relatively small uncertainty in the measured rate. In Fig. 6, the uncertainty in the measured rate is already incorporated into the uncertainty in the measured ratio. Therefore, we use the slightly narrower bounds 349 meV and 427 meV, which reflect only the uncertainty in .
- (36) is a non-analytic function of (the energy spacing), (which parameterizes the electron-phonon coupling strength), and the measured ratio. We account for the uncertainties in each of these quantities by choosing the combinations of , (see above footnote), and that minimize and maximize .
- (37) We compare our extracted value of to the absorption PSB because this sideband spectrum reflects the phonon spectral density corresponding to electronic states in the manifold. This is in contrast to Sec. III.1, wherein we use the emission PSB to extract information about the phonon spectral density in (and in , by extension).
- Pavone et al. (1993) P. Pavone, K. Karch, O. Schütt, D. Strauch, W. Windl, P. Giannozzi, and S. Baroni, Phys. Rev. B 48, 3156 (1993).
- Warren et al. (1967) J. L. Warren, J. L. Yarnell, G. Dolling, and R. A. Cowley, Phys. Rev. 158, 805 (1967).
- Rogers et al. (2009) L. J. Rogers, R. L. McMurtrie, M. J. Sellars, and N. B. Manson, New J. Phys. 11, 063007 (2009).
- Note (2) In terms of the Mott-Seitz formula given in Ref. \rev@citealpnumToyli2012, the high-temperature decay rate is given by , where is the frequency factor and is the energy barrier for the nonradiative process. We find eV and , which differ significantly from the values given in Ref. \rev@citealpnumToyli2012. This disagreement is not unexpected, however, because we assume a low-temperature lifetime of 12.0 ns whereas Toyli et al. fit a low-temperature lifetime of ns. Our fit therefore exhibits a sharper turn-on, resulting in a higher value of ; the frequency factor , which sets the vertical scaling and is extremely sensitive to , is correspondingly much larger.
- Robledo et al. (2011b) L. Robledo, L. Childress, H. Bernien, B. Hensen, P. F. A. Alkemade, and R. Hanson, Nature (London) 477, 574 (2011b).
- Davies and Hamer (1976) G. Davies and M. F. Hamer, Proc. R. Soc. A 348, 285 (1976).
- Rogers et al. (2014) L. J. Rogers, M. W. Doherty, M. S. J. Barson, S. Onoda, T. Ohshima, and N. B. Manson, New J. Phys. 17, 013048 (2014).
- MacQuarrie et al. (2013) E. R. MacQuarrie, T. A. Gosavi, N. R. Jungwirth, S. A. Bhave, and G. D. Fuchs, Phys. Rev. Lett. 111, 227602 (2013).
- Ovartchaiyapong et al. (2014) P. Ovartchaiyapong, K. W. Lee, B. A. Myers, and A. C. Bleszynski Jayich, Nat. Commun. 5, 4429 (2014).