Disorder suppressed charge-density-wave and its origin in 1T-TaSe2-xTex
Abstract
In the sake of connecting the charge-density-wave (CDW) of TaSe2 and single-q CDW-type distortion of TaTe2, we present an overall electronic phase diagram of 1T-TaSe2-xTex (). In the experimentally prepared single crystals, the CDW is completely suppressed as , while superconductivity emerges as . Theoretically, similar to 1T-TaSe2 and 1T-TaTe2, the hypothetic 1T-TaSeTe with ordered Se/Ta/Te stacking shows instability in the phonon dispersion, indicating the presence of CDW in the ideally ordered sample. The contradictory between experimental and theoretical results suggests that the CDW is suppressed by disorder in 1T-TaSe2-xTex. The formation and suppression of CDW are found to be independent with Fermi surface nesting based on the generated electron susceptibility calculations. The calculation of phonon linewidth suggests the strong q-dependent electron-phonon coupling induced period-lattice-distortion (PLD) should be related to our observation: The doping can largely distort the TaX6 (X = Se, Te) octahedra, which are disorderly distributed. The resulted puckered Ta-Ta layers are not compatible with the two-dimensional PLD. Therefore, CDW is suppressed in 1T-TaSe2-xTex. Our results offer an indirect evidence that PLD, which can be influenced by strong disorder, is the origin of CDW in the system.
pacs:
71.45.Lr, 71.20.-b, 63.20.dkI Introduction
The origin of charge-density-wave (CDW) is a rather old but still long-standing issue in condensed matter physics.Peierls-book-1955 ; Peierls-book-1991 ; Frohlich-1954 Since the discovery of CDW in transition-metal dichalcogenides (TMDs), the layered structures and various CDWs make the TMDs a model class of materials to investigate the mechanism of CDW.Wilson-CDW-review Moreover, many typical TMDs show the coexistence and competition between superconductivity and CDW.Sipos-1T-TaS2-pressure ; Morosan-CuxTiSe2 ; Morosan-PdxTiSe2 ; Wagner-CuxTaS2 ; LLJ-EPL ; Ang-PRL ; LY-APL ; Ang-PRB ; LY-JAP The superconducting phase diagrams highly similar to those of unconventional superconductors have been found.Morosan-CuxTiSe2 ; Morosan-PdxTiSe2 ; Wagner-CuxTaS2 Many experimental and theoretical works were performed to investigate the CDW in TMDs in the sake of figuring out the mechanism of CDW and the interplay between CDW and superconductivity.Weber-PRL ; Dai-PRB ; Johannes-nesting ; AmyLiu-1T-TaS2 ; AmyLiu-1T-TaSe2 However, the origin of CDW is still under debate.
The CDW and accompanied period-lattice-distortion (PLD) are usually explained by Peierls picture.Peierls-book-1955 ; Peierls-book-1991 ; Frohlich-1954 ; Johannes-nesting In this picture, Fermi surface nesting, a pure electronic effect, drives the charge redistribution regardless of whether or not PLD subsequently happens. There is an opposite mechanism that the charge redistribution is driven by strong q-dependent electron-phonon coupling induced PLD, while Fermi surface nesting only plays a minor role.Chan-1973 Johannes et al.Johannes-nesting concluded that if a material with CDW originates from Fermi surface nesting, the generated electron susceptibility () must show peaks of its real part () and imaginary part () at the CDW vector (), and all phonons must soften at the same vector (although in theory it is unavoidable,Chiba-2003 such softening for multiple modes has never been actually observed in real materials. For example, ZrTe3Hoesch-2009 and KCPRenker-1973 have strong nesting at the CDW ordering wave vectors but only one mode softens). According to this conclusion, it seems to be clear that the Fermi surface nesting is ruled out in the origin of CDW in 2H-TMDs: The density-functional-theory (DFT) calculations show that there are no peaks of found at for 2H-NbSe2 and 2H-TaSe2, while shows weak peaks at .Johannes-nesting ; Johannes-NbSe2 ; Calandra-NbSe2 The PLD mechanism in 2H-TMDs is recently supported by more and more theoretical and experimental studies.AmyLiu-2H-TaSe2 ; Weber-PRL ; Dai-PRB
However, in 1T-TMDs, the situation seems to be complex. Both 1T-TaS2 and 1T-TaSe2 show 13.9∘ rotated commensurate-CDW (CCDW).Wilson-CDW-review The early reports show the calculated Fermi surface nesting vectors are well corresponding to ,Wilson-CDW-review ; TaS2-xray ; Myron-1975 ; Myron-1977 while the recent DFT calculations do not reflect the nesting vector at .AmyLiu-1T-TaS2 ; AmyLiu-1T-TaSe2 ; Yu-arxiv Strong electron-phonon coupling strengths at are obtained from the density-functional-perturbation-theory (DFPT)calculations for 1T-TaS2 and 1T-TaSe2 under pressure,DFPT ; AmyLiu-1T-TaS2 ; AmyLiu-1T-TaSe2 which supports the PLD mechanism. On the other hand, NbTe2 and TaTe2 are typical TMDs with monoclinic distorted-1T structure, for which the distortion could be considered as single-q CDW-type distortion with a vector of .Wilson-CDW-review ; Battaglia-NbTe2 ; Sharma-TaX2 Battaglia et al. suggested that the Fermi surface nesting plays a key role in the formation of such single-q CDW.Battaglia-NbTe2 A convincing origin of CDW in 1T-TMDs could not be obtained from the above confusing and contradictory results so far. More experimental evidences and theoretical investigations are needed to figure out the puzzle.
Previously, we reported the electronic phase diagrams for 1T-TaS2-xSex () and -TaS2-xSex (), in which the isovalent substitution does not completely suppress CDW of the end members.LY-APL ; LY-JAP If similar characteristic still exists in 1T-TaSe2-xTex (), a potential gradual variation from of 1T-TaSe2 to that of 1T-TaTe2 might be observed. Therefore, in the present work, we prepared a series of 1T-TaSe2-xTex () single crystals via the chemical-vapor-transport (CVT) method and obtained an overall electronic phase diagram through the transport measurements. Surprisingly, the CDW disappears in 1T-TaSe2-xTex as , which is beyond our expectation and destroys the connection of 1T-TaSe2 and 1T-TaTe2. Superconductivity emerges when . According to phonon calculations, the hypothetic ordered 1T-TaSeTe shows phonon instability similar to 1T-TaSe2 and 1T-TaTe2, indicating the CDW should exist if the doped sample is ideally ordered. It means that the disorder in experimentally prepared samples suppresses CDW. The formation and suppression of CDW are found to be independent with Fermi surface nesting based on the generated electron susceptibility calculations. The calculation of phonon linewidth suggests the CDW instability is strongly coupled with the q-dependent electron-phonon coupling induced period-lattice-distortion (PLD). Through analysis of the optimized structures of 1T-TaSe2, 1T-TaTe2, and 1T-TaSeTe with ordered Se/Ta/Te stacking structure, we found that the doping can largely distort the TaX6 (X = Se, Te) octahedra. The disordered distribution of such distorted octahedra will pucker Ta-Ta layers, which is not compatible with the two-dimensional PLD. That might be the reason why the CDW is suppressed in 1T-TaSe2-xTex. The interplay beween CDW and superconductivity is also discussed. Our results offer an indirect evidence that the CDW originates from PLD, which can be influenced by strong disorder.
II Experiment and calculation details
The single crystals were grown via the CVT method with iodine as a transport agent. The high-purity elements Ta, Se, and Te were mixed in chemical stoichiometry, and heated at 900∘C for 4 days in an evacuated quartz tube. The harvested TaSe2-xTex powders and iodine (density: 5 mg/cm3) were then sealed in an another quartz tube and heated for two weeks in a two-zone furnace, where the temperature of source and growth zones were fixed at 950∘C and 850∘C, respectively. The tubes were rapidly quenched in cold water to ensure retaining of the 1T phase. The X-ray diffraction (XRD) patterns were obtained on a Philips X′pert PRO diffractometer with Cu radiation ( = 1.5418 Å). Structural refinements were performed by using Rietveld method with the X′pert HighScore Plus software. The average stoichiometry was determined by examination of multiple points using X-ray energy dispersive spectroscopy (EDS) with a scanning electron microscopy (SEM). The EDS results indicate that the actual concentration x is close to the nominal one. The resistivity () measurements down to 2.0 K were carried out by the standard four-probe method in a Quantum Design Physical Property Measurement System (PPMS).
The DFT calculations were carried out using QUANTUM ESPRESSO package with ultrasoft pseudopotentials.QE The exchange-correlation interaction was treated with the local-density-approximation (LDA) according to Perdew and Zunger.pz The energy cutoff for the plane-wave basis set was 35 Ry. Brillouin zone sampling is performed on the Monkhorst-Pack (MP) mesh of .MP The Vanderbilt-Marzari Fermi smearing method with a smearing parameter of Ry was used for the calculations of the total energy and electron charge density. Phonon dispersions were calculated using DFPT with an mesh of q-points. In order to investigate the electron-phonon coupling around the q, denser and mesh of k-points, q-points were used.
III Results and discussion
The single crystal XRD patterns of 1T-TaSe2-xTex ( = 0, 1, and 2) are shown in Fig. 1(a), in which only () reflections were observed, suggesting the c-axis is perpendicular to the surface of single crystal. With increasing x, the diffraction peaks distinctly shift to lower angles, reflecting the crystal expansion induced by Te doping. To further confirm the structure, several single crystals were crushed and used in the powder XRD experiment. Figures 1(b)-(d) show the powder XRD patterns and the structural refinement results of Rietveld analysis for the selected samples with x = 0, 1, and 2. Figure 1(e) shows the enlargement of the (011) peak for x = 1, 1.5, and 2. It shows that the ideal CdI2-type 1T structure for x = 1 leads to a single (011) peak while there are double peaks in the monoclinic distorted-1T structure for x = 2. One should notice that the (011) peak starts to split when x = 1.5, indicating the emergence of distorted-1T structure, as shown in Fig. 1(e). The evolution of lattice parameters (a, c) and unit cell volume (V) of 1T-TaSe2-xTex are depicted in Fig. 1(f). Indeed, the values of a, c, and V monotonously increase with x, in accordance with the larger ion radius of Te than that of Se.
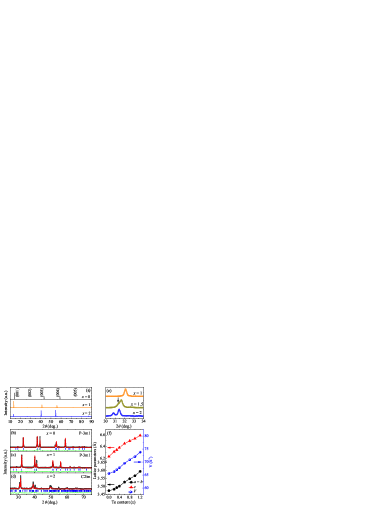
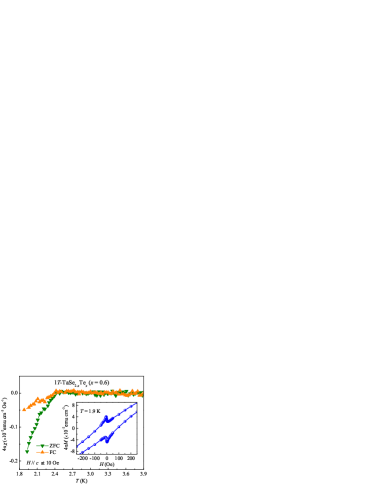
Figure 2 shows the temperature dependences of in-plane resistivity ratio () of 1T-TaSe2-xTex single crystals. The room temperature resistivity is about 1.4 m cm for x = 0. The values of resistivity for the Te-doped samples keep at this order of magnitude. In addition, the residual resistivity ratio (RRR = ) is calculated as 17.4 for . For the Te-doped samples, it sharply decreases to 2.66 for , and reaches the minimum 0.48 for , and then slightly increases to 1.13 for (the value of RRR is 0.85 for ). The small values of RRR may be as a reflection of the substantial disorder present in Te-doped samples, which will be further discussed in the calculation part. As shown in the inset of Fig. 2(a), the signature of superconductivity emerges as , and finally disappears for within our measurement limitation K. The maximum of superconducting onset temperature () is 2.5 K for x = 0.6. To further confirm the superconductivity, we also measured the magnetic properties of the superconducting samples at H = 10 Oe with the magnetic field paralleling to the c-axis. As an example, Fig. 3 shows the result of the optimal sample 1T-TaSe1.4Te0.6. Undoubtedly, the diamagnetism signal at low temperatures demonstrates the occurrence of superconductivity, of which the transition temperature (T) defined by the onset point of zero-field-cooling (ZFC) and field-cooling (FC) curves is 2.45 K for . The inset of Fig. 3 shows the magnetization hysteresis loop M(H) obtained at T = 1.9 K, which shows it is a typical type-II superconductor.
Figure 2(b) shows the high temperature part of . As shown in the inset of Fig. 2(b), 1T-TaSe2 exhibits a CDW transition at K, which is defined by the minimum of , with the formation of superstructure. The resistivity shows an upturn upon cooling due to the presence of gapping in the Fermi surface. With increasing Te content, the CDW transition gradually shifts to lower temperatures. It can be found that the CDW unexpectedly disappears when .
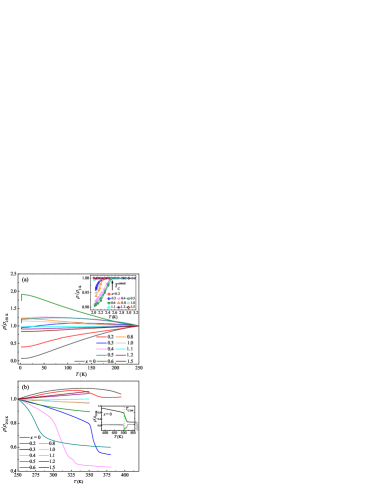
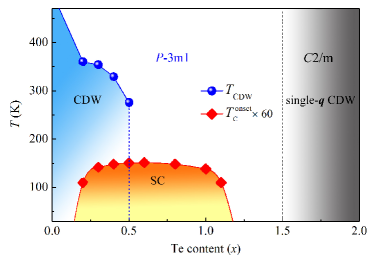
Figure 4 summarizes the overall electronic phase diagram as a function of temperature and doping level in 1T-TaSe2-xTex. The x dependence of follows a dome-like shape. The superconductivity induced by isovalent doping is similar to that in 1T-TaS2-xSex.LY-APL However, the CDW is gradually suppressed by Te doping and disappears as , which is quite different from the situation in 1T-TaS2-xSex.LY-APL With heavier Te content , the crystal structure gradually distorts to monoclinic distorted-1T structure, which could also be considered as a single-q CDW-type distortion.Wilson-CDW-review ; Sharma-TaX2
To investigate the suppression of CDW in 1T-TaSe2-xTex system, we calculated the two end members of 1T-TaSe2 and 1T-TaTe2, and the simplest hypothetical sample 1T-TaSeTe with an ordered stacking of Se/Ta/Te, which is represented as 1T-TaSeTe(O). The fully optimized structural parameters, as listed in Table 1, are close to those from the previous LDA calculation.AmyLiu-1T-TaSe2 The underestimation of lattice parameters is expectable for LDA.AmyLiu-1T-TaSe2
| a(Å) | c(Å) | ||
|---|---|---|---|
| TaSe2 | 3.406 | 6.086 | |
| TaSeTe(O) | 3.507 | 6.337 | , |
| TaTe2 | 3.622 | 6.572 |
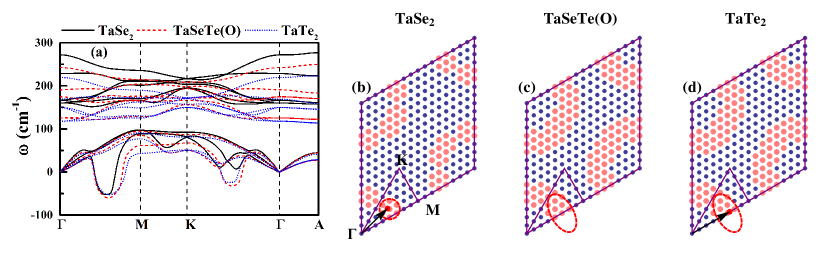
The phonon calculation is an effective method to simulate the CDW instability: The calculated phonon instabilities of 2H-NbSe2,Johannes-NbSe2 2H-TaSe2,AmyLiu-2H-TaSe2 1T-NbTe2,Battaglia-NbTe2 and 1T-TaX2 (X = S, Se, Te),AmyLiu-1T-TaS2 ; AmyLiu-1T-TaSe2 ; Battaglia-NbTe2 just locate at the CDW vectors of these TMDs. Moreover, Liu et al. show the calculated phonon instability of 1T-TaS2 is suppressed by pressure while the disappearance of CDW for pressurized 1T-TaS2 is experimentally confirmed,AmyLiu-1T-TaS2 ; Sipos-1T-TaS2-pressure conclusively proving that the calculated phonon instability can correctly reflect the CDW instability. Therefore, our theoretical investigation of 1T-TaSe2-xTex started with the phonon calculation. Figure 5(a) shows the phonon dispersions of 1T-TaSe2, 1T-TaSeTe(O), and 1T-TaTe2. For 1T-TaSe2, the phonon dispersions are in good agreement with the previous calculation by Ge et al..AmyLiu-1T-TaSe2 As shown in Fig. 5(b), one can notice that the calculated instability is just around the reported CCDW vector ().TaS2-xray For 1T-TaTe2, the area of instability is centered near , which is corresponding to the reported () single-q CDW-type superlattice.Battaglia-NbTe2 The high coincidence of the calculated and experimentally reported instabilities strongly proves the reliability and accuracy of the phonon calculation in the CDW systems. Moreover, different from 1T-TaSe2, 1T-TaTe2 shows much larger area of instability, which expands to the K line. That might be the reason why 1T-TaSe2 only shows small atomic displacement in CDW phase, which can be suppressed by high temperature, while the single-q CDW-type distortion in TaTe2 is very stable and the ideal 1T structure has never been observed.
Surprisingly, for 1T-TaSeTe(O), a phonon instability can be found as well, as shown in Figs. 5(a) and (c). The area of instability is very similar to that of 1T-TaTe2, implying that if 1T-TaSeTe with such ordered structure exists, CDW (single-q type) should be observed as in the case of 1T-TaTe2. However, according to the experimentally obtained phase diagram of Fig. 4, one should notice that the CDW or CDW-type distortion only exists in the Se-rich or Te-rich areas (the concentration ), in which the disorder is not prominent. In the middle area, stronger disorder can be expected, which might be responsible for the disappearance of CDW.
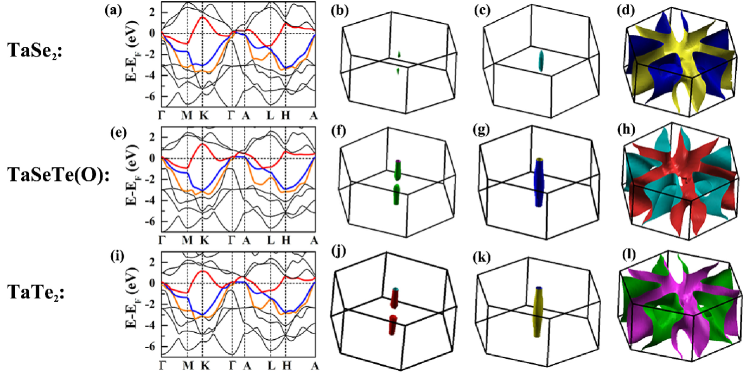
In order to figure out how the disorder influences the CDW, we further performed some indirect calculations to investigate whether the disorder affects the Fermi surface nesting or PLD. Figure 6 shows the band structures and Fermi surfaces of 1T-TaSe2, 1T-TaSeTe(O), and 1T-TaTe2. For 1T-TaSe2, the early calculations show there is only one band crossing Fermi energy (), which does not cross in the vicinity of point.Myron-1975 ; Woolley-1977 Moreover, there is a gap (about 0.1 0.2 eV) below the band crossing .Myron-1975 ; Woolley-1977 However, the recent angle-resolved photoemission (ARPES) experiment clearly shows a hybridization of bands at close to , where small hole-type pockets are observed.Bovet-ARPES Obviously, our LDA calculations accurately simulated the band structure of 1T-TaSe2 (Fig. 6(a)). Three bands cross : The lower two bands (colored in blue and orange in Fig. 6(a)) form small cylindrical hole-type pockets close to (Figs. 6(b) and (c)); The Fermi surface introduced from the higher band crossing (colored in red in Fig. 6(a)) is shown in Fig. 6(d). For 1T-TaSeTe(O) and 1T-TaTe2, one can notice that the band structures and Fermi surfaces (Figs. 6(e)-(l)) are highly similar to those of 1T-TaSe2.
The Fermi surface nesting can be reflected in generated electron susceptibility. The real part of the electron susceptibility is defined as
| (1) |
where is Fermi-Dirac function. The imaginary part isJohannes-nesting
| (2) |
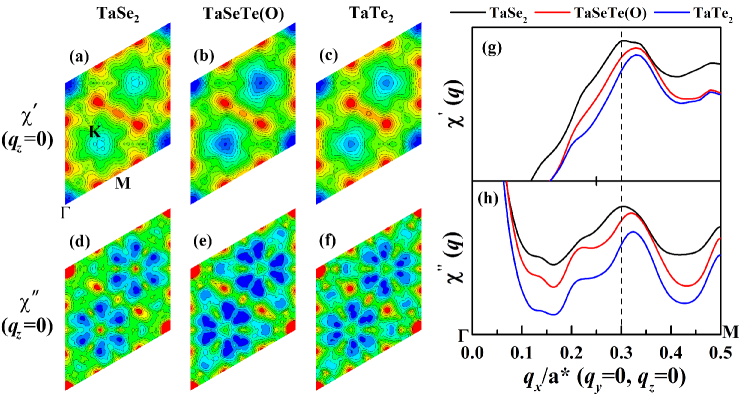
We used a mesh of approximately 40,000 k points in the full reciprocal unit cell to calculate the energy eigenvalues derived for the electron susceptibilities. Figures 7(a)-(f) show the cross sections of and with = 0 for 1T-TaSe2, 1T-TaSeTe(O), and 1T-TaTe2. We found that all the maxima of and of 1T-TaSe2, 1T-TaSeTe(O), and 1T-TaTe2 locate between and M points. And the maxima shift towards M point with increasing Te content (Figures 7(g) and (h)). For 1T-TaSe2, both the maxima of and locate at . Earlier calculation by Myron et al. shows a peak of at ,Myron-1977 while recent calculation by Yu et al. reports a maximum of at .Yu-arxiv Clearly, the maxima of and locate far away from . Although Myron et al. suggested that the peak of at can lead to CDW of 1T-TaSe2,Myron-1977 we still consider that it is farfetched to connect the nesting vector with a CDW vector of .
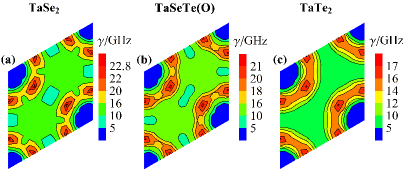
On the other hand, we investigated whether the PLD is coupled with CDW. We have calculated the electron-phonon coupling in the = 0 plane for 1T-TaSe2, 1T-TaSeTe(O), and 1T-TaTe2. Figure 8 shows the calculated phonon linewidth of the lowest phonon modes in the = 0 plane. The phonon linewidth is defined by
| (3) |
in which the electron-phonon coefficients are defined as,
| (4) |
According to this definition, , which reflects the electron-phonon coupling contribution, is a quantity that does not depend on real or imaginary nature of the phonon frequency.Calandra-NbS2 Although the calculation with q-points is not enough to deduce the accurate vector with maximum , it can still qualitatively reflect the role of electron-phonon coupling. In the instability area, the of the lowest mode is hundreds times larger than those of higher modes, proving the connection between electron-phonon coupling and CDW. For 1T-TaSe2, the biggest (23.11 GHz) is found near the place where shows the maximum, which is understandable since Fermi surface nesting can enhance according to Eqs.( 3) and ( 4). The second largest (22.18 GHz) is found in the place very near the reported . Therefore, if we neglect the enhancement of nesting, one can find the area of q-points with large is centered at the reported . For 1T-TaTe2 and 1T-TaSeTe(O), the large area is largely broadened and expands to K, which is coincide with the phonon instability area shown in Fig. 5. Meanwhile, and show small values in the place between and K points. Therefore, we can conclude that the q-dependent electron-phonon coupling induced PLD, instead of Fermi surface nesting, is responsible for CDW in 1T-TaSe2-xTex system.
Moreover, if we consider the PLD is the origin of CDW, the disappearance of CDW in the phase diagram is understandable. From Table 1, one can notice that the optimized z-coordinates of X atoms in pristine 1T-TaX2 (X = Se, Te) is about . However, for 1T-TaSeTe(O), the z-coordinates of X atoms change to and , which means the TaX6 octahedra are largely distorted. When the Se and Te atoms are randomly mixed, disordered distortions of TaX6 octahedra can be expected in the crystal, leading to the puckered Ta-Ta layers. Obviously it is not compatible with two-dimensional PLD. That might be the reason why disorder completely suppresses CDW in 1T-TaSe2-xTex system.
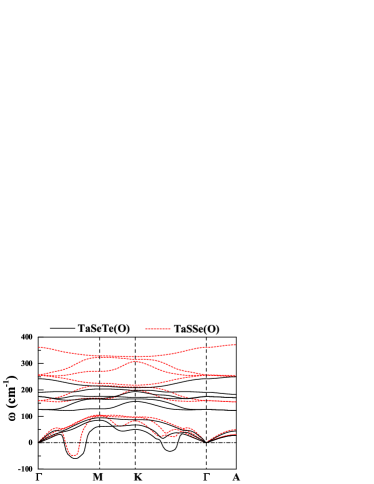
To understand the difference between 1T-TaSe2-xTex and 1T-TaS2-xSex, a similar hypothetic 1T-TaSSe(O) was also designed and calculated. Figure 9 compares the phonon dispersion of 1T-TaSeTe(O) and that of 1T-TaSSe(O). The instability of 1T-TaSSe(O) is only found between and M points. One can expect that a small area of instability should exist in 1T-TaSSe(O), just like that in 1T-TaSe2 (Fig. 5(b)). Such similarity might indicate that the ordered structure of TaSSe can potentially be prepared in 1T structure. On the other hand, the instability of 1T-TaSeTe(O) is broadened and expands to the K line, just like the case in 1T-TaTe2. The large area of instability leads to a very stable single-q CDW-type distortion (monoclinic structure) in TaTe2, so that the ideal 1T-structure has never been observed in TaTe2. Similarly, if TaSeTe has the ordered structure, it would show monoclinic structure as well. However, our experimentally prepared TaSeTe clearly shows 1T structure. According to such analysis, one can conclude the ordered structure of 1T-TaSSe(O) should be more stable than that of 1T-TaSeTe(O). In other words, the disorder in 1T-TaSeTe is much stronger than that in 1T-TaSSe. It could explain that in 1T-TaS2-xSex () CDW exists with all x, while in 1T-TaSe2-xTex () the CDW or CDW-type distortion is suppressed as . Very recently, the ordered structure of 1T-TaSSe(O)Ang-Natcommun and the disorder in 1T-TaSeTeHuixia-PNAS have been experimentally suggested, which support our deduction.
The PLD mechanism might help to understand the appearance of superconductivity in this system. The electron-phonon coupling strength for each mode () is defined as,
| (5) |
An imaginary frequency of the phonon mode indicates the phase instability (in our case it indicates the CDW distortion). When the CDW is suppressed, the stabilizing of 1T structure will make the imaginary frequency around become a small real value, just like the cases of 1T-TaS2 and 1T-TaSe2 under pressure.AmyLiu-1T-TaS2 ; AmyLiu-1T-TaSe2 The large and small real in Eq.( 5) can lead to a large electron-phonon coupling constant, which might be the reason why superconductivity emerges when CDW is suppressed. Further measurements are needed to verify the above arguments.
IV Conclusion
In order to connect the CDW of 1T-TaSe2 and the CDW-type distortion of 1T-TaTe2, we prepared a series of 1T-TaSe2-xTex () single crystals and summarized an overall electronic phase diagram through the transport measurements, in which a dome-like superconducting region is observed. The CDW disappears in 1T-TaSe2-xTex as , which is unexpected since the similar isovalent doping in 1T-TaS2-xSex does not seem to completely suppress CDW.
In order to understand the experimental results, we performed DFT calculations on 1T-TaSe2, 1T-TaTe2, and the hypothetic ordered 1T-TaSeTe. 1T-TaSe2 and 1T-TaTe2 show similar phonon dispersions and instabilities, indicating the distortions of the two end members originate from the same mechanism. Similar instability is also found in the hypothetic ordered 1T-TaSeTe while CDW disappears in experimentally prepared 1T-TaSeTe, implying CDW in real 1T-TaSe2-xTex is suppressed by disorder. Based on the generated electron susceptibility calculations, the formation and suppression of CDW in 1T-TaSe2-xTex are found to be independent of Fermi surface nesting. Through analysis of the optimized structures of 1T-TaSe2, 1T-TaTe2, and 1T-TaSeTe(O), we found that the Te doping can largely distort the TaX6 (X = Se, Te) octahedra. The disordered distribution of those distorted octahedra will pucker Ta-Ta layers, which is not compatible with the two-dimensional PLD. That might be why CDW is suppressed in 1T-TaSe2-xTex system. The interplay of CDW and superconductivity is also discussed. Our results offer an indirect evidence that the PLD, which can be influenced by strong disorder, is the origin of CDW in the system.
Acknowledgements.
This work was supported by the National Key Basic Research under Contract No. 2011CBA00111, the National Nature Science Foundation of China under Contract Nos. 11304320, 11404342, 11204312 and 11274311, the Joint Funds of the National Natural Science Foundation of China and the Chinese Academy of Sciences Large-scale Scientific Facility (Grand No. U1232139), Anhui Provincial Natural Science Foundation under Contract No. 1408085MA11, and the Director s Fund under Contract No.YZJJ201311 of Hefei Institutes of Physical Science, Chinese Academy of Sciences.References
- (1) R. E. Peierls, Quantum Theory of Solids (Clarendon, Oxford, 1955).
- (2) R. E. Peierls, More Surprises in Theoretical Physics (Princeton University Press, Princeton N.J., 1991).
- (3) H. Fröhlich, Proc. R. Soc. A 233, 296 (1954).
- (4) J. A. Wilson, F. J. Di Salvo, and S. Mahajan, Adv. Phys. 24, 117 (1975).
- (5) B. Sipos, A. F. Kusmartseva, A. Akrap, H. Berger, L. Forró, and E. Tutiš, Nature Mater. 7, 960 (2008).
- (6) E. Morosan, H. W. Zandbergen, B. S. Dennis, J. W. G. Bos, Y. Onose, T. Klimczuk, A. P. Ramirez, N. P. Ong, and R. J. Cava, Nature Physics 2, 544 (2006).
- (7) E. Morosan, K. E. Wagner, L. L. Zhao, Y. Hor, A. J. Williams, J. Tao, Y. Zhu, and R. J. Cava, Phys. Rev. B 81, 094524 (2010).
- (8) K. E. Wagner, E. Morosan, Y. S. Hor, J. Tao, Y. Zhu, T. Sanders, T. M. McQueen, H. W. Zandbergen, A. J. Williams, D. V. West, and R. J. Cava, Phys. Rev. B 78, 104520 (2008).
- (9) L. J. Li, W. J. Lu, X. D. Zhu, L. S. Ling, Z. Qu, and Y. P. Sun, Europhys. Lett. 97, 67005 (2012).
- (10) R. Ang, Y. Tanaka, E. Ieki, K. Nakayama, T. Sato, L. J. Li, W. J. Lu, Y. P. Sun, and T. Takahashi, Phys. Rev. Lett. 109, 176403 (2012).
- (11) Y. Liu, R. Ang, W. J. Lu, W. H. Song, L. J. Li, and Y. P. Sun, Appl. Phys. Lett. 102, 192602 (2013).
- (12) R. Ang, Y. Miyata, E. Ieki, K. Nakayama, T. Sato, Y. Liu, W. J. Lu, Y. P. Sun, and T. Takahashi, Phys. Rev. B 88, 115145 (2013).
- (13) Y. Liu, L. J. Li, W. J. Lu, R. Ang, X. Z. Liu, and Y. P. Sun, J. Appl. Phys. 115, 043915 (2014).
- (14) F. Weber, S. Rosenkranz, J. -P. Castellan, R. Osborn, R. Hott, R. Heid, K. -P. Bohnen, T. Egami, A. H. Said, and D. Reznik. Phys. Rev. Lett. 107, 107403 (2011).
- (15) J. X. Dai, E. Calleja, J. Alldredge, X. D. Zhu, L. J. Li, W. J. Lu, Y. P. Sun, T. Wolf, H. Berger, and K. McElroy, Phys. Rev. B 89, 165140 (2014).
- (16) M. D. Johannes and I. I. Mazin, Phys. Rev. B 77, 165135 (2008).
- (17) A. Y. Liu, Phy. Rev. B 79, 220515(R) (2009).
- (18) Y. Ge and Amy Y. Liu, Phy. Rev. B 82. 155133 (2010).
- (19) S. -K. Chan and V. Heine, J. Phys. F: Metal Phys. 3, 795 (1973).
- (20) S. Chiba and Y. Ono, J. Phys. Soc. Jpn. 72, 1995 (2003).
- (21) M. Hoesch, A. Bosak, D. Chernyshov, H. Berger, and M. Krisch, Phys. Rev. Lett. 102, 086402 (2009).
- (22) B. Renker, H. Rietschel, L. Pintschovins, W. Glässer, P. Brüesch, D. Kuse, and M. J. Rice, Phys. Rev. Lett. 30, 1144 (1973).
- (23) M. D. Johannes, I. I. Mazin, and C. A. Howells, Phys. Rev. B 73, 205102 (2006).
- (24) M. Calandra, I. I. Mazin, and F. Mauri, Phys. Rev. B 80, 241108(R) (2009).
- (25) Y. Ge and A. Y. Liu, Phys. Rev. B 86, 104101 (2012).
- (26) S. Tanda, T. Sambongi, T. Tani, and S. Tanaka, J. Phys. Soc. Jpn. 53, 476 (1984).
- (27) H. W. Myron and A. J. Freeman, Phys. Rev. B 11, 2735 (1975).
- (28) H. W. Myron, J. Rath, and A. J. Freeman, Phys. Rev. B 15, 885 (1977).
- (29) X. L. Yu, D. Y. Liu, H. -Q. Lin, T. Jia, L. -J. Zou, arXiv: 1407.1407 (2014).
- (30) S. Baroni, S. de Gironcoli, A. Dal Corso, and P. Giannozi, Rev. Mod. Phys. 73, 515 (2001).
- (31) C. Battaglia, H. Cercellier, F. Clerc, L. Despont, M. G. Garnier, C. Koitzsch, P. Aebi, H. Berger, L. Forró, and C. Ambrosch-Draxl, Phys. Rev. B 72, 195114 (2005).
- (32) S. Sharma, L. Nordström, and B. Johansson, Phys. Rev. B 66, 195101 (2002).
- (33) P. Giannozzi, S. Baroni, N. Bonini, M. Calandra, R. Car, C. Cavazzoni, D. Ceresoli, G. L. Chiarotti, M. Cococcioni, I. Dabo, A. D. Corso, S. de Gironcoli, S. Fabris. G. Fratesi, R. Gebauer, U. Gerstmann, C. Gougoussis, A. Kokalj, M. Lazzeri, L. M. -Samos, N. Marzari, F. Mauri, R. Mazzarello, S. Paolini, A. Pasquarello, L. Paulatto, C. Sbraccia, S. Scandolo, G. Sclauzero, A. P. Seitsonen, A. Smogunov, P. Umari, and R. M. Wentzcovitch, J. Phys.: Condens. Matter 21, 395502 (2009).
- (34) J. P. Perdew and A. Zunger, Phys. Rev. B 23, 5048 (1981).
- (35) H. J. Monkhorst and J. D. Pack, Phys. Rev. B 13, 5188 (1976).
- (36) H. X. Luo, W. W. Xie, J. Tao, H. Inoue, A. Gyenis, J. W. Krizan, A. Yazdani, Y. M. Zhu, and R. J. Cava, P. Natl. Acad. Sci. USA (2015) doi:10.1073/pnas.1502460112.
- (37) A. M. Woolley and G. Wexler, J. Phys. C: Solid State Phys. 10, 2601 (1977).
- (38) M. Bovet, D. Popović, F. Clerc, C. Koitzsch, U. Probst, E. Bucher, H. Berger, D. Naumović, and P. Aebi, Phys. Rev. B 69, 125117 (2004).
- (39) M. Leroux, M. Le Tacon, M. Calandra, L. Cario, M-A. Méasson, P. Diener, E. Borrissenko, A. Bosak, and P. Rodière, Phys. Rev. B 86, 155125 (2012).
- (40) R. Ang, Z. C. Wnag, C. L. Chen, J. Tang, N. Liu, Y. Liu, W. J. Lu, Y. P. Sun, T. Mori, and Y. Ikuhara, Nat. Commun. 6, 6091 (2015).